Technical & Derivatives Report
November 10, 2015
Sensex (26121) / Nifty (7915)
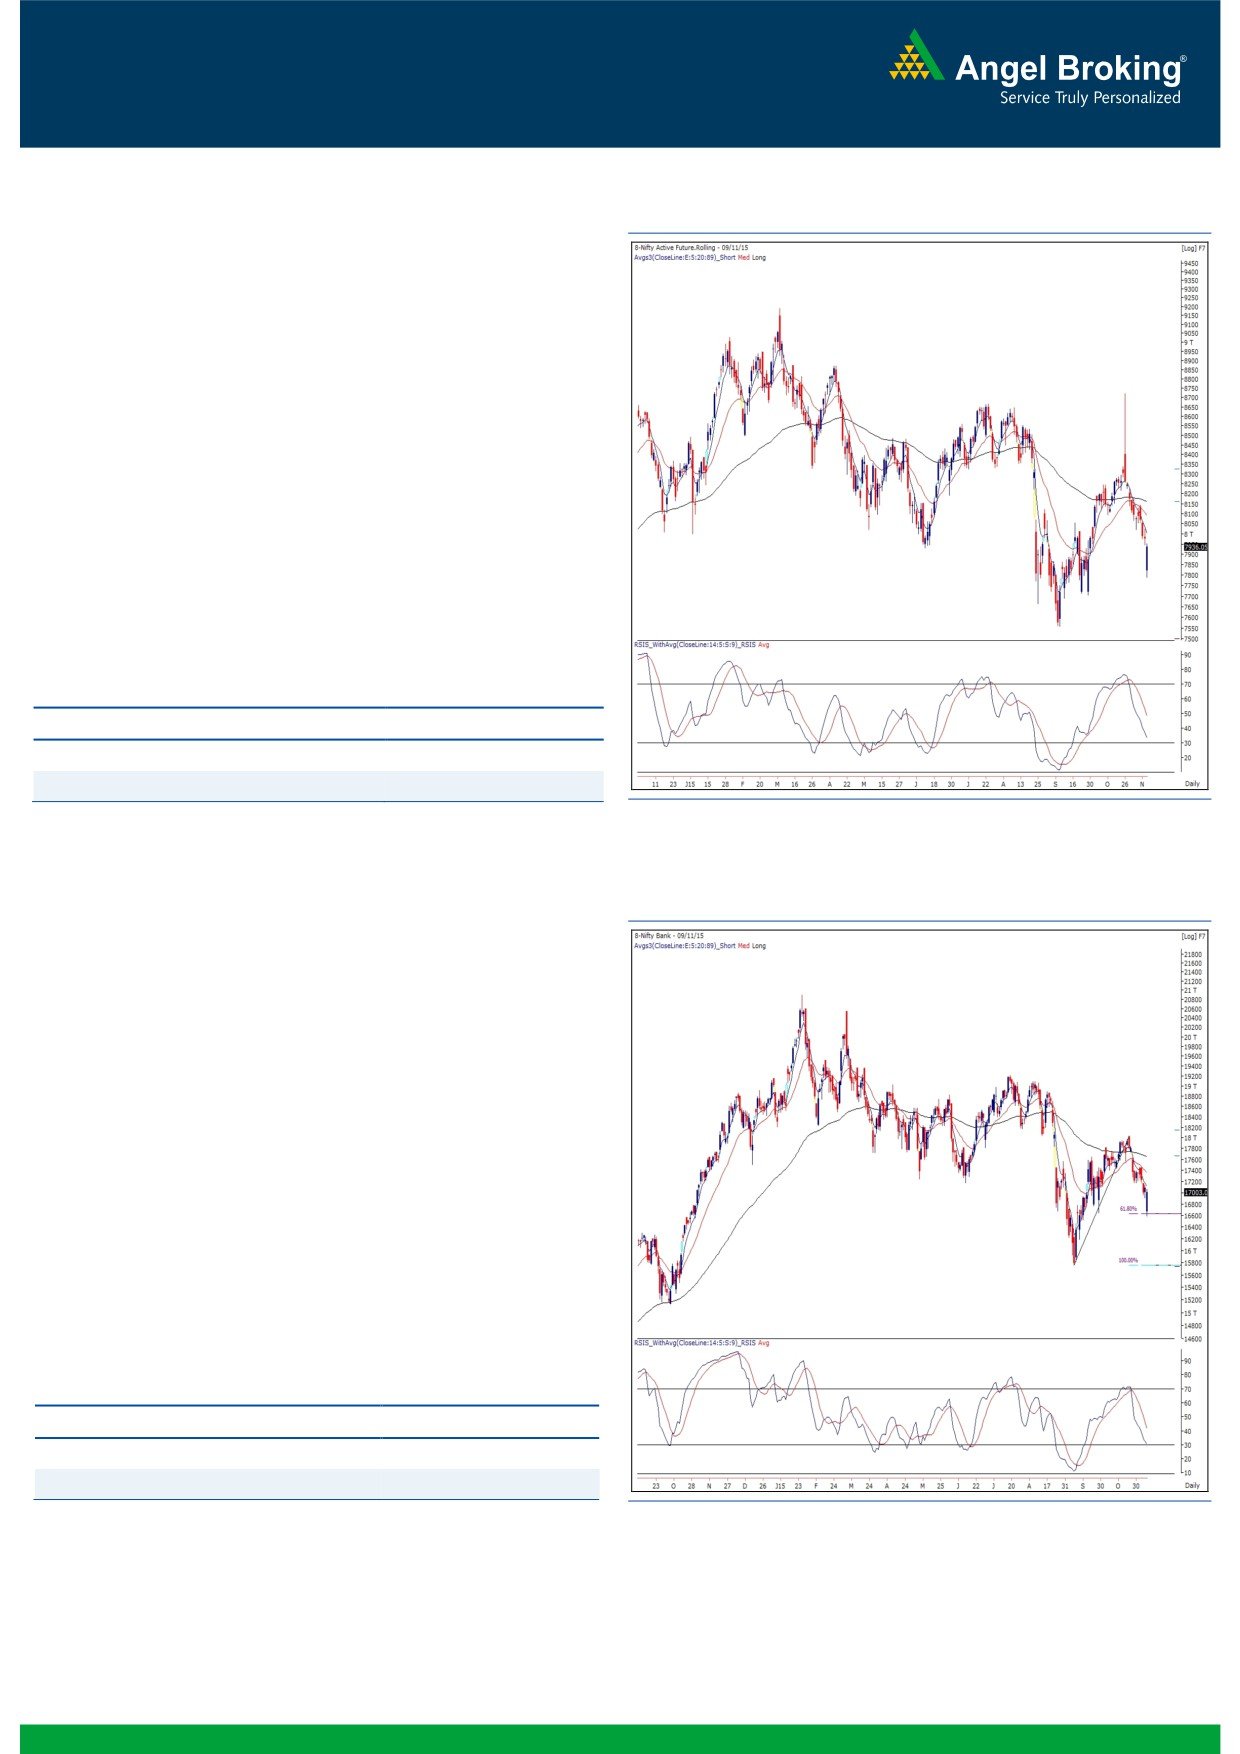
Exhibit 1: Nifty Future Daily Chart
Our markets started the week on a pessimistic note as the
benchmark index (Nifty) opened with nearly two percent
downside gap over BJP’s defeat in Bihar. However, in-line with
our view, the Nifty tested (sneaked slightly below) the 7800
mark and then gave a smart recovery throughout the
remaining part of the day to close with nominal losses.
Considering yesterday’s price action along with the chart
structure of some of the index heavyweights, it seems that
7800 is likely to provide a decent support to our market. Thus,
it’s not advisable to short the market at this juncture. We
would rather advise to wait for clear signals to initiate
positions in the index. We see Nifty moving within a range of
7800 - 8100 for next few sessions. A prudent strategy would
be to concentrate on stock specific actions with a proper exit
strategy.
Key Levels
Support 1 - 7845
Resistance 1 - 8003
Support 2 - 7800
Resistance 2 - 8100
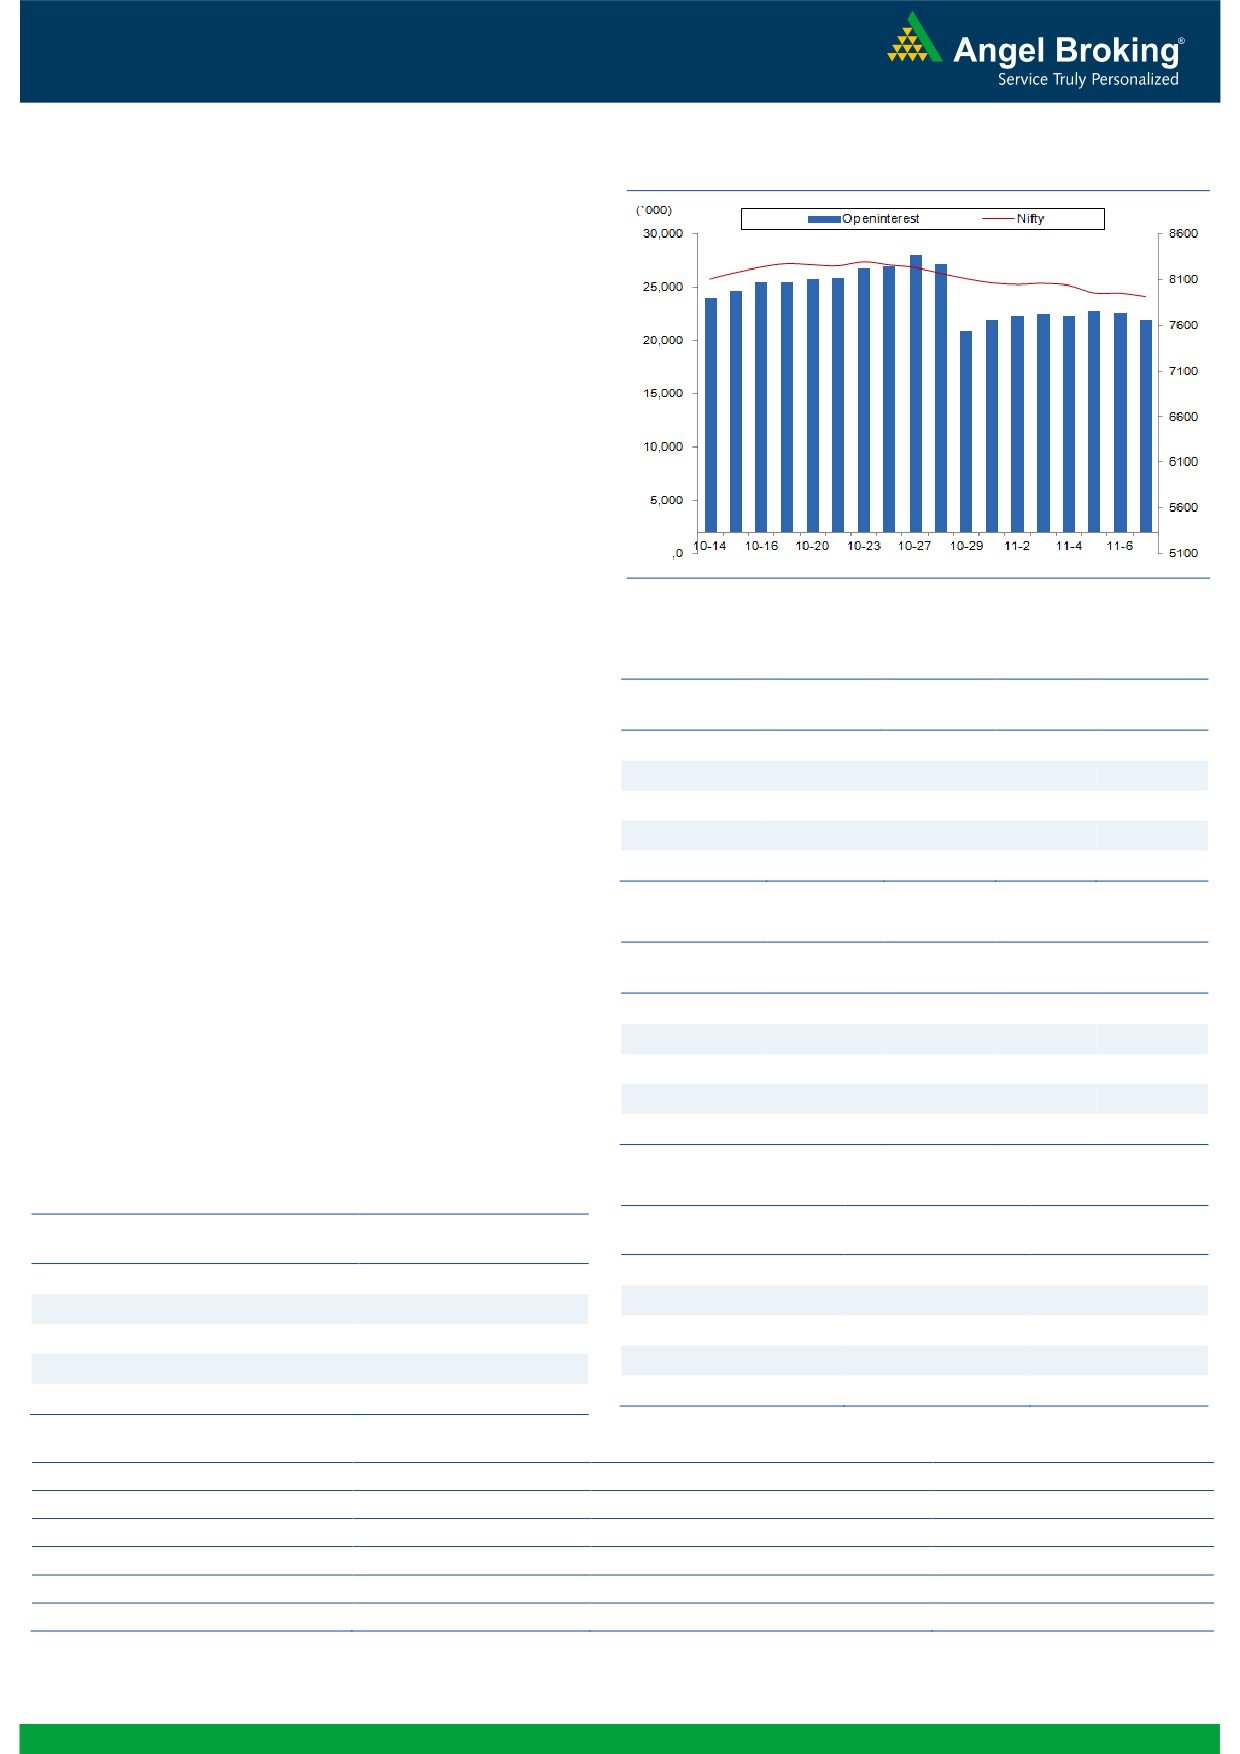
Exhibit 2: Bank Nifty Daily Chart
Bank Nifty Outlook - (17003)
In-line with broader indices, the Bank Nifty too opened with a
deep cut of more than 450 points in yesterday’s session. Post
the minor correction in the initial trades, the banking index
started recovering piercingly and continued to make ‘Higher
Highs Higher Lows’ throughout the session. Eventually, the
Bank Nifty ended the session with a loss of 0.49 percent over
its previous close.
Yesterday, the banking index found a support around the
61.80% retracement levels of the recent up move and started
rebounding. Going forward, the pull back may continue
towards 17150 - 17200 levels. But, we need to wait for a
sustainable move above 17200 levels to form a directional
bullish view in the index. On the flipside, an immediate
support for the index is placed at 16700 and 16585 levels.
Key Levels
Support 1 - 16700
Resistance 1 - 17150
Support 2 - 16585
Resistance 2 - 17200
1
Technical & Derivatives Report
November 10, 2015
Comments
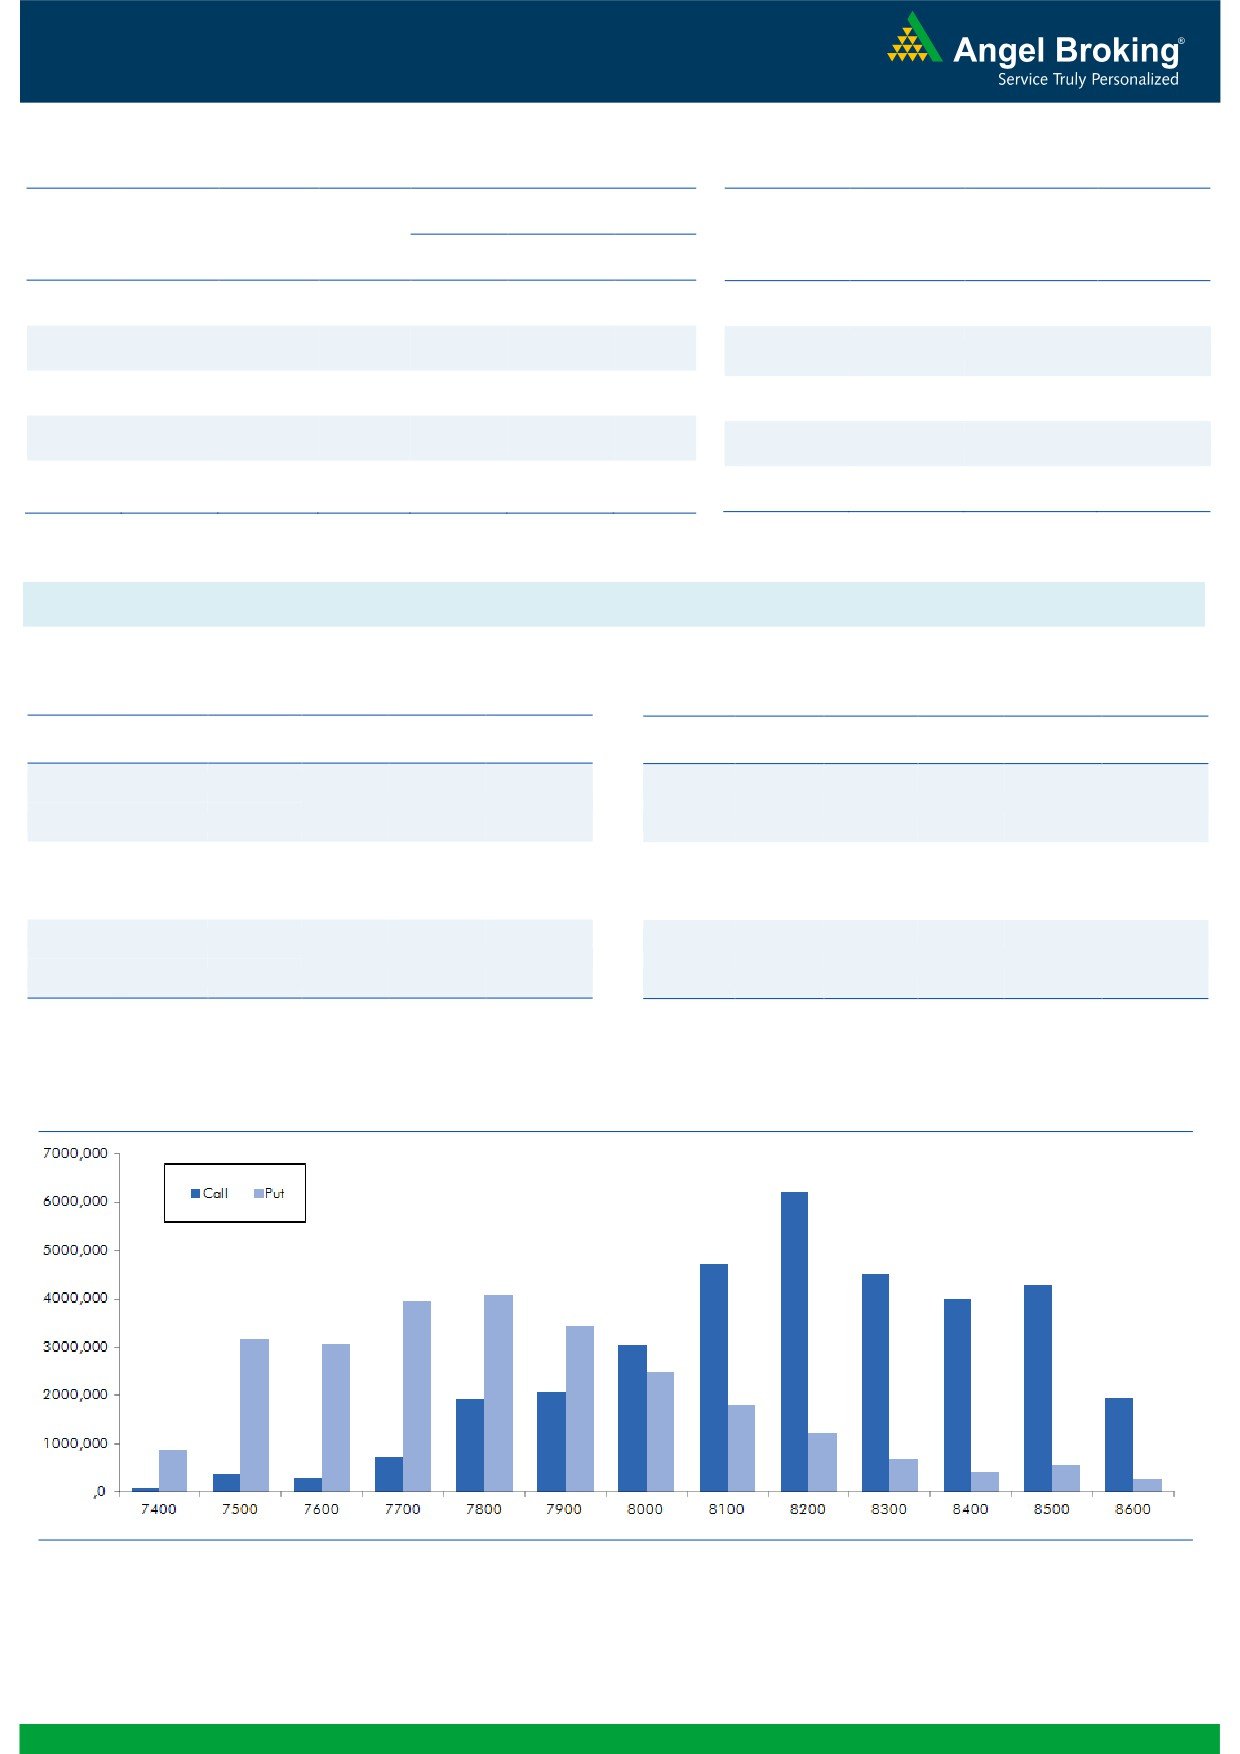
Nifty Vs OI
The Nifty futures open interest has decreased by 2.57%
BankNifty futures open interest has increased by 0.98%
as market closed at 7915.20 levels.
The Nifty November future closed at a premium of 20.85
points against a premium of
23.10 points. The
December series closed at a premium of 65.35 points.
The Implied Volatility of at the money options has
decreased from 19.42% to 14.87%.
The total OI of the market is Rs. 2,17,937/- cr. and the
stock futures OI is Rs. 60,738/- cr.
Few of the liquid counters where we have seen high cost
of carry are GMRINFRA, JPASSOCIAT, TV18BRDCST,
CEATLTD and SYNDIBANK.
OI Gainers
Views
OI
PRICE
SCRIP
OI
PRICE
CHG. (%)
CHG. (%)
FIIs were net sellers in both cash market segment and in
RPOWER
68784000
28.84
48.65
0.83
Index Futures. They sold equities to the tune of Rs. 861
BANKINDIA
16281000
13.85
133.80
-1.18
crores and Index Futures of Rs. 1485 crores with good
HDIL
16560000
13.21
64.90
-4.49
amount of rise in OI, which indicates fresh short
MARUTI
2661625
11.98
4648.30
2.74
formation by bigger hands in last trading session.
CADILAHC
2277000
11.78
418.65
1.28
In Index Options front, they sold of worth Rs. 2201 crores
with decent rise in OI. In call options 7800, 7900 and
OI Losers
8100 strikes added fresh OI, followed by unwinding in
OI
PRICE
8300 strikes. While in put options, we hardly saw any
SCRIP
OI
PRICE
CHG. (%)
CHG. (%)
strike adding reasonable build-up, good amount of
HINDUNILVR
3272400
-10.49
804.05
0.28
unwinding was visible in 8000 strike. Maximum build-up
IGL
1082400
-8.89
473.95
-1.10
is visible in 8200 call and 7800 put options. We believe
AMBUJACEM
7753200
-8.48
205.20
-2.33
market may still remain in pressure and one should
JSWENERGY
5322000
-7.99
87.15
1.34
avoid bottom fishing till we see any meaningful changes
ASIANPAINT
4540200
-6.46
817.35
1.44
in data.
Put-Call Ratio
Historical Volatility
SCRIP
PCR-OI
PCR-VOL
SCRIP
HV
NIFTY
0.77
0.70
NIFTY
14.94
BANKNIFTY
0.77
0.66
BANKNIFTY
22.66
LT
0.41
0.35
LT
31.78
SBIN
0.58
0.52
SBIN
34.49
AXISBANK
0.34
0.42
AXISBANK
42.27
Strategy Date
Symbol
Strategy
Status
November 02, 2015
RELIANCE
Short Strangle
Active
November 09, 2015
ITC
Short Strangle
Did not trigger.
2
Technical & Derivatives Report
November 10, 2015
FII Statistics for 09-November 2015
Turnover on 09-November 2015
Open Interest
No. of
Turnover
Change
Detail
Buy
Sell
Net
Instrument
Value
Change
Contracts
( in Cr. )
(%)
Contracts
(in Cr.)
(%)
INDEX
INDEX
2922.99
4408.38
(1485.39)
288963
16834.77
5.50
358686
20179.89
38.01
FUTURES
FUTURES
INDEX
INDEX
29038.82
31239.99
(2201.17)
1154958
67893.91
4.14
3716141
219755.70
56.02
OPTIONS
OPTIONS
STOCK
4126.97
4313.49
(186.52)
952046
46976.21
2.09
STOCK
FUTURES
567351
28471.35
-1.72
FUTURES
STOCK
STOCK
2719.95
2829.90
(109.95)
63030
3083.36
7.66
OPTIONS
315446
16393.13
-7.56
OPTIONS
TOTAL
38808.73
42791.76
(3983.03)
2458997
134788.24
3.58
TOTAL
4957625
284800.15
40.87
Nifty Spot = 7915.20
Lot Size = 25
Bull-Call Spreads
Bear-Put Spreads
Action
Strike
Price
Risk
Reward
BEP
Action
Strike
Price
Risk
Reward
BEP
Buy
8000
66.70
Buy
7900
82.80
32.90
67.10
8032.90
32.90
67.10
7867.10
Sell
8100
33.80
Sell
7800
49.90
Buy
8000
66.70
Buy
7900
82.80
50.80
149.20
8050.80
53.50
146.50
7846.50
Sell
8200
15.90
Sell
7700
29.30
Buy
8100
33.80
Buy
7800
49.90
17.90
82.10
8117.90
20.60
79.40
7779.40
Sell
8200
15.90
Sell
7700
29.30
Note: Above mentioned Bullish or Bearish Spreads in Nifty (Nov. Series) are given as an information and not as a recommendation.
Nifty Put-Call Analysis
3
Technical & Derivatives Report
November 10, 2015
Daily Pivot Levels for Nifty 50 Stocks
Scrips
S2
S1
PIVOT
R1
R2
ACC
1,331
1,350
1,362
1,380
1,392
ADANIPORTS
269
272
278
282
287
AMBUJACEM
201
203
205
207
210
ASIANPAINT
772
794
806
828
841
AXISBANK
438
452
459
473
480
BAJAJ-AUTO
2,360
2,384
2,407
2,432
2,455
BANKBARODA
158
165
169
175
179
BHARTIARTL
314
324
332
342
349
BHEL
179
182
186
189
193
BOSCHLTD
18,716
19,017
19,268
19,569
19,821
BPCL
865
884
897
916
930
CAIRN
139
142
146
149
153
CIPLA
634
641
645
652
656
COALINDIA
329
334
338
343
346
DRREDDY
3,378
3,440
3,507
3,569
3,636
GAIL
278
281
284
287
290
GRASIM
3,608
3,629
3,645
3,666
3,682
HCLTECH
864
873
879
888
894
HDFC
1,165
1,178
1,191
1,203
1,216
HDFCBANK
1,043
1,054
1,062
1,073
1,080
HEROMOTOCO
2,566
2,590
2,620
2,644
2,674
HINDALCO
77
78
80
81
82
HINDUNILVR
775
789
798
812
821
ICICIBANK
252
258
261
267
270
IDEA
129
132
134
137
139
INDUSINDBK
891
907
916
933
942
INFY
1,105
1,120
1,130
1,145
1,155
ITC
325
334
339
348
353
KOTAKBANK
624
642
653
671
682
LT
1,318
1,339
1,351
1,372
1,384
LUPIN
1,782
1,825
1,855
1,898
1,927
M&M
1,192
1,221
1,243
1,271
1,293
MARUTI
4,370
4,499
4,569
4,698
4,768
NTPC
131
132
133
135
136
ONGC
243
246
248
252
254
PNB
126
131
133
138
141
POWERGRID
125
128
129
132
133
RELIANCE
908
935
950
976
991
SBIN
231
238
243
251
256
SUNPHARMA
84
89
92
97
100
TATAMOTORS
731
744
758
771
785
TATAPOWER
359
385
399
426
440
TATASTEEL
64
66
68
70
71
TCS
208
215
220
227
232
TECHM
2,447
2,459
2,481
2,493
2,515
ULTRACEMCO
513
523
529
538
545
VEDL
2,700
2,728
2,752
2,780
2,804
WIPRO
550
555
561
566
572
YESBANK
722
742
755
775
788
ZEEL
382
387
390
394
398
4
Technical & Derivatives Report
November 10, 2015
Research Team Tel: 022 - 39357800
For Technical Queries
For Derivatives Queries
DISCLAIMER
Angel Broking Private Limited (hereinafter referred to as “Angel”) is a registered Member of National Stock Exchange of India Limited,
Bombay Stock Exchange Limited and MCX Stock Exchange Limited. It is also registered as a Depository Participant with CDSL and
Portfolio Manager with SEBI. It also has registration with AMFI as a Mutual Fund Distributor. Angel Broking Private Limited is a
registered entity with SEBI for Research Analyst in terms of SEBI (Research Analyst) Regulations, 2014 vide registration number
INH000000164. Angel or its associates has not been debarred/ suspended by SEBI or any other regulatory authority for accessing
/dealing in securities Market. Angel or its associates including its relatives/analyst do not hold any financial interest/beneficial
ownership of more than 1% in the company covered by Analyst. Angel or its associates/analyst has not received any compensation /
managed or co-managed public offering of securities of the company covered by Analyst during the past twelve months. Angel/analyst
has not served as an officer, director or employee of company covered by Analyst and has not been engaged in market making activity
of the company covered by Analyst.
This document is solely for the personal information of the recipient, and must not be singularly used as the basis of any investment
decision. Nothing in this document should be construed as investment or financial advice. Each recipient of this document should
make such investigations as they deem necessary to arrive at an independent evaluation of an investment in the securities of the
companies referred to in this document (including the merits and risks involved), and should consult their own advisors to determine
the merits and risks of such an investment.
Reports based on technical and derivative analysis center on studying charts of a stock's price movement, outstanding positions and
trading volume, as opposed to focusing on a company's fundamentals and, as such, may not match with a report on a company's
fundamentals.
The information in this document has been printed on the basis of publicly available information, internal data and other reliable
sources believed to be true, but we do not represent that it is accurate or complete and it should not be relied on as such, as this
document is for general guidance only. Angel Broking Pvt. Limited or any of its affiliates/ group companies shall not be in any way
responsible for any loss or damage that may arise to any person from any inadvertent error in the information contained in this report.
Angel Broking Pvt. Limited has not independently verified all the information contained within this document. Accordingly, we cannot
testify, nor make any representation or warranty, express or implied, to the accuracy, contents or data contained within this document.
While Angel Broking Pvt. Limited endeavors to update on a reasonable basis the information discussed in this material, there may be
regulatory, compliance, or other reasons that prevent us from doing so.
This document is being supplied to you solely for your information, and its contents, information or data may not be reproduced,
redistributed or passed on, directly or indirectly.
Neither Angel Broking Pvt. Limited, nor its directors, employees or affiliates shall be liable for any loss or damage that may arise from
or in connection with the use of this information.
Note: Please refer to the important ‘Stock Holding Disclosure' report on the Angel website (Research Section). Also, please refer to the
latest update on respective stocks for the disclosure status in respect of those stocks. Angel Broking Pvt. Limited and its affiliates may
have investment positions in the stocks recommended in this report.
5