Technical & Derivatives Report
March 10, 2016
Sensex (24794) / Nifty (7532)
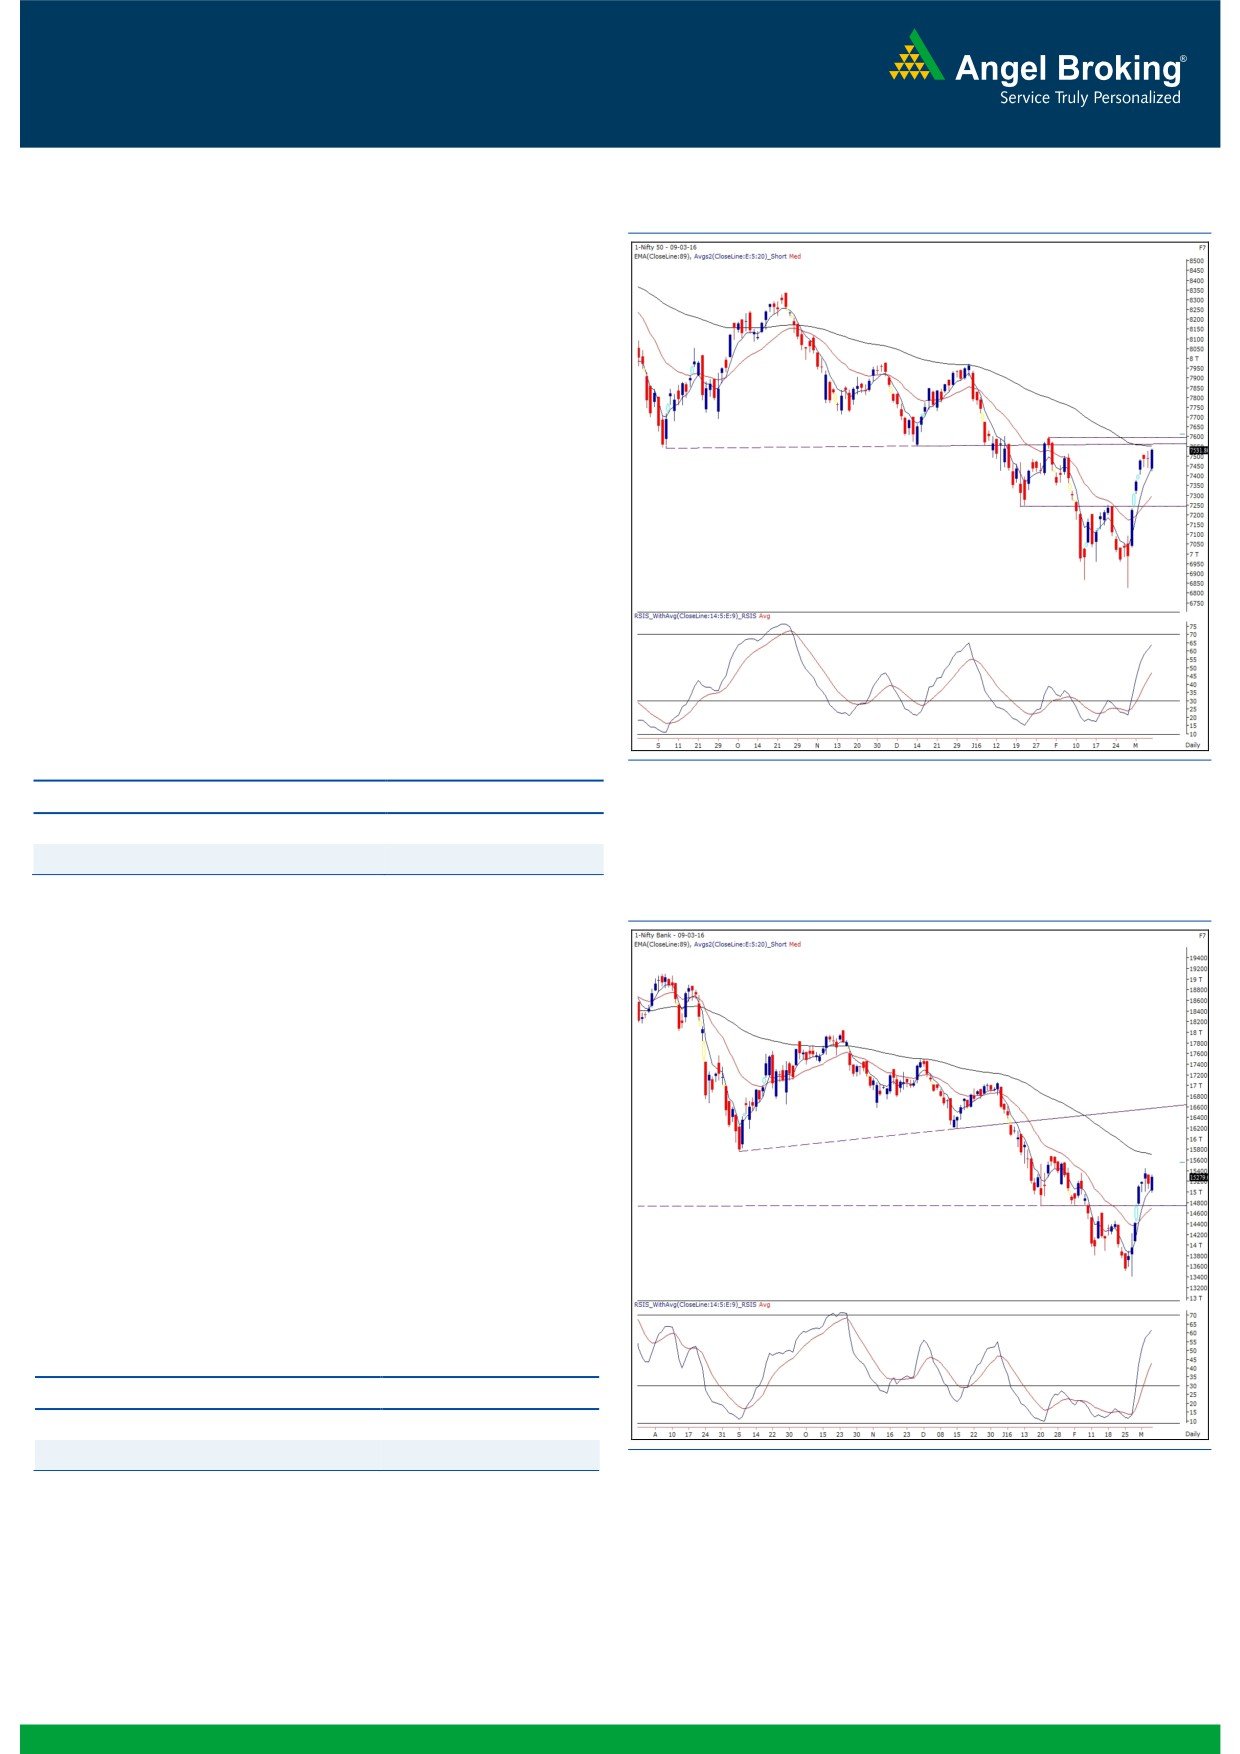
Exhibit 1: Nifty Daily Chart
Yesterday’s session opened with nearly half a percent
downside gap citing negative global cues. After a
consolidation of nearly three hours, the buying interest picked
up in our market post the midsession. This strong optimism
eventually led to a sharp rally in the second half to close
convincingly above the 7500 mark for the first time since
February 01, 2016.
Previous two days indecisiveness was followed by a slightly
weak price action below yesterday's low of 7442. However,
the index did not stay below this level for a quite long as the
mighty bears pulled the index significantly higher to even
break yesterday's high. We reiterate our view that the ongoing
momentum is very strong on the upside and thus, traders
should refrain from shorting till the definite signal emerges.
Om the upside, we expect this rally to extend towards 7600;
whereas, intraday support levels are seen at 7500 - 7420
levels.
Key Levels
Support 1 - 7500
Resistance 1 - 7600
Support 2 - 7420
Resistance 2 -
7650
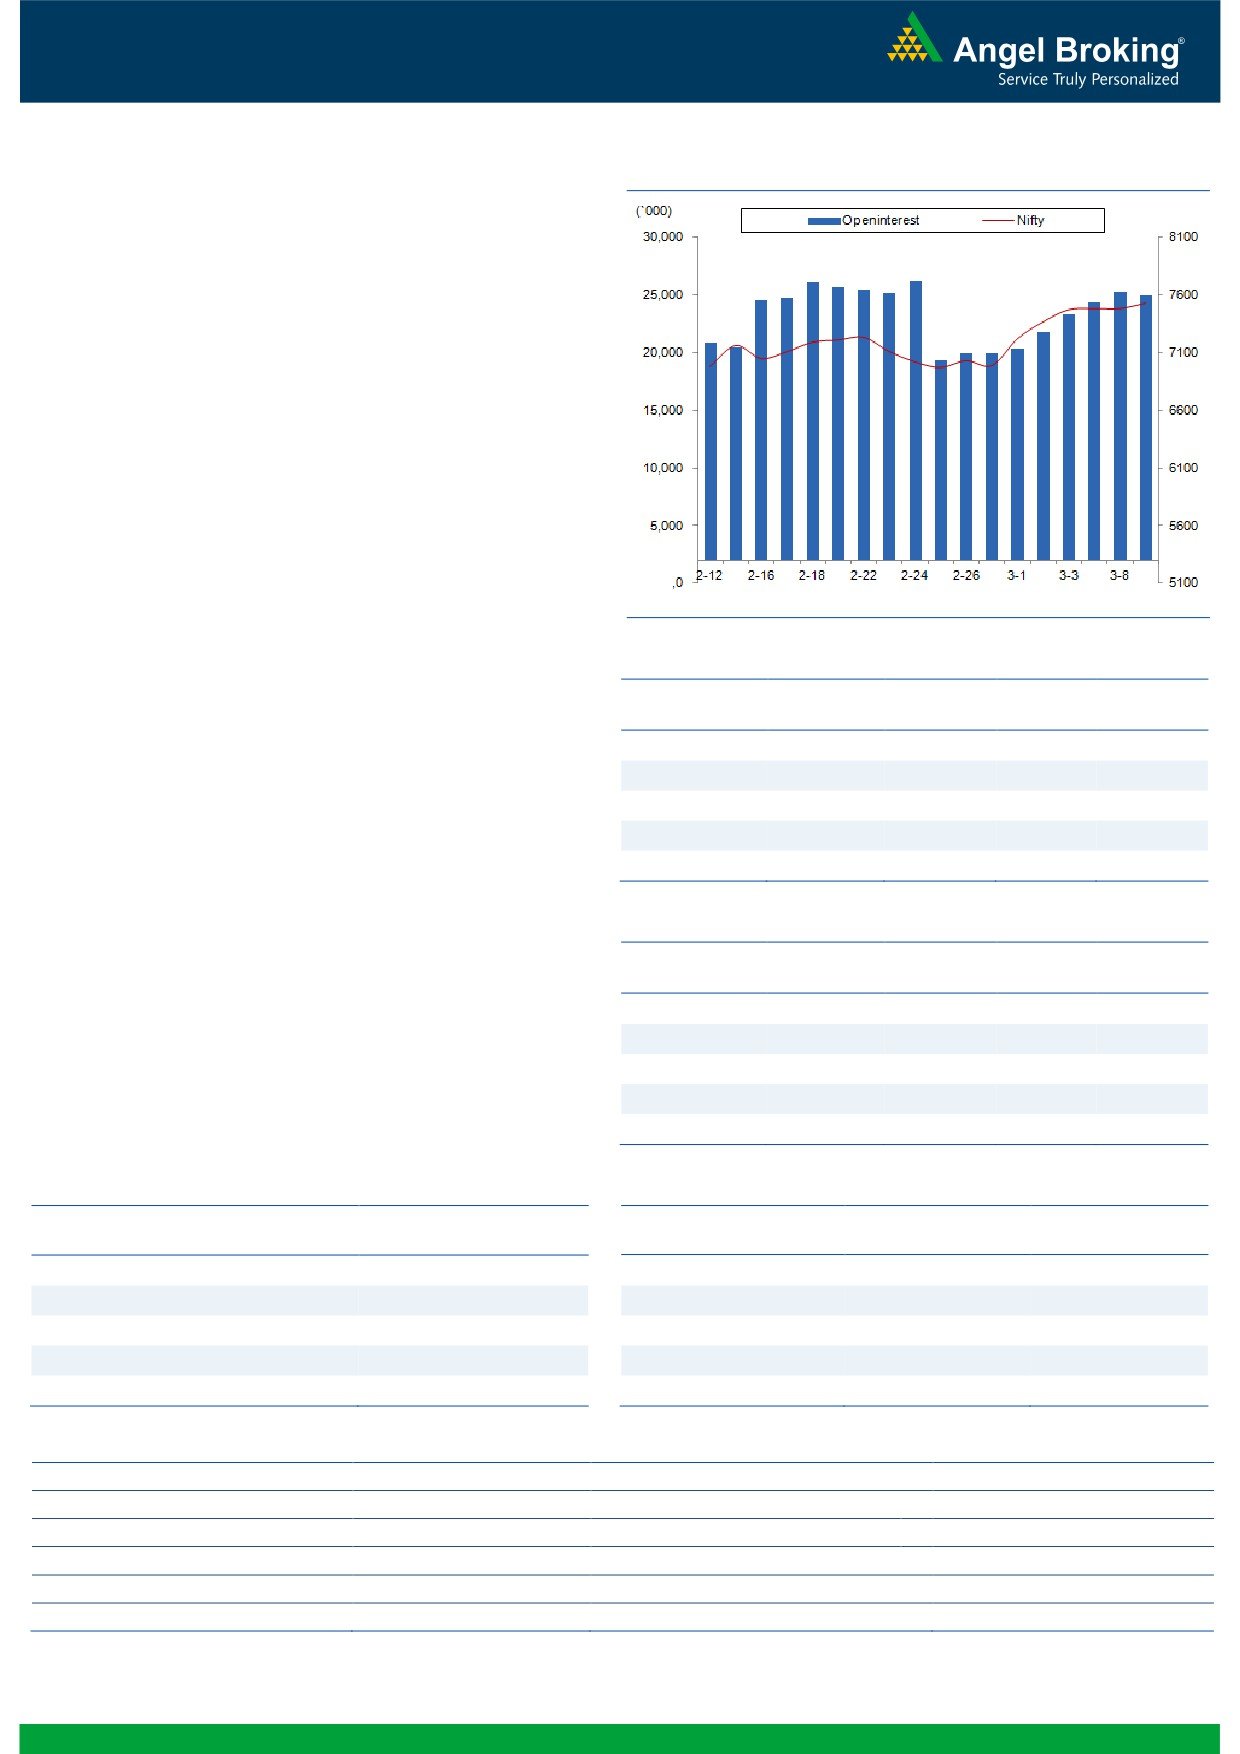
Exhibit 2: Nifty Bank Daily Chart
Nifty Bank Outlook - (15279)
Post trading on a negative note in initial hour, the Nifty Bank
index regained strength and ended yesterday's session with
gains of 0.95%.
The Nifty Bank index continued the range bound activity and it
has been last four trading sessions where the index has traded
in range of 15000 - 15452. As we had also mentioned
yesterday, the index has so far not shown any divergence or
reversal signs and hence, the short term trend continues to
remain positive. The near term support for the index is placed
at 15000 and 14765 whereas resistances are seen around
15452 and 15710. If the index manages to test the resistance
zone of 15650 - 15700 in near term, traders can look to book
profits on existing longs.
Key Levels
Support 1 - 15000
Resistance 1 - 15650
Support 2 - 14765
Resistance 2 - 15700
1
Technical & Derivatives Report
March 10, 2016
Comments
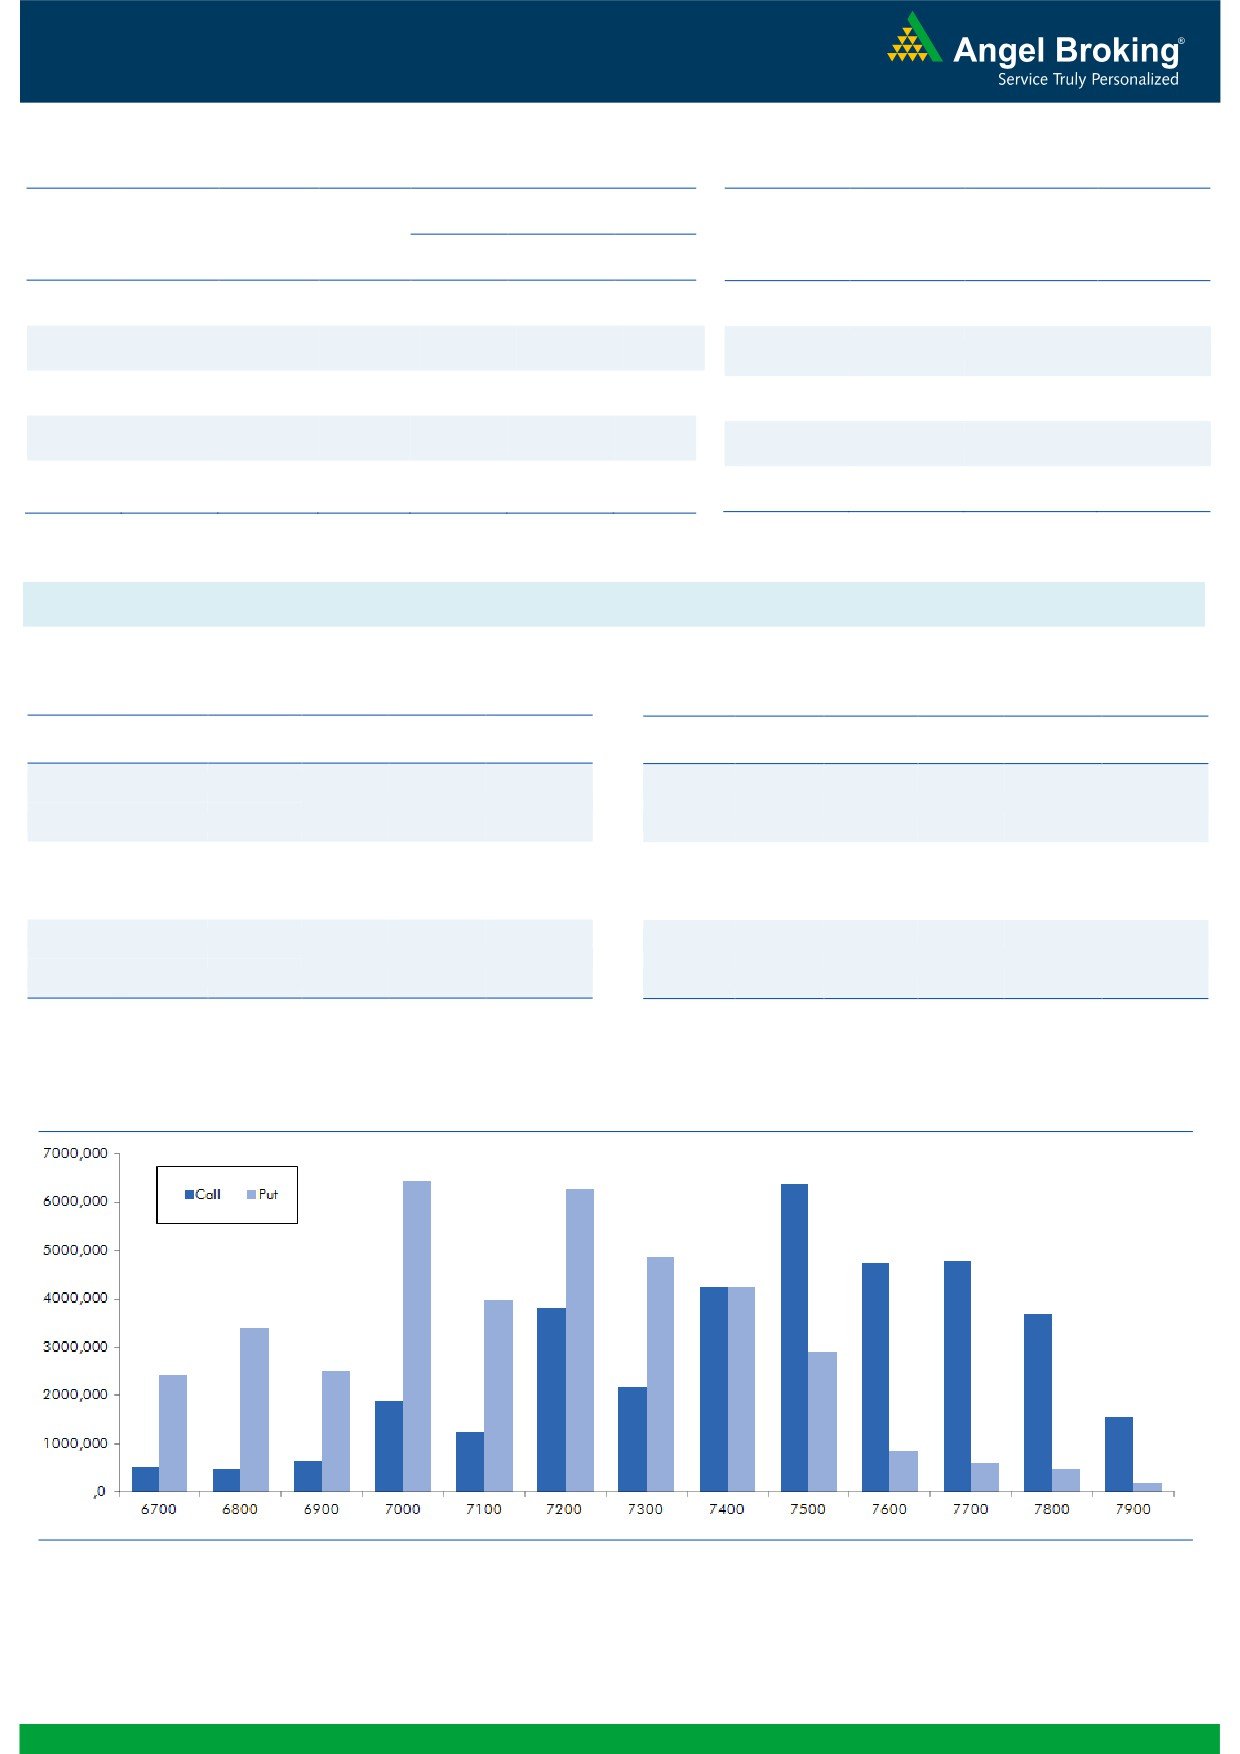
Nifty Vs OI
The Nifty futures open interest has decreased by 1.01%
BankNifty futures open interest has increased by 1.71%
as market closed at 7531.80 levels.
The Nifty March future closed at a premium of 3.25
points against a discount of 32.65 points. The April
series closed at a premium of 35.45 points.
The Implied Volatility of at the money options has
decreased from 16.12% to 15.33%.
The total OI of the market is Rs. 2,19,978/- cr. and the
stock futures OI is Rs. 56,330/- cr.
Few of the liquid counters where we have seen high cost
of carry are UNITECH, IDFC, GMRINFRA, MCDOWELL-
N and NCC.
OI Gainers
Views
OI
PRICE
FIIs continue buying in both cash and F&O segment.
SCRIP
OI
PRICE
CHG. (%)
CHG. (%)
They bought equities to the tune of Rs. 463 crores. While
CONCOR
906000
175.55
1188.15
-3.02
in Index Futures, they were net buyers of Rs. 154 crores
NCC
9976000
16.43
70.30
1.08
with good amount of rise in OI, suggesting blend of fresh
TATAELXSI
331200
15.36
1973.25
4.90
long and short formation in last trading session.
GRANULES
1620000
13.68
119.70
1.01
In Index Options front, FIIs bought of worth Rs. 741
KPIT
848000
13.37
142.05
-1.01
crores with some rise in OI. In call options, we hardly
saw any meaningful activity. Whereas, in put options,
OI Losers
7500 strike was active and it also added decent fresh
OI
PRICE
build-up. Maximum OI in current series is visible in 7500
SCRIP
OI
PRICE
CHG. (%)
CHG. (%)
call and 7000 put options. Seeing the quantum of buying
APOLLOTYRE
5736000
-12.61
170.50
-0.41
in equities & Index Futures from past few trading
MINDTREE
3254400
-12.29
686.60
-6.77
sessions, we believe Nifty may continue to show strength.
M&M
3777200
-9.69
1237.30
2.05
Trade with a positive bias.
ITC
32190400
-8.35
321.60
0.45
BAJAJ-AUTO
1295400
-7.34
2270.60
0.16
Historical Volatility
Put-Call Ratio
SCRIP
HV
SCRIP
PCR-OI
PCR-VOL
MINDTREE
67.30
NIFTY
1.00
0.91
GRASIM
27.68
BANKNIFTY
1.10
0.82
RELINFRA
71.59
SBIN
0.80
0.52
ASHOKLEY
55.77
ICICIBANK
0.87
0.70
CROMPGREAV
89.69
MARUTI
0.97
0.54
Strategy Date
Symbol
Strategy
Status
February 29, 2016
RELIANCE
Ratio Bull Call Spread
Active
March 05, 2016
BHEL
Long Call Ladder
Active
2
Technical & Derivatives Report
March 10, 2016
FII Statistics for 09-March 2016
Turnover on 09-March 2016
Open Interest
No. of
Turnover
Change
Detail
Buy
Sell
Net
Instrument
Value
Change
Contracts
( in Cr. )
(%)
Contracts
(in Cr.)
(%)
INDEX
INDEX
1493.39
1338.77
154.62
309405
16991.64
5.10
315480
16343.39
19.23
FUTURES
FUTURES
INDEX
INDEX
26373.99
25632.35
741.65
1302314
72591.86
2.58
3137813
171800.31
14.30
OPTIONS
OPTIONS
STOCK
3238.70
4492.19
(1253.49)
1050258
47580.45
(0.84)
STOCK
FUTURES
594940
27509.33
13.67
FUTURES
STOCK
STOCK
2186.79
2097.63
89.16
66676
3018.79
5.96
OPTIONS
286843
13634.05
11.69
OPTIONS
TOTAL
33292.87
33560.92
(268.05)
2728653
140182.75
1.59
TOTAL
4335076
229287.10
14.40
Nifty Spot = 7531.80
Lot Size = 75
Bull-Call Spreads
Bear-Put Spreads
Action
Strike
Price
Risk
Reward
BEP
Action
Strike
Price
Risk
Reward
BEP
Buy
7600
82.80
Buy
7500
98.50
36.20
63.80
7636.20
32.50
67.50
7467.50
Sell
7700
46.60
Sell
7400
66.00
Buy
7600
82.80
Buy
7500
98.50
58.95
141.05
7658.95
54.50
145.50
7445.50
Sell
7800
23.85
Sell
7300
44.00
Buy
7700
46.60
Buy
7400
66.00
22.75
77.25
7722.75
22.00
78.00
7378.00
Sell
7800
23.85
Sell
7300
44.00
Note: Above mentioned Bullish or Bearish Spreads in Nifty (March Series) are given as an information and not as a recommendation.
Nifty Put-Call Analysis
3
Technical & Derivatives Report
March 10, 2016
Daily Pivot Levels for Nifty 50 Stocks
Scrips
S2
S1
PIVOT
R1
R2
ACC
1,226
1,235
1,242
1,251
1,259
ADANIPORTS
215
221
227
232
238
AMBUJACEM
200
202
204
206
208
ASIANPAINT
859
868
878
887
897
AXISBANK
403
410
414
421
425
BAJAJ-AUTO
2,282
2,300
2,317
2,335
2,352
BANKBARODA
138
141
142
144
146
BHEL
325
330
333
338
340
BPCL
102
105
106
109
111
BHARTIARTL
16,911
17,422
17,711
18,221
18,510
BOSCHLTD
781
790
806
815
831
CAIRN
128
132
135
140
142
CIPLA
515
522
529
536
542
COALINDIA
319
321
324
325
328
DRREDDY
3,155
3,188
3,207
3,239
3,259
GAIL
342
346
351
355
360
GRASIM
3,469
3,551
3,601
3,683
3,733
HCLTECH
795
805
812
822
828
HDFCBANK
1,088
1,108
1,127
1,147
1,166
HDFC
997
1,011
1,020
1,034
1,044
HEROMOTOCO
2,772
2,794
2,812
2,834
2,852
HINDALCO
78
80
81
82
83
HINDUNILVR
819
830
837
847
854
ICICIBANK
207
212
215
219
223
IDEA
102
104
106
108
109
INDUSINDBK
903
919
928
944
953
INFY
1,128
1,153
1,168
1,194
1,209
ITC
310
315
318
323
326
KOTAKBANK
641
650
657
667
674
LT
1,162
1,187
1,204
1,229
1,246
LUPIN
1,800
1,812
1,828
1,840
1,857
M&M
1,201
1,219
1,228
1,245
1,255
MARUTI
3,380
3,478
3,539
3,637
3,698
NTPC
125
126
127
127
128
ONGC
199
202
204
207
209
POWERGRID
78
81
82
84
85
PNB
135
138
139
141
142
RELIANCE
1,009
1,026
1,035
1,051
1,060
SBIN
177
180
182
185
187
SUNPHARMA
83
85
87
89
91
TCS
827
844
854
871
881
TATAMOTORS
331
339
344
352
357
TATAPOWER
57
58
58
59
60
TATASTEEL
276
286
291
301
306
TECHM
2,266
2,312
2,341
2,386
2,415
ULTRACEMCO
433
448
458
474
483
VEDL
2,930
2,961
2,981
3,012
3,032
WIPRO
529
534
538
542
547
YESBANK
736
763
778
806
821
ZEEL
381
388
392
400
404
4
Technical & Derivatives Report
March 10, 2016
Research Team Tel: 022 - 39357800
For Technical Queries
For Derivatives Queries
DISCLAIMER
Angel Broking Private Limited (hereinafter referred to as “Angel”) is a registered Member of National Stock Exchange of India Limited,
Bombay Stock Exchange Limited and MCX Stock Exchange Limited. It is also registered as a Depository Participant with CDSL and
Portfolio Manager with SEBI. It also has registration with AMFI as a Mutual Fund Distributor. Angel Broking Private Limited is a
registered entity with SEBI for Research Analyst in terms of SEBI (Research Analyst) Regulations, 2014 vide registration number
INH000000164. Angel or its associates has not been debarred/ suspended by SEBI or any other regulatory authority for accessing
/dealing in securities Market. Angel or its associates including its relatives/analyst do not hold any financial interest/beneficial
ownership of more than 1% in the company covered by Analyst. Angel or its associates/analyst has not received any compensation /
managed or co-managed public offering of securities of the company covered by Analyst during the past twelve months. Angel/analyst
has not served as an officer, director or employee of company covered by Analyst and has not been engaged in market making activity
of the company covered by Analyst.
This document is solely for the personal information of the recipient, and must not be singularly used as the basis of any investment
decision. Nothing in this document should be construed as investment or financial advice. Each recipient of this document should
make such investigations as they deem necessary to arrive at an independent evaluation of an investment in the securities of the
companies referred to in this document (including the merits and risks involved), and should consult their own advisors to determine
the merits and risks of such an investment.
Reports based on technical and derivative analysis center on studying charts of a stock's price movement, outstanding positions and
trading volume, as opposed to focusing on a company's fundamentals and, as such, may not match with a report on a company's
fundamentals.
The information in this document has been printed on the basis of publicly available information, internal data and other reliable
sources believed to be true, but we do not represent that it is accurate or complete and it should not be relied on as such, as this
document is for general guidance only. Angel Broking Pvt. Limited or any of its affiliates/ group companies shall not be in any way
responsible for any loss or damage that may arise to any person from any inadvertent error in the information contained in this report.
Angel Broking Pvt. Limited has not independently verified all the information contained within this document. Accordingly, we cannot
testify, nor make any representation or warranty, express or implied, to the accuracy, contents or data contained within this document.
While Angel Broking Pvt. Limited endeavors to update on a reasonable basis the information discussed in this material, there may be
regulatory, compliance, or other reasons that prevent us from doing so.
This document is being supplied to you solely for your information, and its contents, information or data may not be reproduced,
redistributed or passed on, directly or indirectly.
Neither Angel Broking Pvt. Limited, nor its directors, employees or affiliates shall be liable for any loss or damage that may arise from
or in connection with the use of this information.
Note: Please refer to the important ‘Stock Holding Disclosure' report on the Angel website (Research Section). Also, please refer to the
latest update on respective stocks for the disclosure status in respect of those stocks. Angel Broking Pvt. Limited and its affiliates may
have investment positions in the stocks recommended in this report.
5