Technical & Derivatives Report
December 09, 2016
Sensex (26694) / Nifty (8247)
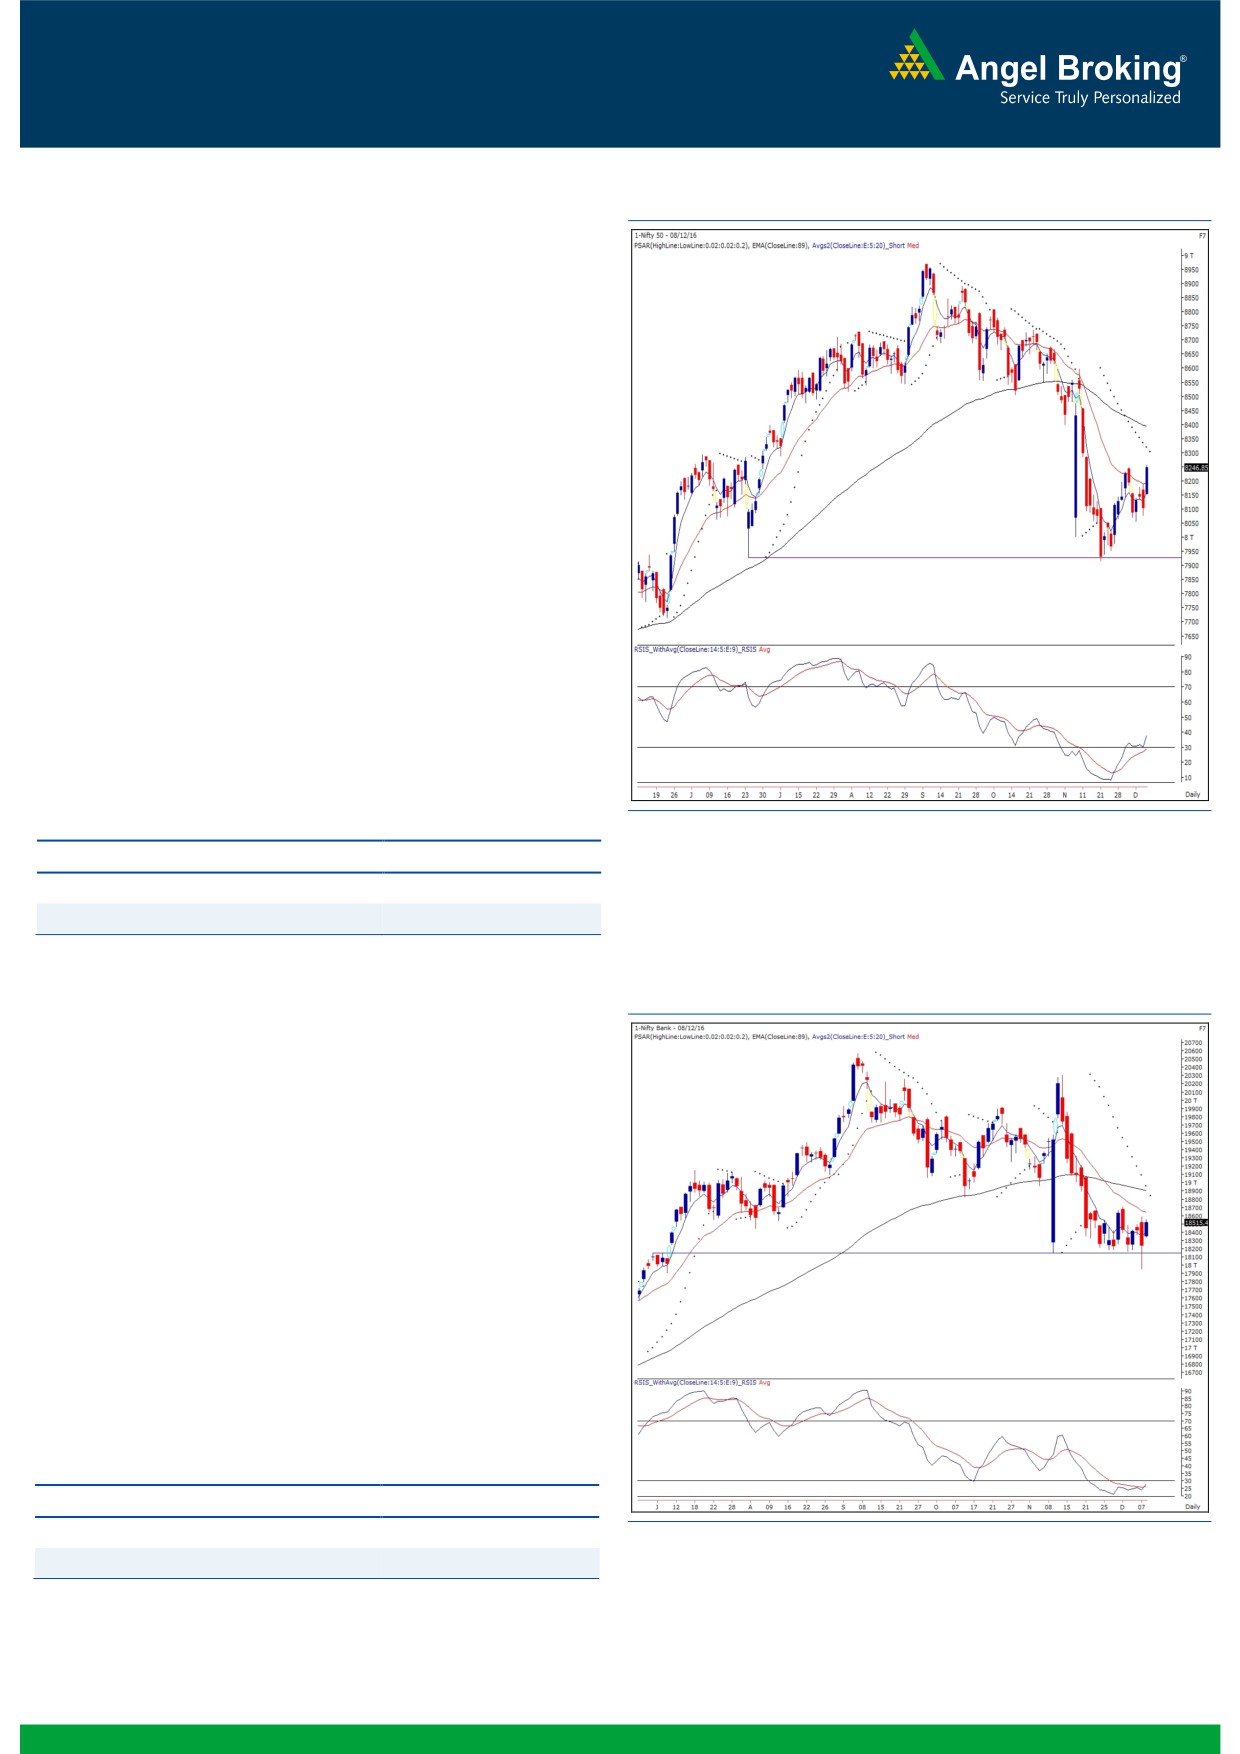
Exhibit 1: Nifty Daily Chart
What we saw yesterday was clearly one of the unique
characteristics of the financial market. The RBI shocked everyone
by maintaining a status-quo on Wednesday. Ideally, this should
have been a disappointing development for our markets. But, we
just witnessed an immediate kneejerk reaction for few minutes
and today surprisingly, a gap up opening with a decent margin.
In fact the momentum accelerated as the day progressed, which
led to a smart intraday rally to add 1.79% gains over its previous
close.
Now, going by the previous article, despite all the negative
development, we continued with our optimistic stance on the
market and the strategy played out well for us. The Nifty has
managed to surpass the recent swing high of 8250.80 on an
intraday basis and has eventually closed tad below it. But now, its
matter of time, the Nifty would overcome this hurdle convincingly
and we would see this rally getting extended towards our
mentioned levels 8320 - 8380. Traders holding long positions
should now trail their stop losses higher at 8055. For the coming
session, 8162 - 8125 would be seen as an immediate support
zone for the index.
Key Levels
Support 1 - 8162
Resistance 1 - 8320
Support 2 - 8125
Resistance 2 - 8380
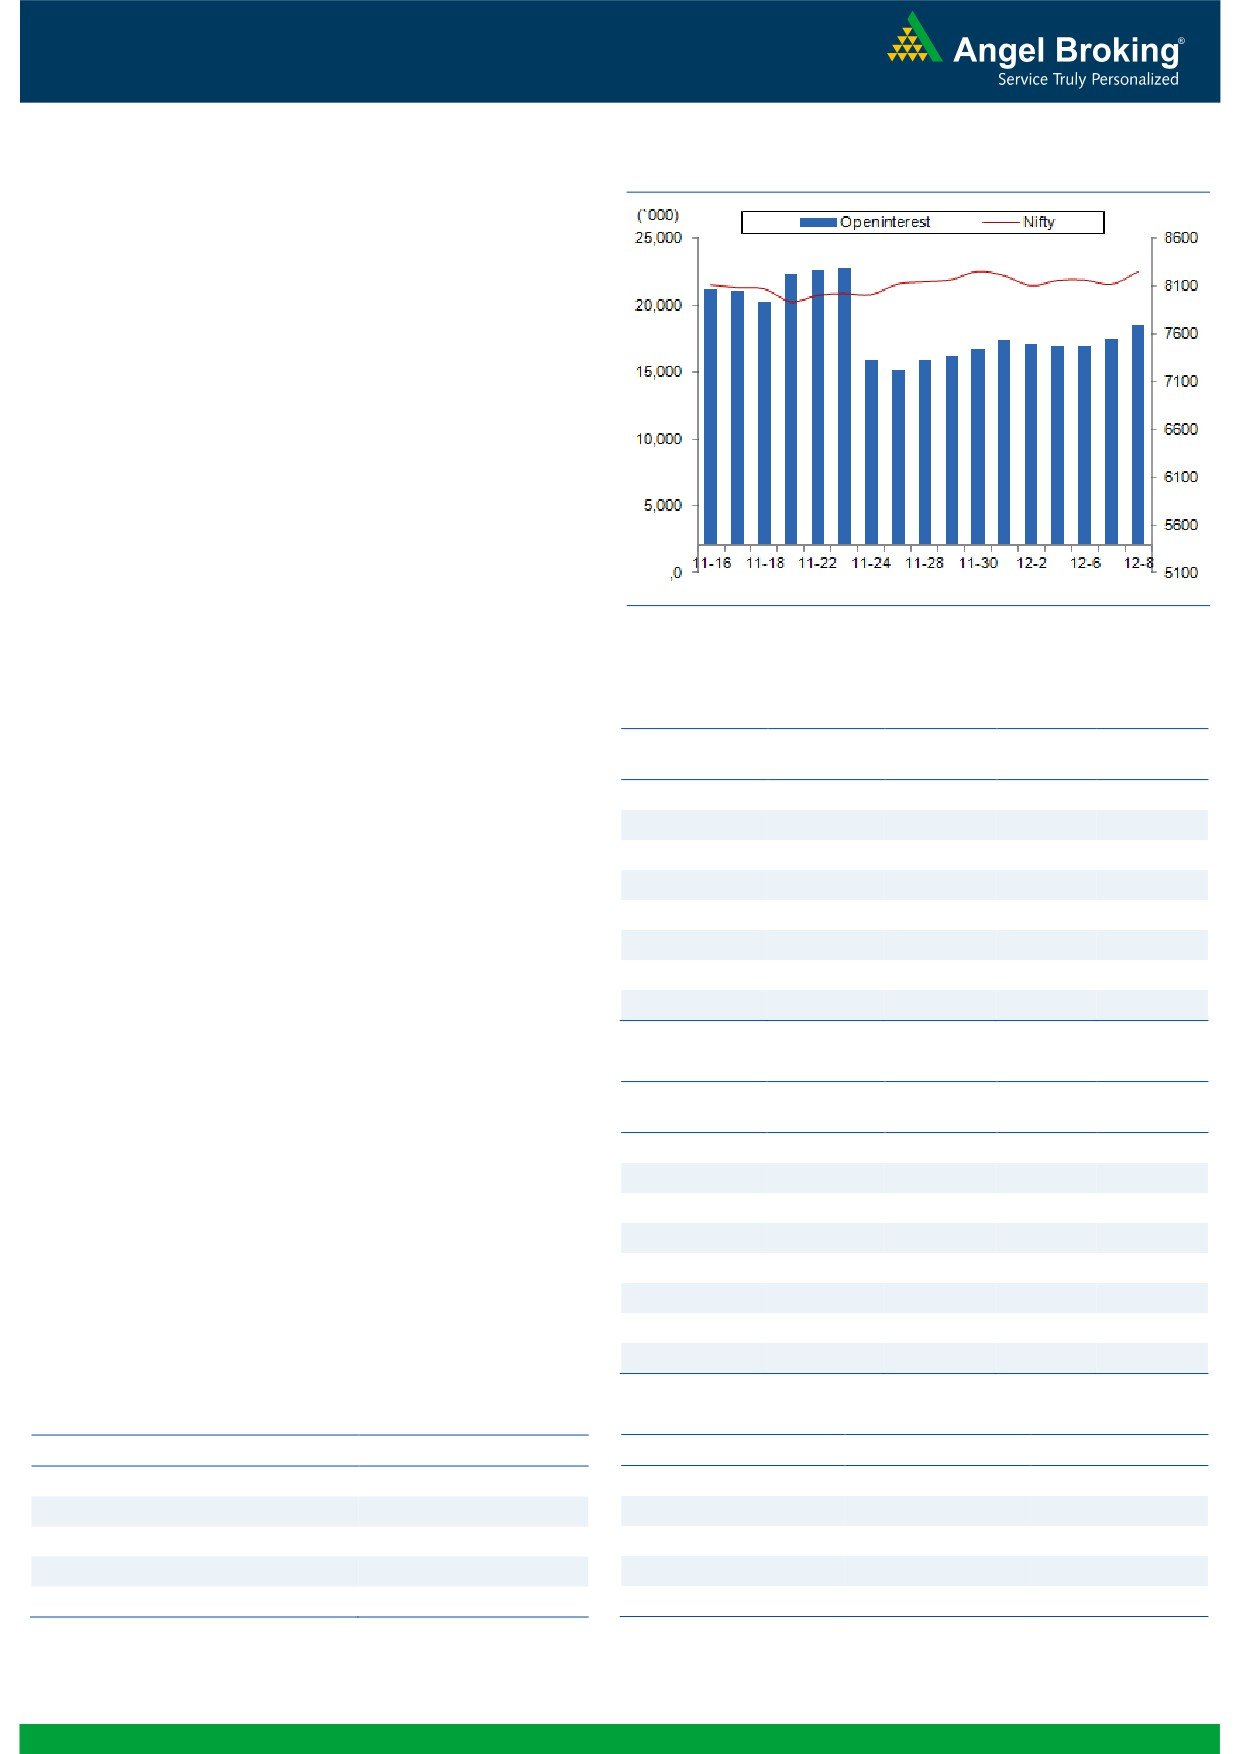
Nifty Bank Outlook - (18515)
Exhibit 2: Nifty Bank Daily Chart
Along with the Nifty index, the Nifty Bank index too opened
yesterday's session with a gap up opening of over 100 points and
traded with positive bias throughout the session. At close, the
index posted gains of 1.54 percent.
Post last hour of correction on Wednesday, the indices took many
market participants to a surprise with a gap up opening
yesterday. However, as we have been maintaining an optimistic
view since last few days, yesterday's upmove just added to our
conviction on the probability of a pullback rally. The 'RSI
Smoothened' oscillator has given a positive crossover in the
oversold territory, which should further support the pullback
move. Hence, we continue with our advice to avoid creating short
positions and trade with positive bias. The near term supports for
the Nifty Bank index are placed around 18235 and 18100
whereas resistances are seen around 18645 and 18955.
Key Levels
Support 1 - 18235
Resistance 1 - 18645
Support 2 - 18100
Resistance 2 - 18955
1
Technical & Derivatives Report
December 09, 2016
Comments
Nifty Vs OI
The Nifty futures open interest has increased by 6.57%
BankNifty futures open interest has decreased by 12.53%
as market closed at 8246.85 levels.
The Nifty December future closed with a premium of
8.80 against the premium of 21.03 points in last trading
session. The January series closed at a premium of
40.65 points.
The Implied Volatility of at the money options has
decreased from 14.78% to 13.08%. At the same time,
the PCR-OI of Nifty has increased from 1.05 to 1.09
levels.
The total OI of the market is Rs. 2,65,132/- cr. and the
stock futures OI is Rs. 68,828/- cr.
Few of the liquid counters where we have seen high cost
of carry are SOUTHBANK, IDBI, ADANIENT,
CROMPGREAV and CONCOR.
Views
OI Gainers
FIIs were net buyers in both cash market segment and
OI
PRICE
SCRIP
OI
PRICE
index futures. They bought equities to the tune of Rs. 699
CHG. (%)
CHG. (%)
crores. While, in index futures they were net buyers worth
CROMPGREAV
22884000
63.55
61.90
-5.54
Rs. 1441 crores with rise in open interest, indicating
OIL
1303900
21.75
440.85
1.34
continuation of long formation in previous trading
TATASTEEL
23870000
20.97
431.30
4.52
www.angelbroking.com
session.
COLPAL
576100
19.80
922.10
0.30
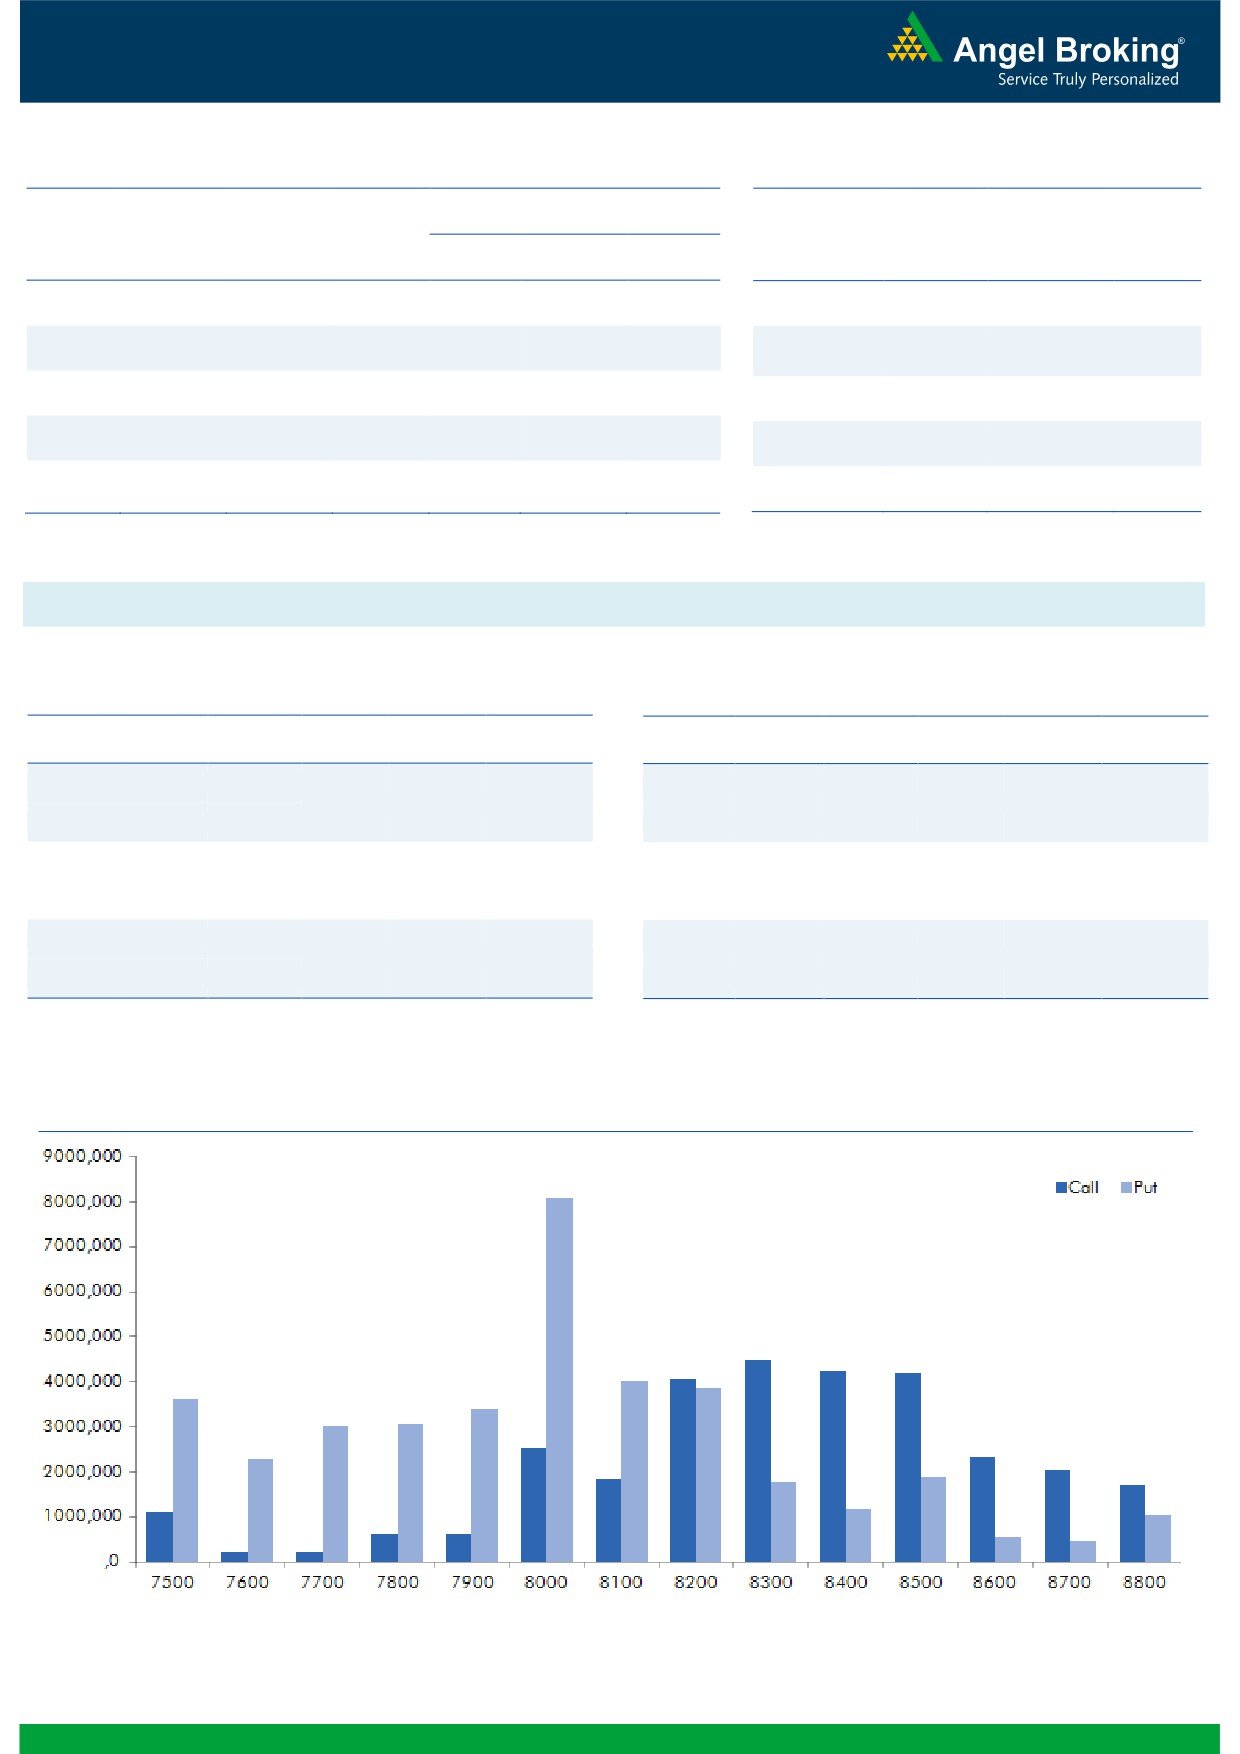
In Index options segment, FIIs were net buyers of Rs. 843
BHARATFORG
4041600
9.49
963.50
5.55
crores with rise in open interest. We hardly saw any
VEDL
53210500
9.01
242.95
4.17
meaningful activity in call option. While on the other
KTKBANK
19093875
8.83
104.50
-1.36
hand, 8100 and 8200 put options were quite active and
JINDALSTEL
55215000
8.74
73.10
2.30
they also added decent amount of open interest. Highest
OI in current series is visible in 8300 call and 8000 put
OI Losers
option.
OI
PRICE
SCRIP
OI
PRICE
In past few days, we witnessed decent OI addition in
CHG. (%)
CHG. (%)
Nifty and most of them are longs. Despite market trading
SUNTV
8782000
-5.49
481.20
2.19
in a range, FIIs have been continuously adding good
OFSS
190500
-5.44
3119.75
1.37
amount of long positions in Index futures. In addition, we
COALINDIA
11527700
-4.97
312.10
1.84
are also witnessing buying figures in equities since last
IRB
10842500
-4.60
191.75
3.14
three trading sessions. Considering above data, we
TATACHEM
4458000
-4.31
499.75
1.68
believe Nifty may continue to show strength and can test
RELCAPITAL
11460000
-3.69
436.85
2.88
8300-8350. Thus, we advise traders to trade with
BAJFINANCE
6390000
-3.67
911.55
2.44
positive bias.
AMBUJACEM
11925000
-3.64
213.90
1.83
Historical Volatility
Put-Call Ratio
SCRIP
HV
SCRIP
PCR-OI
PCR-VOL
BEML
50.13
NIFTY
1.09
1.07
BHARATFORG
44.62
BANKNIFTY
1.13
0.90
HAVELLS
53.37
SBIN
0.57
0.50
BAJAJ-AUTO
29.37
INFY
0.54
0.58
MOTHERSUMI
52.31
RELIANCE
0.54
0.47
2
Technical & Derivatives Report
December 09, 2016
FII Statistics for December 08, 2016
Turnover on December 08, 2016
Open Interest
No. of
Turnover
Change
Detail
Buy
Sell
Net
Instrument
Value
Change
Contracts
( in Cr. )
(%)
Contracts
(in Cr.)
(%)
INDEX
INDEX
2680.12
1239.61
1440.51
200963
12759.53
8.50
241865
16027.55
-11.08
FUTURES
FUTURES
INDEX
INDEX
38171.01
37327.80
843.21
1034952
65030.59
2.35
6093589
429105.62
52.21
OPTIONS
OPTIONS
STOCK
5769.77
5558.70
211.07
867364
53790.53
0.99
STOCK
FUTURES
439684
29926.14
3.62
FUTURES
STOCK
STOCK
2954.26
2970.74
(16.48)
71512
4657.94
4.56
OPTIONS
245693
17452.22
2.30
OPTIONS
TOTAL
49575.17
47096.85
2478.32
2174791
136238.60
2.41
TOTAL
7020831
492511.53
42.39
Nifty Spot = 8246.85
Lot Size = 75
Bull-Call Spreads
Bear-Put Spreads
Action
Strike
Price
Risk
Reward
BEP
Action
Strike
Price
Risk
Reward
BEP
Buy
8300
78.90
Buy
8200
84.30
38.10
61.90
8338.10
27.50
72.50
8172.50
Sell
8400
40.80
Sell
8100
56.80
Buy
8300
78.90
Buy
8200
84.30
60.10
139.90
8360.10
45.80
154.20
8154.20
Sell
8500
18.80
Sell
8000
38.50
Buy
8400
40.80
Buy
8100
56.80
22.00
78.00
8422.00
18.30
81.70
8081.70
Sell
8500
18.80
Sell
8000
38.50
Note: Above mentioned Bullish or Bearish Spreads in Nifty (December Series) are given as an information and not as a recommendation.
Nifty Put-Call Analysis
3
Technical & Derivatives Report
December 09, 2016
Daily Pivot Levels for Nifty Constituents
Scrips
S2
S1
PIVOT
R1
R2
ACC
1,340
1,349
1,360
1,370
1,381
ADANIPORTS
277
282
285
291
294
AMBUJACEM
207
211
214
217
220
ASIANPAINT
920
928
938
946
956
AUROPHARMA
709
715
721
727
734
AXISBANK
444
447
450
452
455
BAJAJ-AUTO
2,687
2,733
2,761
2,807
2,835
BANKBARODA
156
157
158
160
161
BHEL
127
128
129
130
131
BPCL
628
633
637
643
647
BHARTIARTL
326
329
332
335
337
INFRATEL
360
365
374
379
388
BOSCH
19,975
20,449
20,874
21,348
21,774
CIPLA
565
574
579
587
592
COALINDIA
303
307
311
315
318
DRREDDY
3,100
3,156
3,199
3,255
3,297
EICHERMOT
22,691
22,971
23,335
23,615
23,979
GAIL
424
427
432
435
440
GRASIM
871
883
891
902
911
HCLTECH
778
786
792
800
806
HDFCBANK
1,179
1,189
1,197
1,208
1,216
HDFC
1,261
1,275
1,285
1,300
1,310
HEROMOTOCO
3,218
3,272
3,299
3,353
3,381
HINDALCO
174
177
179
182
184
HINDUNILVR
831
837
842
848
853
ICICIBANK
256
260
261
265
266
IDEA
75
76
77
77
78
INDUSINDBK
1,070
1,084
1,095
1,110
1,121
INFY
964
974
980
990
996
ITC
225
229
232
236
239
KOTAKBANK
730
739
745
755
761
LT
1,354
1,361
1,368
1,375
1,382
LUPIN
1,496
1,510
1,519
1,533
1,542
M&M
1,175
1,189
1,202
1,217
1,229
MARUTI
5,125
5,180
5,225
5,280
5,325
NTPC
159
161
163
165
167
ONGC
296
300
302
306
308
POWERGRID
180
183
184
187
189
RELIANCE
998
1,009
1,015
1,026
1,033
SBIN
257
258
259
261
262
SUNPHARMA
650
663
671
684
692
TCS
2,146
2,171
2,185
2,210
2,224
TATAMTRDVR
290
297
301
309
313
TATAMOTORS
446
453
459
467
472
TATAPOWER
74
75
75
76
76
TATASTEEL
412
422
427
438
443
TECHM
454
459
462
467
471
ULTRACEMCO
3,545
3,569
3,600
3,624
3,655
WIPRO
452
456
457
461
463
YESBANK
1,184
1,200
1,209
1,225
1,235
ZEEL
439
446
450
457
462
4
Technical & Derivatives Report
December 09, 2016
Research Team Tel: 022 - 39357800
For Technical Queries
For Derivatives Queries
DISCLAIMER
Angel Broking Private Limited (hereinafter referred to as “Angel”) is a registered Member of National Stock Exchange of India Limited,
Bombay Stock Exchange Limited and Metropolitan Stock Exchange Limited. It is also registered as a Depository Participant with CDSL
and Portfolio Manager with SEBI. It also has registration with AMFI as a Mutual Fund Distributor. Angel Broking Private Limited is a
registered entity with SEBI for Research Analyst in terms of SEBI (Research Analyst) Regulations, 2014 vide registration number
INH000000164. Angel or its associates has not been debarred/ suspended by SEBI or any other regulatory authority for accessing
/dealing in securities Market. Angel or its associates/analyst has not received any compensation / managed or co-managed public
offering of securities of the company covered by Analyst during the past twelve months.
This document is solely for the personal information of the recipient, and must not be singularly used as the basis of any investment
decision. Nothing in this document should be construed as investment or financial advice. Each recipient of this document should
make such investigations as they deem necessary to arrive at an independent evaluation of an investment in the securities of the
companies referred to in this document (including the merits and risks involved), and should consult their own advisors to determine
the merits and risks of such an investment.
Reports based on technical and derivative analysis center on studying charts of a stock's price movement, outstanding positions and
trading volume, as opposed to focusing on a company's fundamentals and, as such, may not match with a report on a company's
fundamentals. Investors are advised to refer the Fundamental and Technical Research Reports available on our website to evaluate the
contrary view, if any.
The information in this document has been printed on the basis of publicly available information, internal data and other reliable
sources believed to be true, but we do not represent that it is accurate or complete and it should not be relied on as such, as this
document is for general guidance only. Angel Broking Pvt. Limited or any of its affiliates/ group companies shall not be in any way
responsible for any loss or damage that may arise to any person from any inadvertent error in the information contained in this report.
Angel Broking Pvt. Limited has not independently verified all the information contained within this document. Accordingly, we cannot
testify, nor make any representation or warranty, express or implied, to the accuracy, contents or data contained within this document.
While Angel Broking Pvt. Limited endeavors to update on a reasonable basis the information discussed in this material, there may be
regulatory, compliance, or other reasons that prevent us from doing so.
This document is being supplied to you solely for your information, and its contents, information or data may not be reproduced,
redistributed or passed on, directly or indirectly.
Neither Angel Broking Pvt. Limited, nor its directors, employees or affiliates shall be liable for any loss or damage that may arise from
or in connection with the use of this information.
5