Technical & Derivatives Report
December 09, 2015
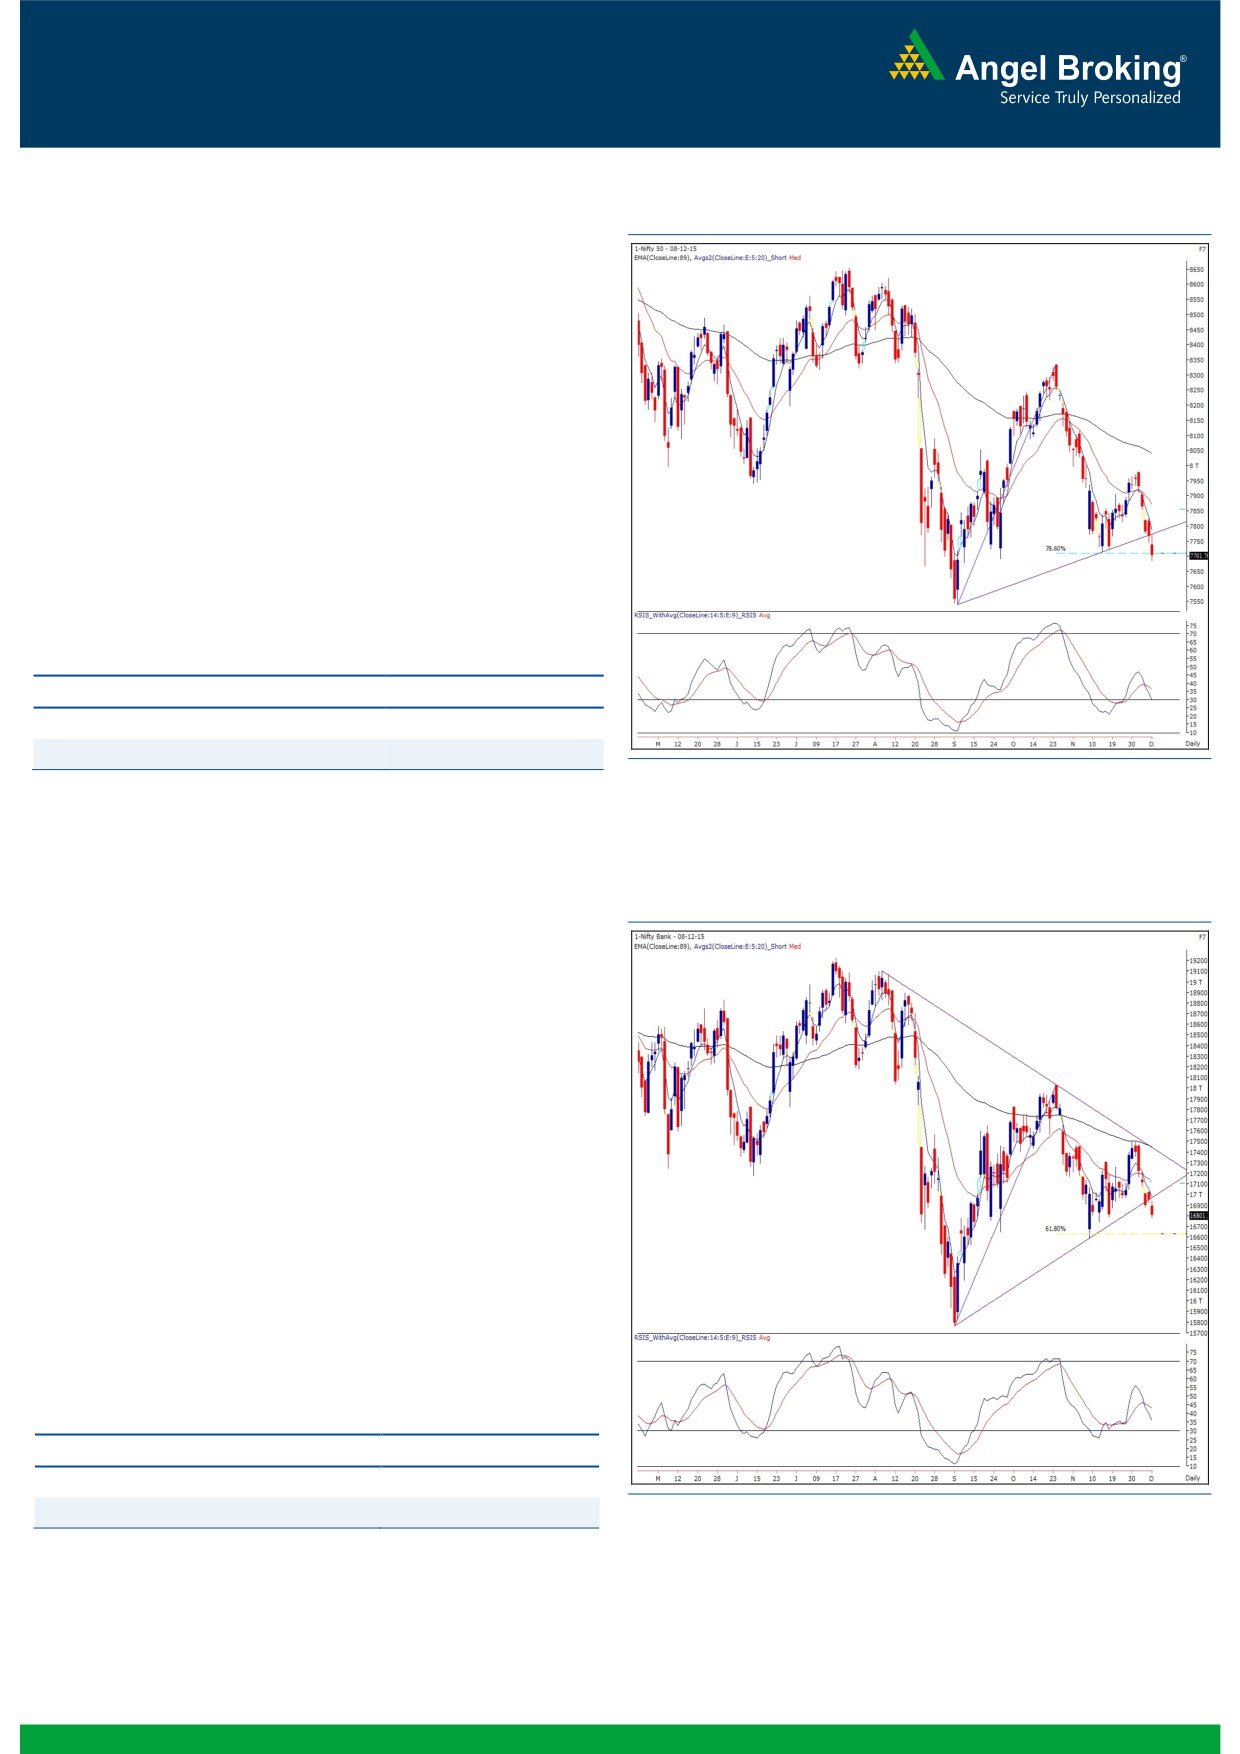
Sensex (25310) / Nifty (7702)
Exhibit 1: Nifty Daily Chart
Yesterday’s session opened lower in line with weak global
cues. Subsequently, the index consolidated for the major part
of the session. However, a sharp cut towards the fag end led
to a close at the 7700 mark.
Going forward, if the index manages to sustain below
yesterday's low then we may witness a continuation of this slide
towards 7660 - 7620 levels. On the flipside, if the Nifty
manages to maintain its position above the 7700 mark then
an immediate bounce towards 7750 - 7780 levels cannot be
rules out. Traders are advised to stay light on positions as the
market is lacking a clear direction.
Key Levels
Support 1 - 7660
Resistance 1 - 7750
Support 2 - 7620
Resistance 2 - 7780
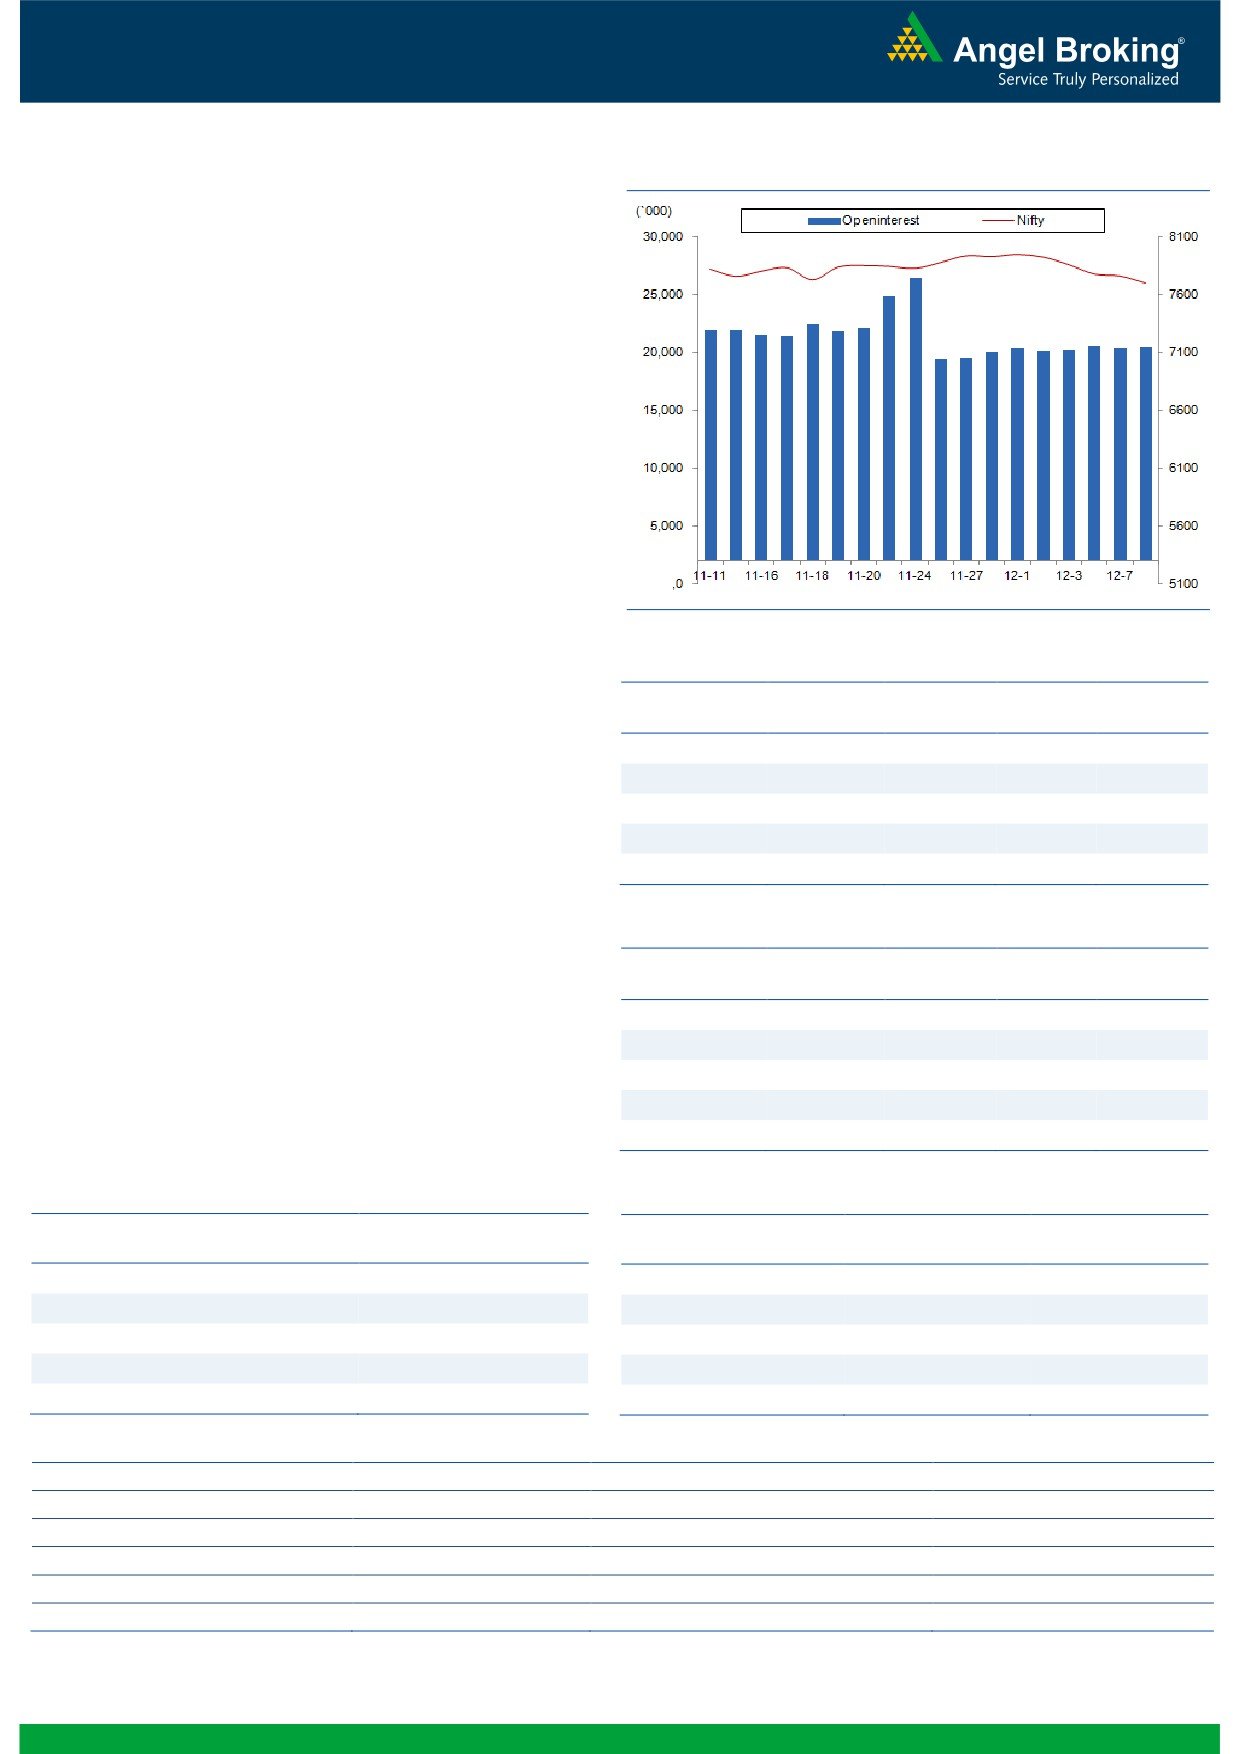
Exhibit 2: Bank Nifty Daily Chart
Bank Nifty Outlook - (16801)
The Nifty Bank index opened on a negative note on back of
negative global cues and formed lower top lower bottom
throughout the session. Eventually, the index has closed with
the loss of 0.86 percent over its previous close. From last few
sessions, we are witnessing selling pressure in the index and
the same could continue unless any reversal signs seen on
charts. As also mentioned in our yesterday's report, a failure to
sustain at higher levels could lead to the index correcting up to
its next support levels of 16587-16670. The index is fast
approaching the support zone. However, unless any sign of
strength or reversal is seen, it is advisable to stay with the
trend. The intraday support for the Nifty Bank index is placed
around 16670 and 16587 whereas resistances are placed
around 16943 and 17035.
Key Levels
Support 1 - 16670
Resistance 1 - 16943
Support 2 - 16587
Resistance 2 - 17035
1
Technical & Derivatives Report
December 09, 2015
Comments
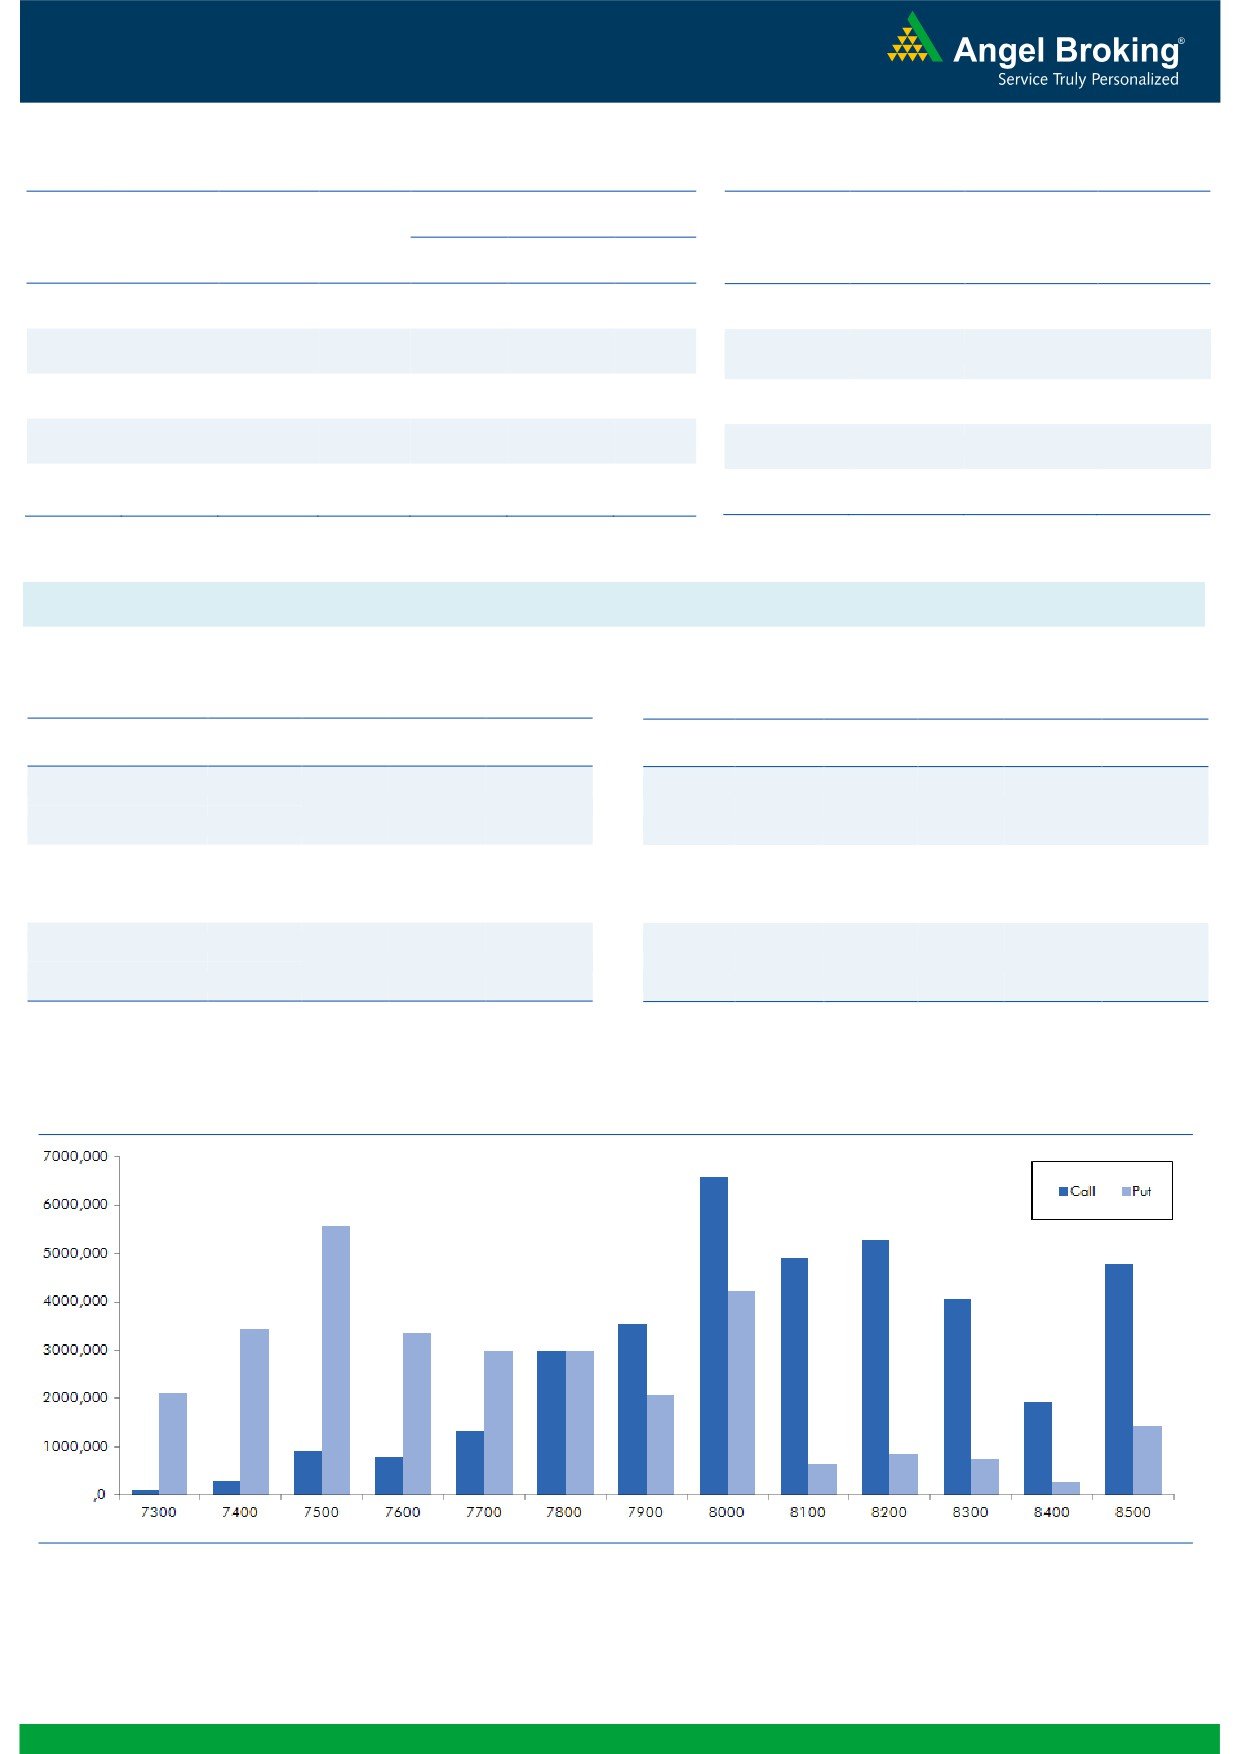
Nifty Vs OI
The Nifty futures open interest has increased by 0.13%
BankNifty futures open interest has increased by 0.85%
as market closed at 7701.70 levels.
The Nifty December future closed at a premium of 26.90
points against a premium of 43.40 points. The January
series closed at a premium of 64.65 points.
The Implied Volatility of at the money options has
decreased from 14.86% to 14.73%.
The total OI of the market is Rs. 2,13,580/- cr. and the
stock futures OI is Rs. 63,221/- cr.
Few of the liquid counters where we have seen high cost
of carry are UNITECH, INDIACEM, RELCAPITAL,
TV18BRDCST and IDBI.
Views
OI Gainers
FIIs were net sellers in both Equity Cash and Index Future
OI
PRICE
SCRIP
OI
PRICE
segment. In Equity Cash, they were net seller to the tune
CHG. (%)
CHG. (%)
of Rs. 518 crores. While, they sold Index Futures worth
MCLEODRUSS
2600400
23.13
178.85
0.79
Rs. 192 crores with some fall in open interest, indicating
PFC
16546000
17.51
197.25
-5.30
blend of long and short unwinding in last trading
BHARATFORG
4888000
13.28
825.60
-1.26
session.
DRREDDY
1967550
11.10
3078.80
-3.74
In Index Options front, FIIs bought of
worth Rs. 178
ONGC
20590000
9.80
216.15
-3.95
crores with rise in OI. In Call options, we saw some
build-up in 7800 strike; whereas, 8100 to 8300 strikes
OI Losers
has seen decent unwinding. While, in Put options, we
OI
PRICE
hardly saw any strikes adding meaningful OI. Maximum
SCRIP
OI
PRICE
CHG. (%)
CHG. (%)
buildup is seen in 8000 call and 7500 put options. We
GAIL
9290400
-6.24
340.30
-5.06
believe that the Nifty is trading around the lower side of
GMRINFRA
225498000
-6.03
15.40
-5.81
the range and any positive trigger may pull the index
L&TFH
23336000
-5.63
67.65
-1.24
back to 8000 mark. Traders are advised to take positions
CADILAHC
4932000
-5.54
395.55
-0.16
accordingly.
SUNPHARMA
18064800
-5.40
772.80
-0.90
Historical Volatility
Put-Call Ratio
SCRIP
HV
SCRIP
PCR-OI
PCR-VOL
ADANIPOWER
66.65
NIFTY
0.78
0.59
IBREALEST
56.96
BANKNIFTY
1.05
0.60
JPASSOCIAT
69.25
SBIN
0.47
0.28
CAIRN
47.98
LT
0.56
0.55
JSWENERGY
51.00
RELIANCE
0.48
0.72
Strategy Date
Symbol
Strategy
Status
November 30, 2015
LT
Long Put
Active
December 07, 2015
BANKNIFTY
Raito Bear Put Spread
Active
2
Technical & Derivatives Report
December 09, 2015
FII Statistics for 08-December 2015
Turnover on 08-December 2015
Open Interest
No. of
Turnover
Change
Detail
Buy
Sell
Net
Instrument
Value
Change
Contracts
( in Cr. )
(%)
Contracts
(in Cr.)
(%)
INDEX
INDEX
1035.32
1226.99
(191.67)
255580
14458.58
(1.61)
196969
10871.72
27.45
FUTURES
FUTURES
INDEX
INDEX
12780.20
12602.58
177.62
1159769
66436.38
2.02
2095665
122817.07
41.83
OPTIONS
OPTIONS
STOCK
STOCK
2543.68
2736.25
(192.57)
995032
48698.85
0.76
FUTURES
393377
19797.20
9.93
FUTURES
STOCK
1472.86
1530.33
(57.47)
53725
2607.03
7.72
STOCK
OPTIONS
204385
10632.11
5.42
OPTIONS
TOTAL
17832.06
18096.15
(264.09)
2464106
132200.84
1.24
TOTAL
2890396
164118.10
33.19
Nifty Spot = 7701.70
Lot Size = 25
Bull-Call Spreads
Bear-Put Spreads
Action
Strike
Price
Risk
Reward
BEP
Action
Strike
Price
Risk
Reward
BEP
Buy
7800
78.15
Buy
7600
66.20
33.35
66.65
7833.35
23.55
76.45
7576.45
Sell
7900
44.80
Sell
7500
42.65
Buy
7800
78.15
Buy
7600
66.20
54.00
146.00
7854.00
39.20
160.80
7560.80
Sell
8000
24.15
Sell
7400
27.00
Buy
7900
44.80
Buy
7500
42.65
20.65
79.35
7920.65
15.65
84.35
7484.35
Sell
8000
24.15
Sell
7400
27.00
Note: Above mentioned Bullish or Bearish Spreads in Nifty (Dec. Series) are given as an information and not as a recommendation.
Nifty Put-Call Analysis
3
Technical & Derivatives Report
December 09, 2015
Daily Pivot Levels for Nifty 50 Stocks
Scrips
S2
S1
PIVOT
R1
R2
ACC
1,323
1,331
1,341
1,349
1,359
ADANIPORTS
247
249
252
254
257
AMBUJACEM
192
194
194
195
196
ASIANPAINT
845
853
865
873
885
AXISBANK
454
457
460
462
465
BAJAJ-AUTO
2,405
2,434
2,459
2,488
2,513
BANKBARODA
157
159
163
166
170
BHARTIARTL
312
315
318
321
323
BHEL
161
163
166
167
170
BOSCHLTD
18,291
18,400
18,515
18,624
18,739
BPCL
899
905
916
922
932
CAIRN
123
125
130
132
136
CIPLA
633
638
643
648
653
COALINDIA
310
314
321
324
331
DRREDDY
2,976
3,020
3,086
3,130
3,196
GAIL
325
332
345
352
365
GRASIM
3,708
3,723
3,747
3,762
3,785
HCLTECH
830
844
856
870
882
HDFC
1,164
1,168
1,173
1,177
1,183
HDFCBANK
1,038
1,044
1,053
1,058
1,068
HEROMOTOCO
2,555
2,578
2,609
2,633
2,664
HINDALCO
74
75
77
78
80
HINDUNILVR
812
819
829
836
847
ICICIBANK
258
260
261
263
264
IDEA
132
134
136
138
140
INDUSINDBK
932
938
948
954
964
INFY
1,025
1,035
1,049
1,058
1,072
ITC
307
311
315
318
322
KOTAKBANK
662
668
673
679
684
LT
1,299
1,311
1,325
1,337
1,351
LUPIN
1,783
1,794
1,811
1,822
1,839
M&M
1,286
1,300
1,316
1,331
1,347
MARUTI
4,488
4,515
4,547
4,575
4,607
NTPC
128
129
130
131
132
ONGC
209
212
217
221
226
PNB
129
130
133
134
137
POWERGRID
128
129
130
131
132
RELIANCE
926
933
944
951
961
SBIN
232
234
237
239
242
VEDL
84
85
88
90
92
SUNPHARMA
760
766
773
778
785
TATAMOTORS
391
397
402
408
413
TATAPOWER
62
63
64
64
65
TATASTEEL
228
231
237
241
247
TCS
2,300
2,315
2,332
2,346
2,363
TECHM
518
524
535
542
553
ULTRACEMCO
2,806
2,833
2,858
2,885
2,909
WIPRO
555
561
570
576
585
YESBANK
717
721
728
733
740
ZEEL
392
397
401
405
410
4
Technical & Derivatives Report
December 09, 2015
Research Team Tel: 022 - 39357800
For Technical Queries
For Derivatives Queries
DISCLAIMER
Angel Broking Private Limited (hereinafter referred to as “Angel”) is a registered Member of National Stock Exchange of India Limited,
Bombay Stock Exchange Limited and MCX Stock Exchange Limited. It is also registered as a Depository Participant with CDSL and
Portfolio Manager with SEBI. It also has registration with AMFI as a Mutual Fund Distributor. Angel Broking Private Limited is a
registered entity with SEBI for Research Analyst in terms of SEBI (Research Analyst) Regulations, 2014 vide registration number
INH000000164. Angel or its associates has not been debarred/ suspended by SEBI or any other regulatory authority for accessing
/dealing in securities Market. Angel or its associates including its relatives/analyst do not hold any financial interest/beneficial
ownership of more than 1% in the company covered by Analyst. Angel or its associates/analyst has not received any compensation /
managed or co-managed public offering of securities of the company covered by Analyst during the past twelve months. Angel/analyst
has not served as an officer, director or employee of company covered by Analyst and has not been engaged in market making activity
of the company covered by Analyst.
This document is solely for the personal information of the recipient, and must not be singularly used as the basis of any investment
decision. Nothing in this document should be construed as investment or financial advice. Each recipient of this document should
make such investigations as they deem necessary to arrive at an independent evaluation of an investment in the securities of the
companies referred to in this document (including the merits and risks involved), and should consult their own advisors to determine
the merits and risks of such an investment.
Reports based on technical and derivative analysis center on studying charts of a stock's price movement, outstanding positions and
trading volume, as opposed to focusing on a company's fundamentals and, as such, may not match with a report on a company's
fundamentals.
The information in this document has been printed on the basis of publicly available information, internal data and other reliable
sources believed to be true, but we do not represent that it is accurate or complete and it should not be relied on as such, as this
document is for general guidance only. Angel Broking Pvt. Limited or any of its affiliates/ group companies shall not be in any way
responsible for any loss or damage that may arise to any person from any inadvertent error in the information contained in this report.
Angel Broking Pvt. Limited has not independently verified all the information contained within this document. Accordingly, we cannot
testify, nor make any representation or warranty, express or implied, to the accuracy, contents or data contained within this document.
While Angel Broking Pvt. Limited endeavors to update on a reasonable basis the information discussed in this material, there may be
regulatory, compliance, or other reasons that prevent us from doing so.
This document is being supplied to you solely for your information, and its contents, information or data may not be reproduced,
redistributed or passed on, directly or indirectly.
Neither Angel Broking Pvt. Limited, nor its directors, employees or affiliates shall be liable for any loss or damage that may arise from
or in connection with the use of this information.
Note: Please refer to the important ‘Stock Holding Disclosure' report on the Angel website (Research Section). Also, please refer to the
latest update on respective stocks for the disclosure status in respect of those stocks. Angel Broking Pvt. Limited and its affiliates may
have investment positions in the stocks recommended in this report.
5