Technical & Derivatives Report
November 09, 2016
Sensex (27591) / Nifty (8544)
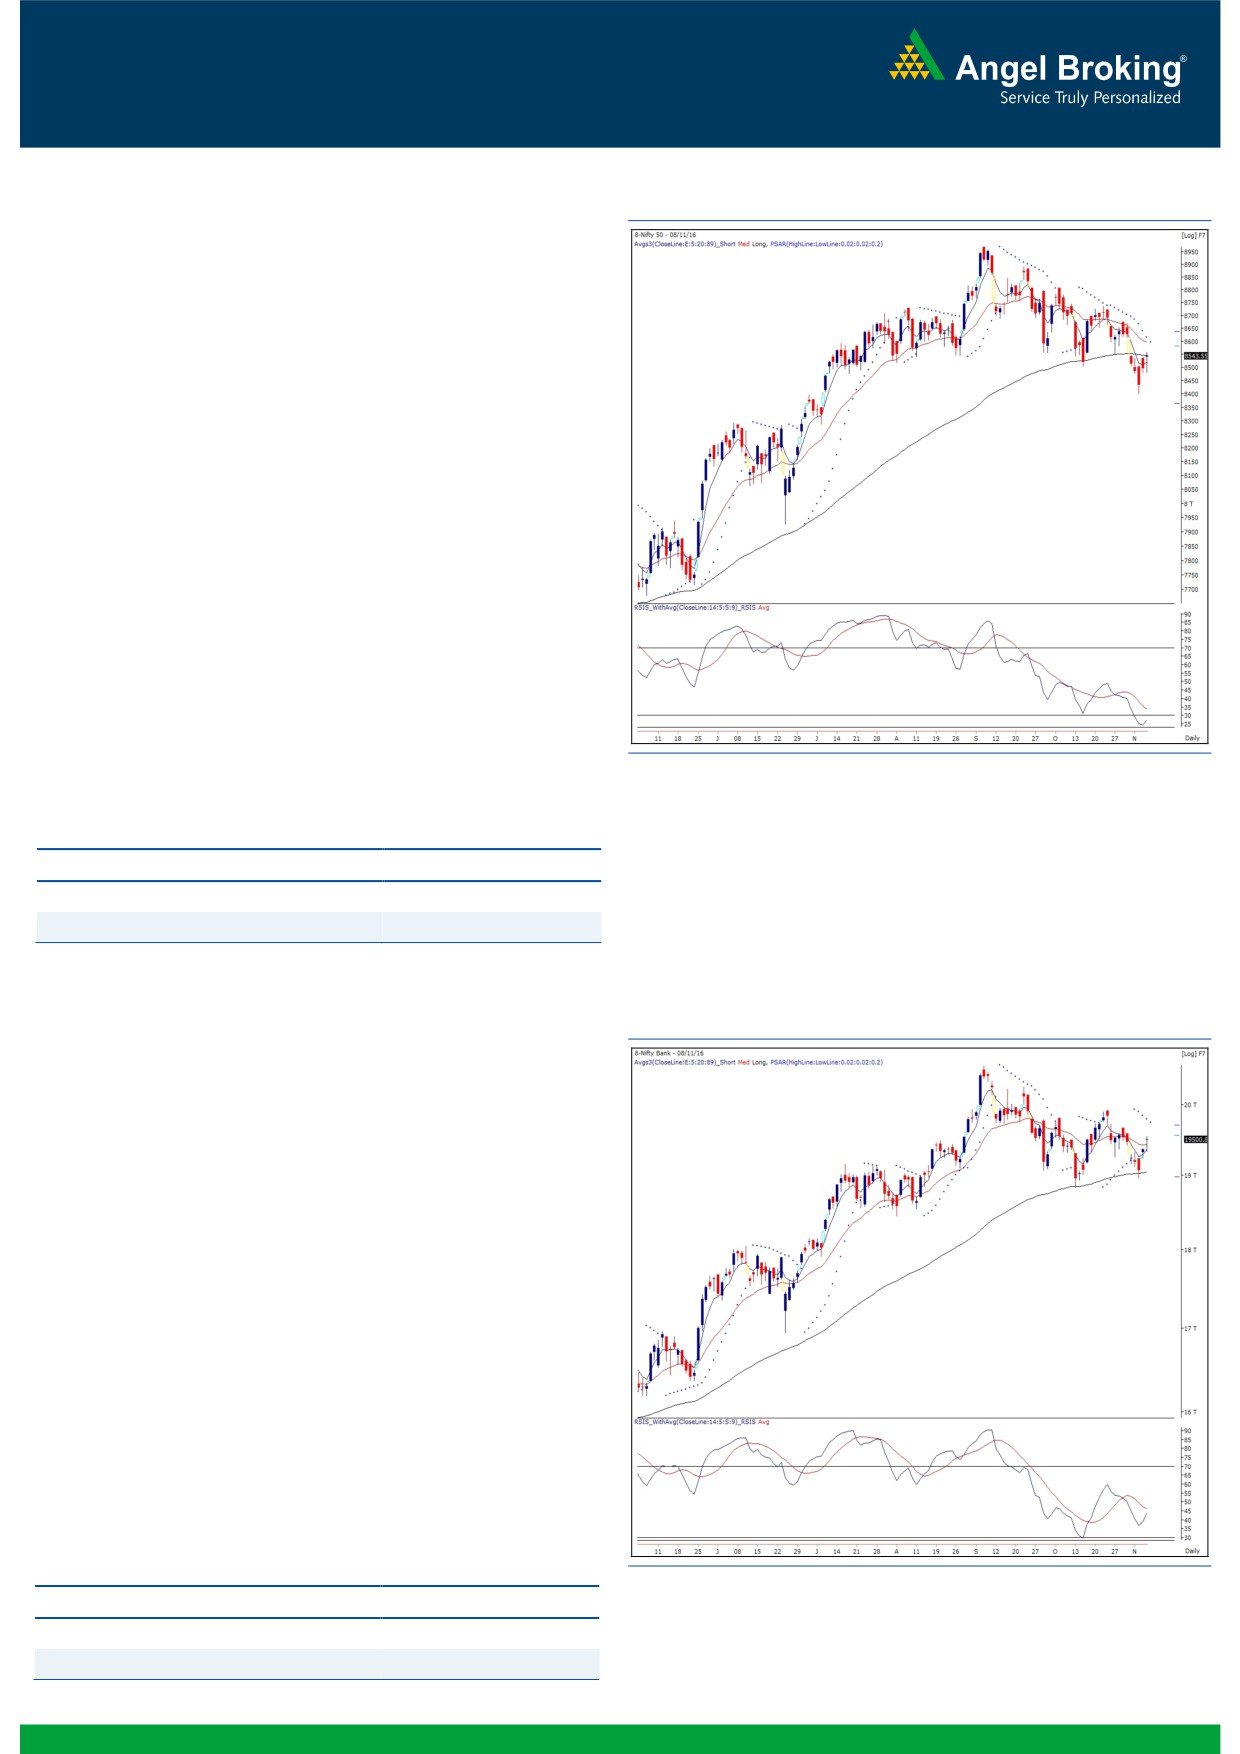
Exhibit 1: Nifty Daily Chart
Yesterday too, our markets opened higher but this time it was with
a very small margin. Subsequently, we witnessed a gradual slide
from morning highs; however, we witnessed a strong surge
during the penultimate hour which lasted till the closing trade of
the session. In the process, the Nifty regained all momentum and
eventually closed around the opening level with decent gains of
0.55%.
Markets remained range bound ahead of the U.S. Presidential
election, which may have an immediate impact across the globe.
Going ahead, an outcome from this event would probably dictate
the near term direction. But, technically speaking, we still do not
see any major sign of reversal. As far as levels are concerned,
8620 - 8682 would be seen as immediate resistance; whereas,
on the other hand, a failure to surpass these levels (post the
election outcome) may result into a continuation of the recent
down move to test lower levels. Now, tracking the SGX Nifty, if the
index stays below 8400 then we may see immediate correction
towards 8287 - 8200, which we have been expecting since last
few weeks.
Key Levels
Support 1 - 8287
Resistance 1 - 8620
Support 2 - 8200
Resistance 2 - 8682
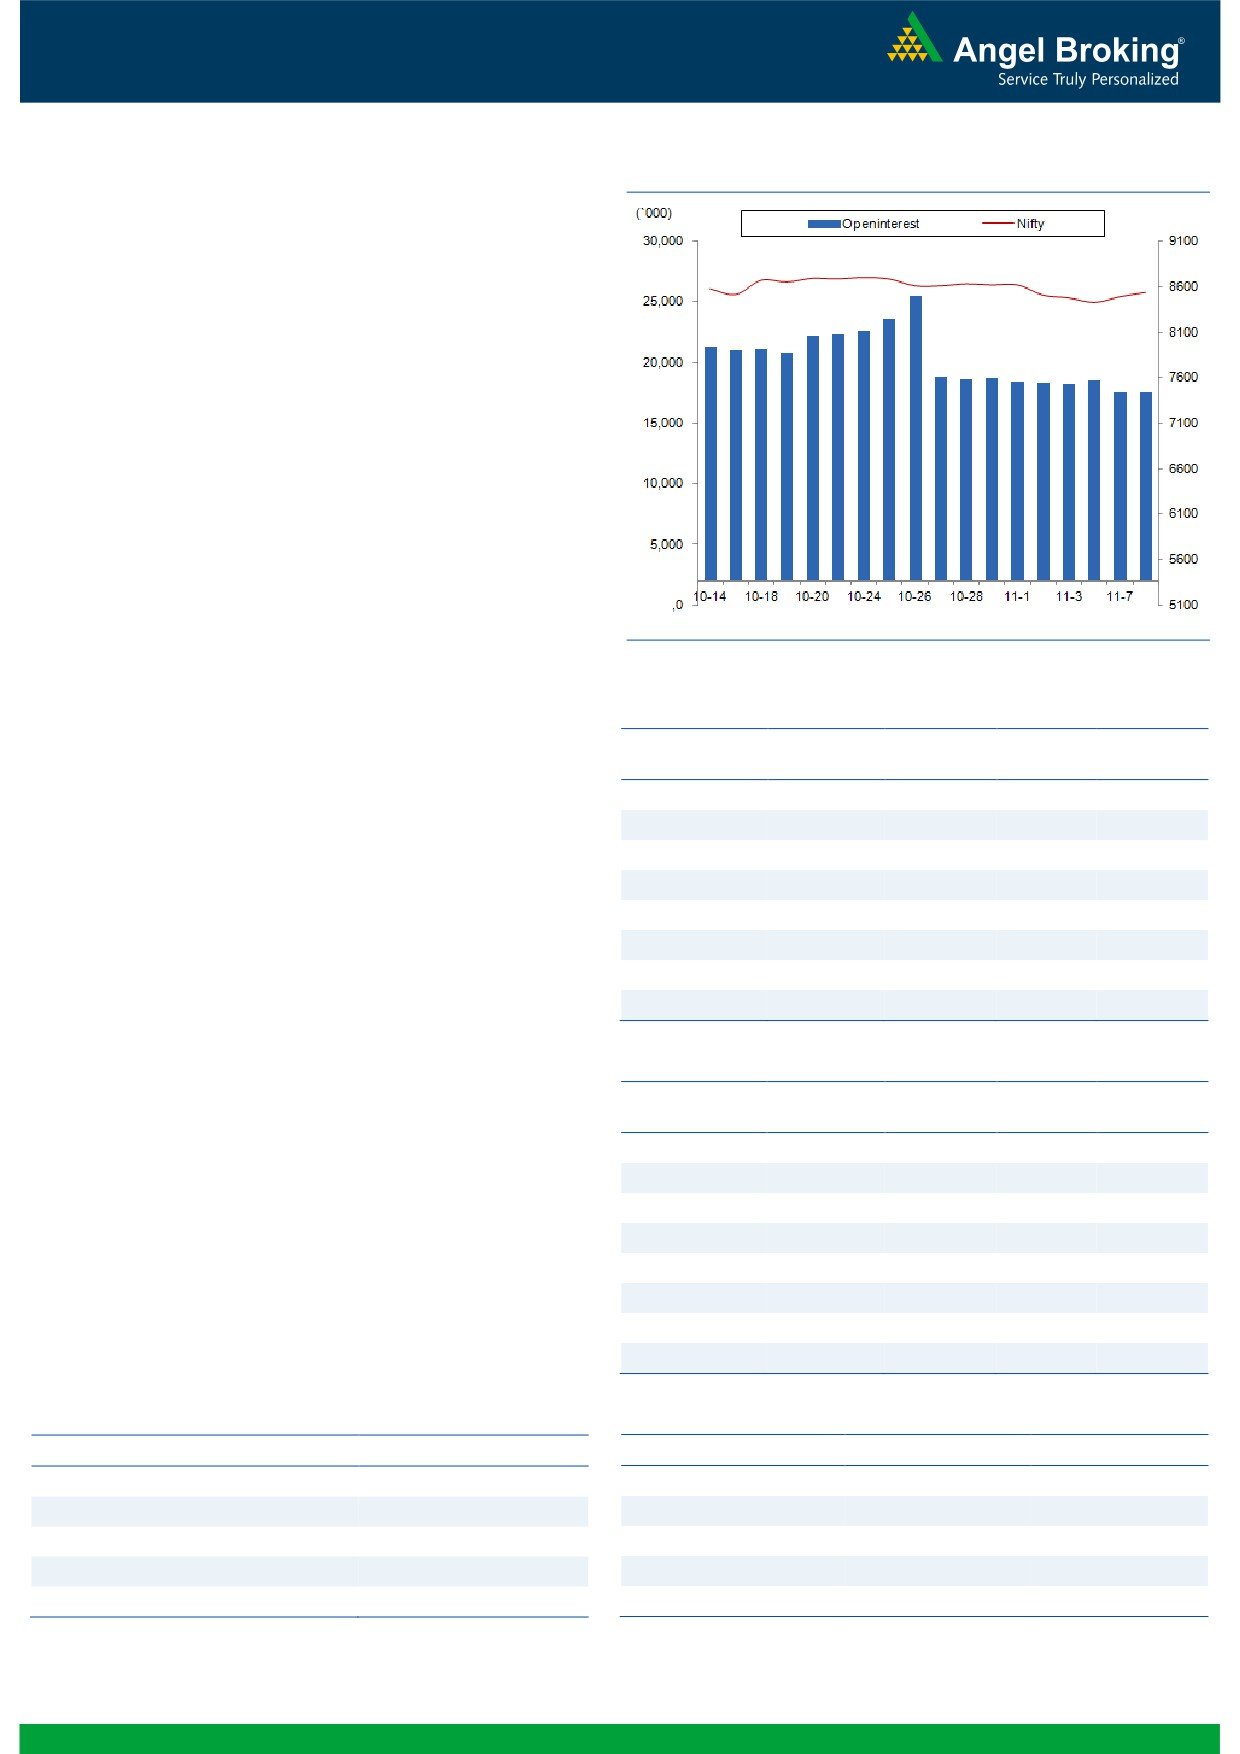
Exhibit 2: Nifty Bank Daily Chart
Nifty Bank Outlook - (19501)
The Nifty Bank index opened yesterday's session with a gap up
opening. However, owing to the volatility, the index filled the gap
during intraday and recovered during the last hour to conclude
the session with formation of a 'Doji' candle.
As we had mentioned in our yesterday's report, the Nifty Bank
index has recently pulled back higher from the '89 DEMA'
support. However, the recent 'Lower Top' formation has also
indicated that bears are showing their dominance on pullback
rallies. Hence, for positional trading, a closing beyond the broad
range of 19000 - 19700 will lead to directional movement.
Although the outcome of the U.S. Presidential Election can lead to
higher volatility in our markets along with the global indices,
traders are advised to keep track of the above-mentioned levels
and trade with proper risk management. The intraday supports
for the Nifty Bank index are placed around 19225 and 19000
whereas resistances are seen around 19700 and 19920.
Key Levels
Support 1 - 19225
Resistance 1 - 19700
Support 2 - 19000
Resistance 2 - 19920
1
Technical & Derivatives Report
November 09, 2016
Comments
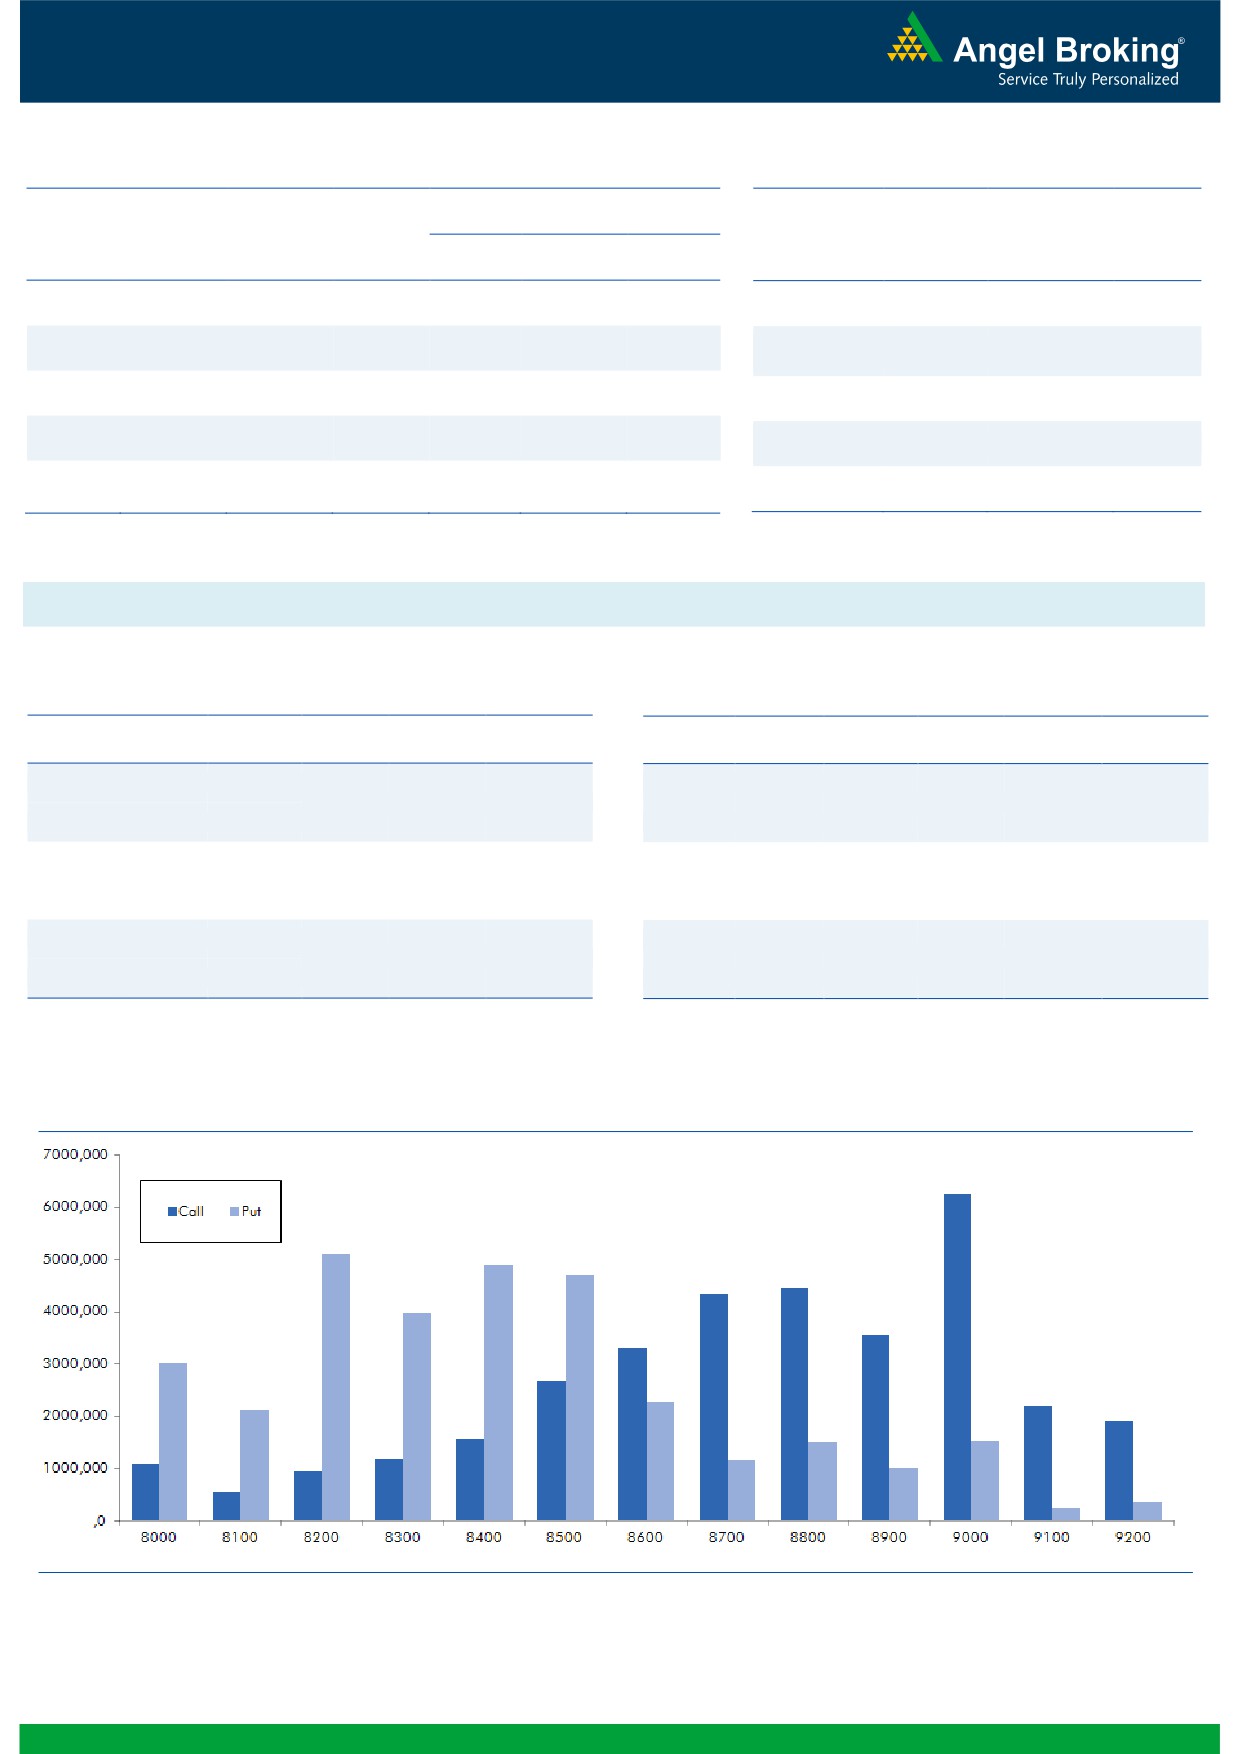
Nifty Vs OI
The Nifty futures open interest has increased by 0.01%
BankNifty futures open interest has decreased by 5.19%
as market closed at 8543.55 levels.
The Nifty November future closed with a premium of
23.00 against the premium of 22.95 points in last
trading session. The December series closed at a
premium of 72.00 points.
The Implied Volatility of at the money options has
increased from 16.86% to 17.73%. At the same time, the
PCR-OI of Nifty has increased from 0.93 to 0.96 levels.
The total OI of the market is Rs. 2,57,464/- cr. and the
stock futures OI is Rs. 74,857/- cr.
Few of the liquid counters where we have seen high cost
of carry are CESC, ADANIPOWER, NHPC, SINTEX and
PTC.
Views
OI Gainers
FIIs activity in cash market segment was subdued. While,
OI
PRICE
SCRIP
OI
PRICE
CHG. (%)
CHG. (%)
in index futures, they were net seller to the tune of Rs.
CEATLTD
1531600
18.66
1311.85
7.11
302 crores with marginal change in open interest,
UNIONBANK
16112000
11.46
130.05
-2.44
indicating blend of long unwinding and fresh short
CROMPGREAV
11892000
9.62
83.40
-2.91
www.angelbroking.com
formation in yesterday’s trading session.
CADILAHC
2931200
5.90
376.25
-2.41
On Index Options front, FIIs sold of worth Rs. 797 crores
HINDZINC
7763200
5.89
260.45
-1.12
with some rise in OI. In call options, 8700 and 8800
DABUR
10472500
5.78
297.00
0.19
strikes added good amount of positions and we believe
SUNPHARMA
33153200
5.55
638.30
-2.97
these are mainly short positions formed by FIIs. While,
MOTHERSUMI
11087500
4.72
312.15
-1.30
8300-8500 put options also added good amount of
positions. Maximum OI in November series is placed at
9000 call and 8200 put options.
OI Losers
Since past few trading sessions, we have been
OI
PRICE
SCRIP
OI
PRICE
CHG. (%)
CHG. (%)
continuously witnessing good amount of long unwinding
BEML
822500
-9.57
913.35
2.79
and some fresh short formation in Index Futures by
UPL
5503200
-9.47
685.00
2.49
stronger hands. They also bought good amount of put
PNB
40124000
-7.49
141.15
0.43
options during these period. The above data siuggests
TECHM
9324700
-5.94
454.85
1.96
market has limited upside. While, today’s global market
TVSMOTOR
5400000
-5.82
391.55
0.19
also suggests Nifty to open gap down.Thus, traders who
DCBBANK
1795500
-5.67
129.85
0.62
are short in market should hold on to their positions as
Nifty may test 8200 levels in near term.
COLPAL
679000
-5.55
979.95
0.37
HINDALCO
32788000
-5.53
168.05
0.15
Historical Volatility
Put-Call Ratio
SCRIP
HV
SCRIP
PCR-OI
PCR-VOL
TATAMOTORS
46.92
NIFTY
0.96
0.86
CEATLTD
60.43
BANKNIFTY
1.15
0.78
TATAMTRDVR
46.90
ICICIBANK
0.64
0.67
GAIL
29.77
RELIANCE
0.42
0.44
JSWSTEEL
35.50
SBIN
0.53
0.69
2
Technical & Derivatives Report
November 09, 2016
FII Statistics for November 08, 2016
Turnover on November 08, 2016
Open Interest
No. of
Turnover
Change
Detail
Buy
Sell
Net
Instrument
Value
Change
Contracts
( in Cr. )
(%)
Contracts
(in Cr.)
(%)
INDEX
INDEX
1207.72
1510.20
(302.48)
187033
12478.57
0.47
185903
12779.42
4.88
FUTURES
FUTURES
INDEX
INDEX
29016.76
29813.86
(797.10)
1023642
67162.68
4.55
2729205
189473.42
27.51
OPTIONS
OPTIONS
STOCK
6562.84
6016.49
546.34
877515
55720.38
(0.51)
STOCK
FUTURES
516951
35298.57
14.43
FUTURES
STOCK
STOCK
4985.34
4993.65
(8.32)
93616
6271.37
8.47
OPTIONS
373978
26316.88
17.82
OPTIONS
TOTAL
41772.65
42334.20
(561.54)
2181806
141633.00
2.26
TOTAL
3806037
263868.29
23.33
Nifty Spot = 8543.55
Lot Size = 75
Bull-Call Spreads
Bear-Put Spreads
Action
Strike
Price
Risk
Reward
BEP
Action
Strike
Price
Risk
Reward
BEP
Buy
8600
100.95
Buy
8500
95.65
41.65
58.35
8641.65
29.95
70.05
8470.05
Sell
8700
59.30
Sell
8400
65.70
Buy
8600
100.95
Buy
8500
95.65
69.85
130.15
8669.85
50.35
149.65
8449.65
Sell
8800
31.10
Sell
8300
45.30
Buy
8700
59.30
Buy
8400
65.70
28.20
71.80
8728.20
20.40
79.60
8379.60
Sell
8800
31.10
Sell
8300
45.30
Note: Above mentioned Bullish or Bearish Spreads in Nifty (November Series) are given as an information and not as a recommendation.
Nifty Put-Call Analysis
3
Technical & Derivatives Report
November 09, 2016
Daily Pivot Levels for Nifty Constituents
Scrips
S2
S1
PIVOT
R1
R2
ACC
1,481
1,494
1,503
1,517
1,526
ADANIPORTS
281
286
291
295
300
AMBUJACEM
240
243
244
246
247
ASIANPAINT
1,031
1,043
1,051
1,063
1,071
AUROPHARMA
735
745
760
770
784
AXISBANK
480
486
489
495
498
BAJAJ-AUTO
2,797
2,831
2,853
2,887
2,909
BANKBARODA
145
147
148
150
152
BHEL
137
140
144
146
150
BPCL
647
654
661
668
674
BHARTIARTL
298
301
304
307
310
INFRATEL
349
355
360
366
371
BOSCH
21,202
21,391
21,596
21,785
21,990
CIPLA
518
527
539
547
560
COALINDIA
312
314
318
321
325
DRREDDY
3,074
3,096
3,122
3,144
3,170
EICHERMOT
23,636
23,984
24,235
24,583
24,834
GAIL
418
428
435
446
452
GRASIM
891
902
914
925
938
HCLTECH
781
795
805
820
830
HDFCBANK
1,233
1,244
1,251
1,262
1,269
HDFC
1,356
1,373
1,384
1,402
1,413
HEROMOTOCO
3,299
3,336
3,361
3,398
3,423
HINDALCO
162
165
169
171
175
HINDUNILVR
832
838
842
849
853
ICICIBANK
274
279
283
288
292
IDEA
71
72
73
74
75
INDUSINDBK
1,197
1,206
1,212
1,221
1,227
INFY
963
973
980
990
997
ITC
250
253
255
258
260
KOTAKBANK
786
799
807
820
828
LT
1,374
1,385
1,396
1,407
1,418
LUPIN
1,464
1,486
1,517
1,538
1,569
M&M
1,359
1,372
1,380
1,393
1,402
MARUTI
5,511
5,590
5,661
5,740
5,810
NTPC
152
153
155
156
158
ONGC
263
266
269
273
275
POWERGRID
172
175
176
178
180
RELIANCE
995
999
1,003
1,007
1,010
SBIN
246
250
252
255
257
SUNPHARMA
613
624
644
655
674
TCS
2,239
2,264
2,286
2,311
2,333
TATAMTRDVR
326
336
341
351
357
TATAMOTORS
507
523
533
549
559
TATAPOWER
72
73
75
76
78
TATASTEEL
400
404
410
414
420
TECHM
441
448
452
458
462
ULTRACEMCO
3,875
3,917
3,943
3,985
4,011
WIPRO
442
447
451
456
461
YESBANK
1,180
1,203
1,220
1,243
1,259
ZEEL
493
499
507
513
521
4
Technical & Derivatives Report
November 09, 2016
Research Team Tel: 022 - 39357800
For Technical Queries
For Derivatives Queries
DISCLAIMER
Angel Broking Private Limited (hereinafter referred to as “Angel”) is a registered Member of National Stock Exchange of India Limited,
Bombay Stock Exchange Limited and Metropolitan Stock Exchange Limited. It is also registered as a Depository Participant with CDSL
and Portfolio Manager with SEBI. It also has registration with AMFI as a Mutual Fund Distributor. Angel Broking Private Limited is a
registered entity with SEBI for Research Analyst in terms of SEBI (Research Analyst) Regulations, 2014 vide registration number
INH000000164. Angel or its associates has not been debarred/ suspended by SEBI or any other regulatory authority for accessing
/dealing in securities Market. Angel or its associates/analyst has not received any compensation / managed or co-managed public
offering of securities of the company covered by Analyst during the past twelve months.
This document is solely for the personal information of the recipient, and must not be singularly used as the basis of any investment
decision. Nothing in this document should be construed as investment or financial advice. Each recipient of this document should
make such investigations as they deem necessary to arrive at an independent evaluation of an investment in the securities of the
companies referred to in this document (including the merits and risks involved), and should consult their own advisors to determine
the merits and risks of such an investment.
Reports based on technical and derivative analysis center on studying charts of a stock's price movement, outstanding positions and
trading volume, as opposed to focusing on a company's fundamentals and, as such, may not match with a report on a company's
fundamentals. Investors are advised to refer the Fundamental and Technical Research Reports available on our website to evaluate the
contrary view, if any.
The information in this document has been printed on the basis of publicly available information, internal data and other reliable
sources believed to be true, but we do not represent that it is accurate or complete and it should not be relied on as such, as this
document is for general guidance only. Angel Broking Pvt. Limited or any of its affiliates/ group companies shall not be in any way
responsible for any loss or damage that may arise to any person from any inadvertent error in the information contained in this report.
Angel Broking Pvt. Limited has not independently verified all the information contained within this document. Accordingly, we cannot
testify, nor make any representation or warranty, express or implied, to the accuracy, contents or data contained within this document.
While Angel Broking Pvt. Limited endeavors to update on a reasonable basis the information discussed in this material, there may be
regulatory, compliance, or other reasons that prevent us from doing so.
This document is being supplied to you solely for your information, and its contents, information or data may not be reproduced,
redistributed or passed on, directly or indirectly.
Neither Angel Broking Pvt. Limited, nor its directors, employees or affiliates shall be liable for any loss or damage that may arise from
or in connection with the use of this information.
5