Technical & Derivatives Report
September 09, 2016
Sensex (29045) / Nifty (8953)
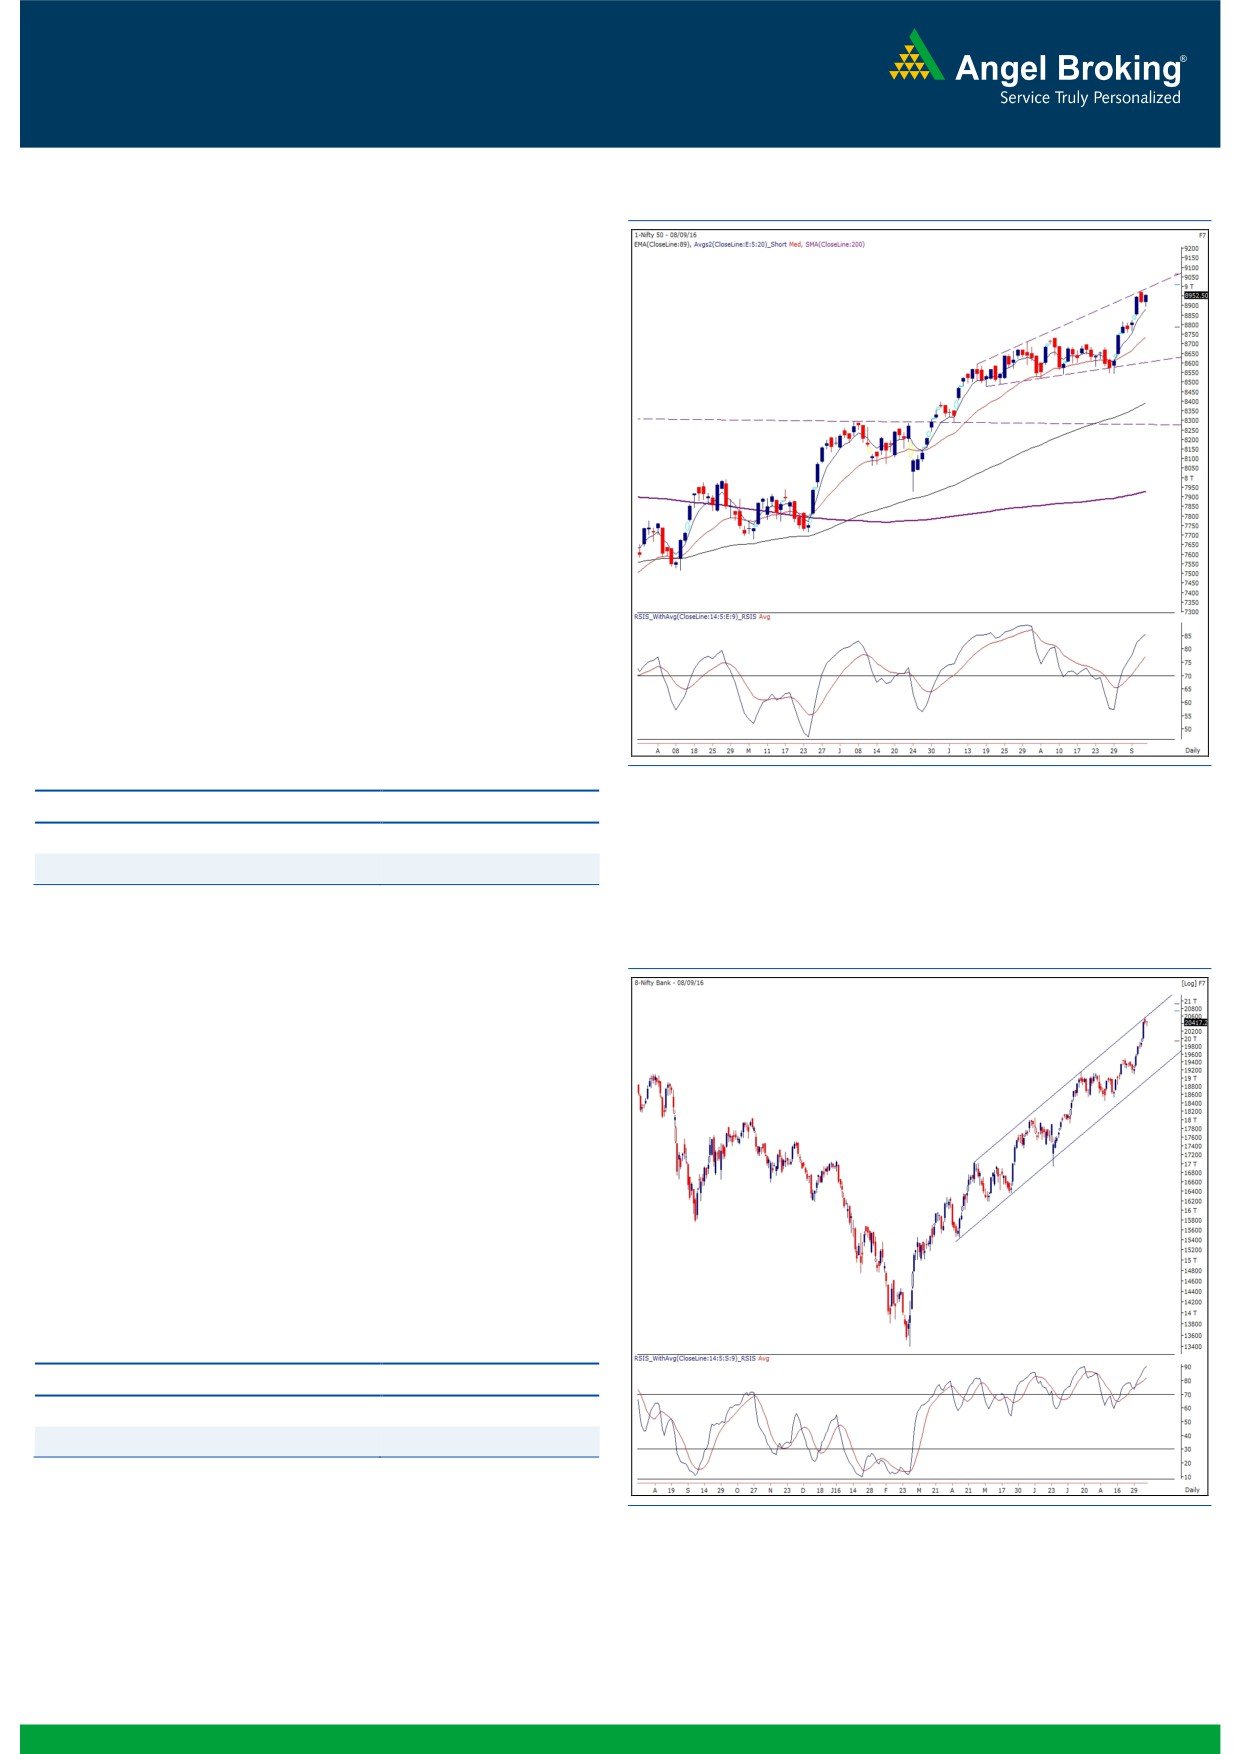
Exhibit 1: Nifty Daily Chart
Yesterday's session opened on a sluggish note considering mixed
cues from global bourses. Subsequently, we witnessed a lethargic
movement with mildly negative bias throughout the first half.
However, a decent recovery in the latter half pulled the index
above the 8950 mark.
On daily chart, we do not see any major change in the chart
structure and thus, we maintain our view that the index may
consolidate within a narrow range of 8980 - 8840 in the
forthcoming sessions. But, we still believe, lot of individual stocks,
especially mid-caps are likely to give spectacular moves whilst the
index undergoes this consolidation phase. Hence, traders are
advised to concentrate more on individual stocks which are likely
to give higher returns as compared to the benchmark index. Just
to highlight one key point, today's close would be very important
for the market as we need to closely watch whether the Nifty is
able to give a weekly close above 8937 or not, as it would then
confirm highest ever weekly close for the Nifty.
Key Levels
Support 1 - 8880
Resistance 1 - 8960
Support 2 - 8840
Resistance 2 - 8980
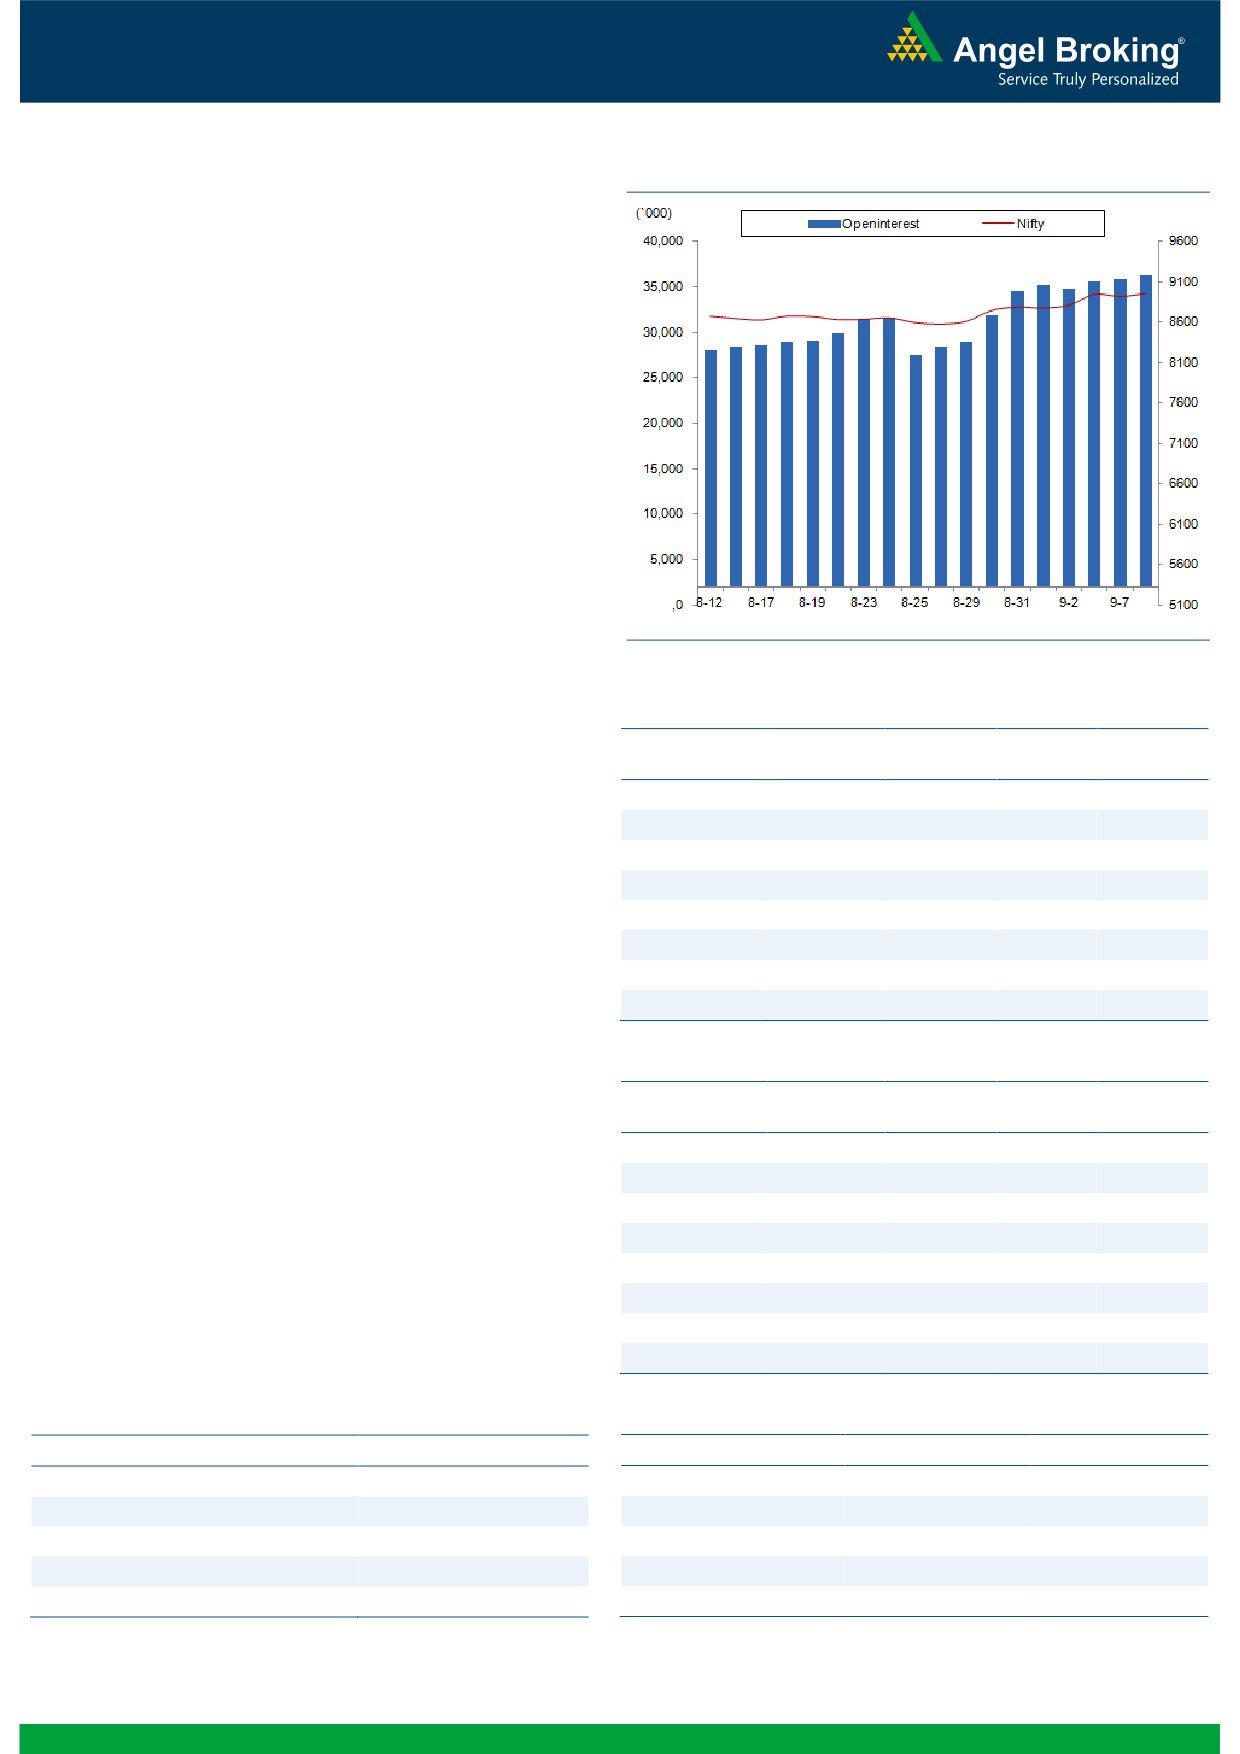
Nifty Bank Outlook - (20417)
Exhibit 2: Nifty Bank Daily Chart
The Nifty Bank index continued with its range bound movement
and ended yesterday's session almost near its previous session's
close.
With narrow range candles in last couple of sessions, there is no
change in the technical structure in the index. Hence, we continue
to reiterate our view that the index can trade range bound in near
term whereas, there could be stock specific momentum from
trading perspective. Hence, traders are advised to continue to
focus on stock specific moves with proper risk management. The
intraday support for the index are placed around 20278 and
20200 whereas resistances are seen around 20575 and 20630.
Key Levels
Support 1 - 20278
Resistance 1 - 20575
Support 2 - 20200
Resistance 2 - 20630
1
Technical & Derivatives Report
September 09, 2016
Comments
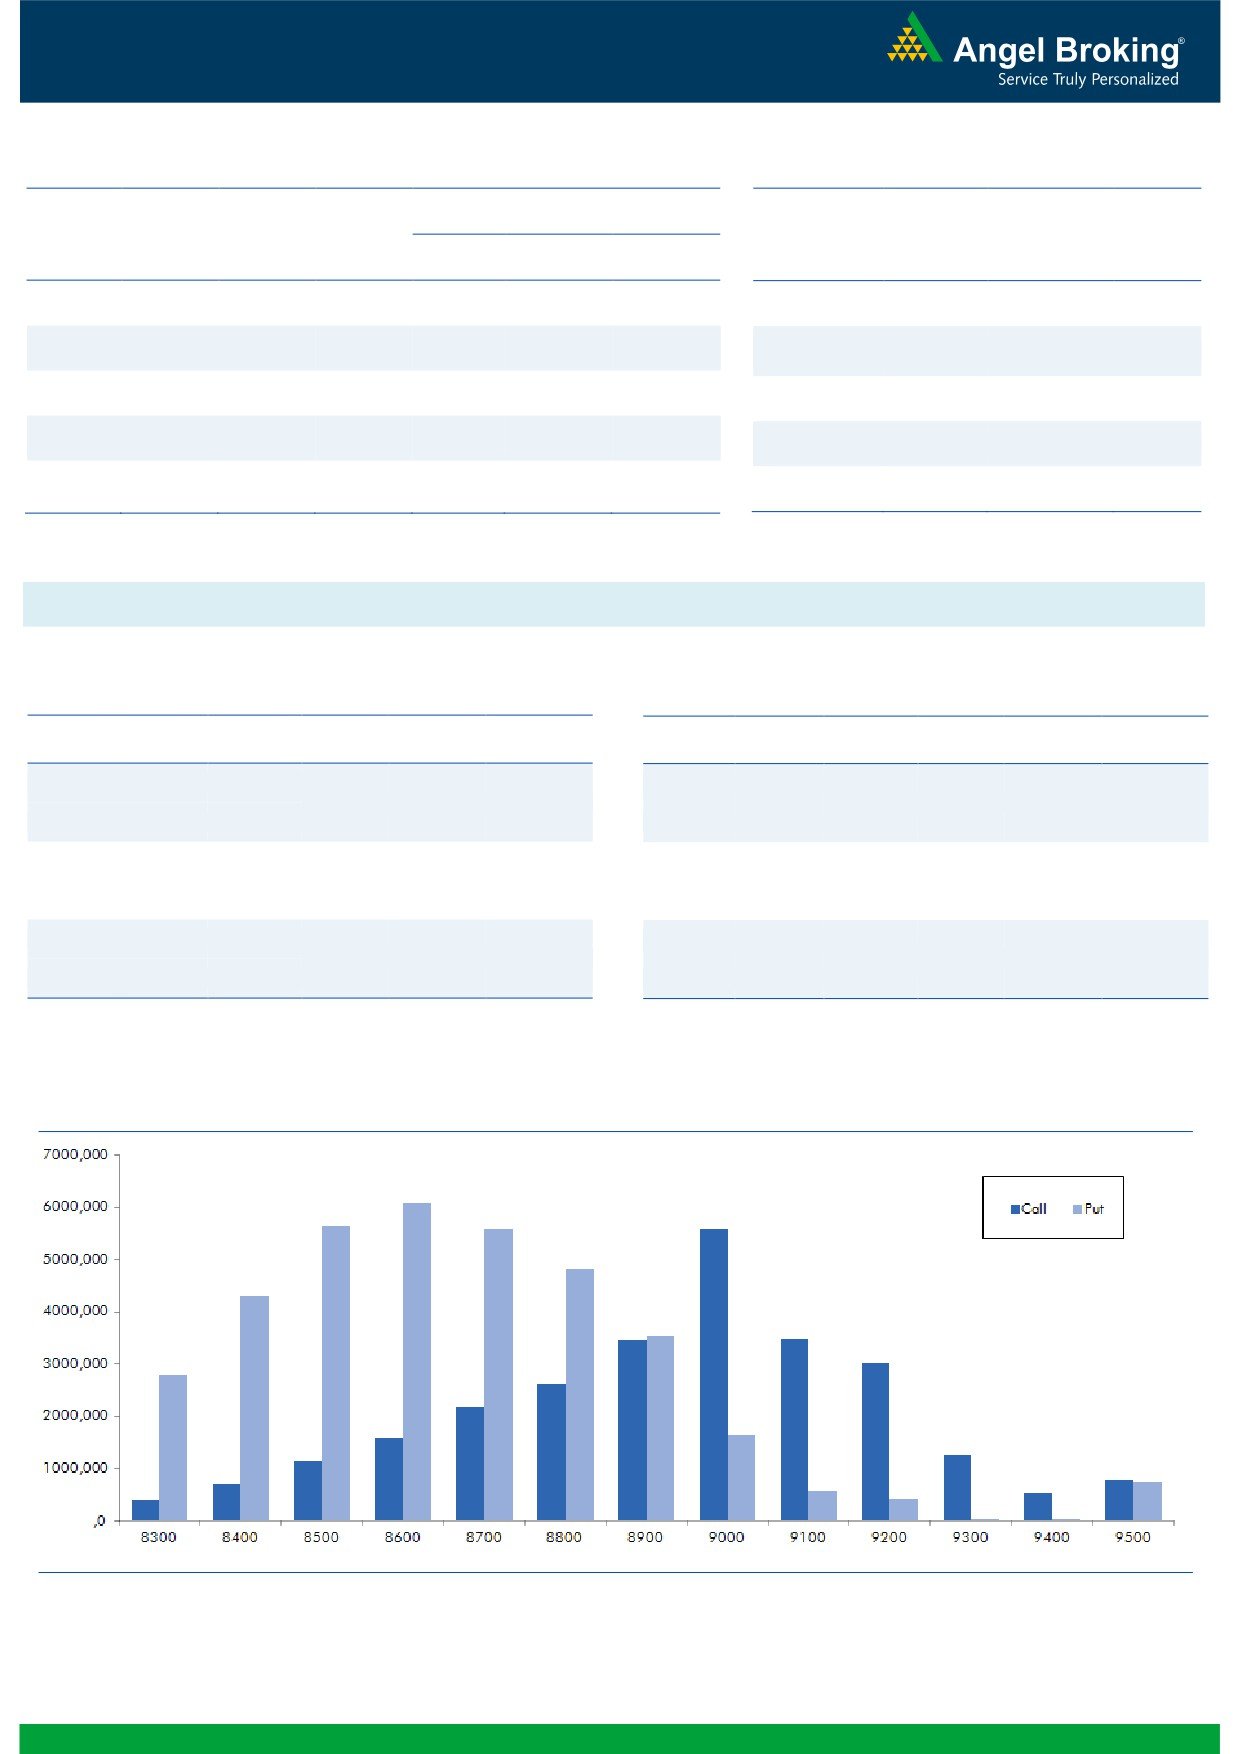
Nifty Vs OI
The Nifty futures open interest has increased by 1.16%
BankNifty futures open interest has decreased by 0.01%
as market closed at 8952.50 levels.
The Nifty September future closed with a premium of
30.05 points against a premium of 34.15 points in
previous session. The October series closed at a
premium of 68.55 points.
The Implied Volatility of at the money options has
decreased from 11.31% to 11.06%. At the same time,
the PCR-OI of Nifty has increased from 1.20 to 1.23.
The total OI of the market is Rs. 3,14,937/- cr. and the
stock futures OI is Rs. 85,969/- cr.
Few of the liquid counters where we have seen high cost
of carry are KSCL, NHPC, CADILAHC, ADANIPOWER
and NCC.
Views
OI Gainers
FIIs continue to pour in liquidity in cash market segment.
OI
PRICE
Yesterday, they bought equities to the tune of Rs. 111
SCRIP
OI
PRICE
CHG. (%)
CHG. (%)
crores. While, they were marginal sellers in index future
CAIRN
15533000
23.86
199.40
-1.21
with rise in OI, indicating blend of both long and short
APOLLOHOSP
528800
15.06
1371.40
-0.95
formation in last trading session.
JUSTDIAL
4413600
14.48
501.60
-1.83
On Index Options front, FIIs were net sellers of Rs. 17ng.com
TORNTPHARM
312400
14.35
1693.05
4.22
crores with rise in OI. In call options, 9200 strikes added
WOCKPHARMA
3652800
13.69
881.40
5.61
some fresh positions. On the other hand, in put options,
MOTHERSUMI
11977500
13.00
328.60
-2.82
8900 and 8700 strikes added decent positions, which
IRB
14260000
12.88
253.40
9.27
are mostly shorts as implied volatility of put options
PETRONET
7323000
12.70
350.50
1.71
decreased yesterday. Highest OI in September series is
placed at 9000 call and 8600 put option.
Since last 3-4 trading sessions, FIIs continue buying in
OI Losers
OI
PRICE
cash segment, at the same time mixed activity was visible
SCRIP
OI
PRICE
CHG. (%)
CHG. (%)
in Index Futures. Longs formed in Index Futures are still
SAIL
78900000
-11.26
53.80
3.16
intact and we are not seeing any sign of profit booking
IBREALEST
39500000
-8.05
86.50
4.85
as of now. Thus, we advise traders to trade with positive
UNIONBANK
13540000
-5.71
152.40
0.56
bias and focus more on stock specific move.
CEATLTD
2079700
-4.44
1033.10
1.40
Large cap counters that added longs are GRASIM,
LUPIN
5550900
-4.34
1583.80
2.43
HINDUNILVR and CIPLA. While, stock like YESBANK,
OIL
2320500
-4.08
388.40
-0.08
TECHM and TCS added fresh short position in yesterdays
JISLJALEQS
48960000
-3.67
94.50
-1.82
trading session.
SYNDIBANK
13140000
-3.63
80.45
1.19
Historical Volatility
Put-Call Ratio
SCRIP
HV
SCRIP
PCR-OI
PCR-VOL
IRB
51.87
NIFTY
1.23
1.22
HDIL
49.79
BANKNIFTY
1.33
0.95
TCS
34.19
RELIANCE
0.42
0.36
GMRINFRA
52.38
TATAMOTORS
1.23
0.78
YESBANK
38.19
SBIN
0.88
0.68
2
Technical & Derivatives Report
September 09, 2016
FII Statistics for 08, September 2016
Turnover on 08, September 2016
Open Interest
No. of
Turnover
Change
Detail
Buy
Sell
Net
Instrument
Value
Contracts
( in Cr. )
(%)
Contracts
Change (%)
(in Cr.)
INDEX
INDEX
2003.47
2059.27
(55.80)
463058
31823.44
1.12
162520
11864.70
-18.12
FUTURES
FUTURES
INDEX
INDEX
36213.68
36230.46
(16.79)
1157085
79707.64
1.87
4852253
379428.58
15.92
OPTIONS
OPTIONS
STOCK
6897.36
7848.42
(951.06)
887401
60840.68
1.08
STOCK
FUTURES
641941
46306.10
-10.70
FUTURES
STOCK
STOCK
6424.85
6459.35
(34.50)
102680
7359.74
6.37
OPTIONS
408736
30225.94
-5.06
OPTIONS
TOTAL
51539.35
52597.51
(1058.15)
2610224
179731.50
1.64
TOTAL
6065450
467825.33
9.95
Nifty Spot = 8952.50
Lot Size = 75
Bull-Call Spreads
Bear-Put Spreads
Action
Strike
Price
Risk
Reward
BEP
Action
Strike
Price
Risk
Reward
BEP
Buy
9000
83.95
Buy
8900
65.55
40.70
59.30
9040.70
25.80
74.20
8874.20
Sell
9100
43.25
Sell
8800
39.75
Buy
9000
83.95
Buy
8900
65.55
64.95
135.05
9064.95
41.25
158.75
8858.75
Sell
9200
19.00
Sell
8700
24.30
Buy
9100
43.25
Buy
8800
39.75
24.25
75.75
9124.25
15.45
84.55
8784.55
Sell
9200
19.00
Sell
8700
24.30
Note: Above mentioned Bullish or Bearish Spreads in Nifty (September Series) are given as an information and not as a recommendation.
Nifty Put-Call Analysis
3
Technical & Derivatives Report
September 09, 2016
Daily Pivot Levels for Nifty Constituents
Scrips
S2
S1
PIVOT
R1
R2
ACC
1,666
1,679
1,697
1,711
1,729
ADANIPORTS
270
273
275
277
279
AMBUJACEM
272
274
276
278
280
ASIANPAINT
1,162
1,172
1,181
1,191
1,200
AUROPHARMA
765
786
798
819
831
AXISBANK
613
621
628
636
642
BAJAJ-AUTO
2,923
3,006
3,063
3,146
3,203
BANKBARODA
171
173
175
177
179
BHEL
148
153
158
162
167
BPCL
580
583
588
592
597
BHARTIARTL
315
320
324
328
332
INFRATEL
344
351
356
363
368
BOSCH
24,155
24,302
24,438
24,584
24,721
CIPLA
574
585
592
602
609
COALINDIA
327
330
331
334
336
DRREDDY
3,120
3,154
3,176
3,210
3,232
EICHERMOT
22,618
23,018
23,259
23,659
23,900
GAIL
374
382
394
402
414
GRASIM
4,583
4,679
4,750
4,846
4,917
HCLTECH
737
756
769
787
800
HDFCBANK
1,278
1,284
1,289
1,295
1,301
HDFC
1,422
1,430
1,436
1,444
1,451
HEROMOTOCO
3,543
3,623
3,682
3,762
3,820
HINDALCO
158
160
162
164
165
HINDUNILVR
923
938
946
960
968
ICICIBANK
272
274
278
280
283
IDEA
83
84
84
85
86
INDUSINDBK
1,191
1,205
1,215
1,229
1,239
INFY
1,015
1,026
1,036
1,047
1,057
ITC
262
263
264
266
267
KOTAKBANK
792
806
814
828
836
LT
1,511
1,525
1,536
1,550
1,560
LUPIN
1,519
1,551
1,570
1,601
1,620
M&M
1,474
1,483
1,492
1,501
1,509
MARUTI
5,256
5,373
5,436
5,553
5,616
NTPC
157
159
160
161
163
ONGC
238
242
248
253
259
POWERGRID
179
183
185
189
191
RELIANCE
1,014
1,024
1,030
1,040
1,046
SBIN
264
266
269
271
274
SUNPHARMA
766
787
798
819
831
TCS
2,247
2,285
2,322
2,360
2,398
TATAMTRDVR
359
365
371
376
382
TATAMOTORS
571
577
585
591
599
TATAPOWER
76
77
77
78
78
TATASTEEL
382
393
401
411
419
TECHM
448
454
460
466
472
ULTRACEMCO
4,037
4,076
4,103
4,142
4,169
WIPRO
465
470
475
479
484
YESBANK
1,278
1,303
1,347
1,372
1,415
ZEEL
529
534
538
543
547
4
Technical & Derivatives Report
September 09, 2016
Research Team Tel: 022 - 39357800
For Technical Queries
For Derivatives Queries
DISCLAIMER
Angel Broking Private Limited (hereinafter referred to as “Angel”) is a registered Member of National Stock Exchange of India Limited,
Bombay Stock Exchange Limited and Metropolitan Stock Exchange Limited. It is also registered as a Depository Participant with CDSL
and Portfolio Manager with SEBI. It also has registration with AMFI as a Mutual Fund Distributor. Angel Broking Private Limited is a
registered entity with SEBI for Research Analyst in terms of SEBI (Research Analyst) Regulations, 2014 vide registration number
INH000000164. Angel or its associates has not been debarred/ suspended by SEBI or any other regulatory authority for accessing
/dealing in securities Market. Angel or its associates/analyst has not received any compensation / managed or co-managed public
offering of securities of the company covered by Analyst during the past twelve months.
This document is solely for the personal information of the recipient, and must not be singularly used as the basis of any investment
decision. Nothing in this document should be construed as investment or financial advice. Each recipient of this document should
make such investigations as they deem necessary to arrive at an independent evaluation of an investment in the securities of the
companies referred to in this document (including the merits and risks involved), and should consult their own advisors to determine
the merits and risks of such an investment.
Reports based on technical and derivative analysis center on studying charts of a stock's price movement, outstanding positions and
trading volume, as opposed to focusing on a company's fundamentals and, as such, may not match with a report on a company's
fundamentals. Investors are advised to refer the Fundamental and Technical Research Reports available on our website to evaluate the
contrary view, if any.
The information in this document has been printed on the basis of publicly available information, internal data and other reliable
sources believed to be true, but we do not represent that it is accurate or complete and it should not be relied on as such, as this
document is for general guidance only. Angel Broking Pvt. Limited or any of its affiliates/ group companies shall not be in any way
responsible for any loss or damage that may arise to any person from any inadvertent error in the information contained in this report.
Angel Broking Pvt. Limited has not independently verified all the information contained within this document. Accordingly, we cannot
testify, nor make any representation or warranty, express or implied, to the accuracy, contents or data contained within this document.
While Angel Broking Pvt. Limited endeavors to update on a reasonable basis the information discussed in this material, there may be
regulatory, compliance, or other reasons that prevent us from doing so.
This document is being supplied to you solely for your information, and its contents, information or data may not be reproduced,
redistributed or passed on, directly or indirectly.
Neither Angel Broking Pvt. Limited, nor its directors, employees or affiliates shall be liable for any loss or damage that may arise from
or in connection with the use of this information.
5