Technical & Derivatives Report
May 09, 2016
Sensex (25229) / Nifty (7733)
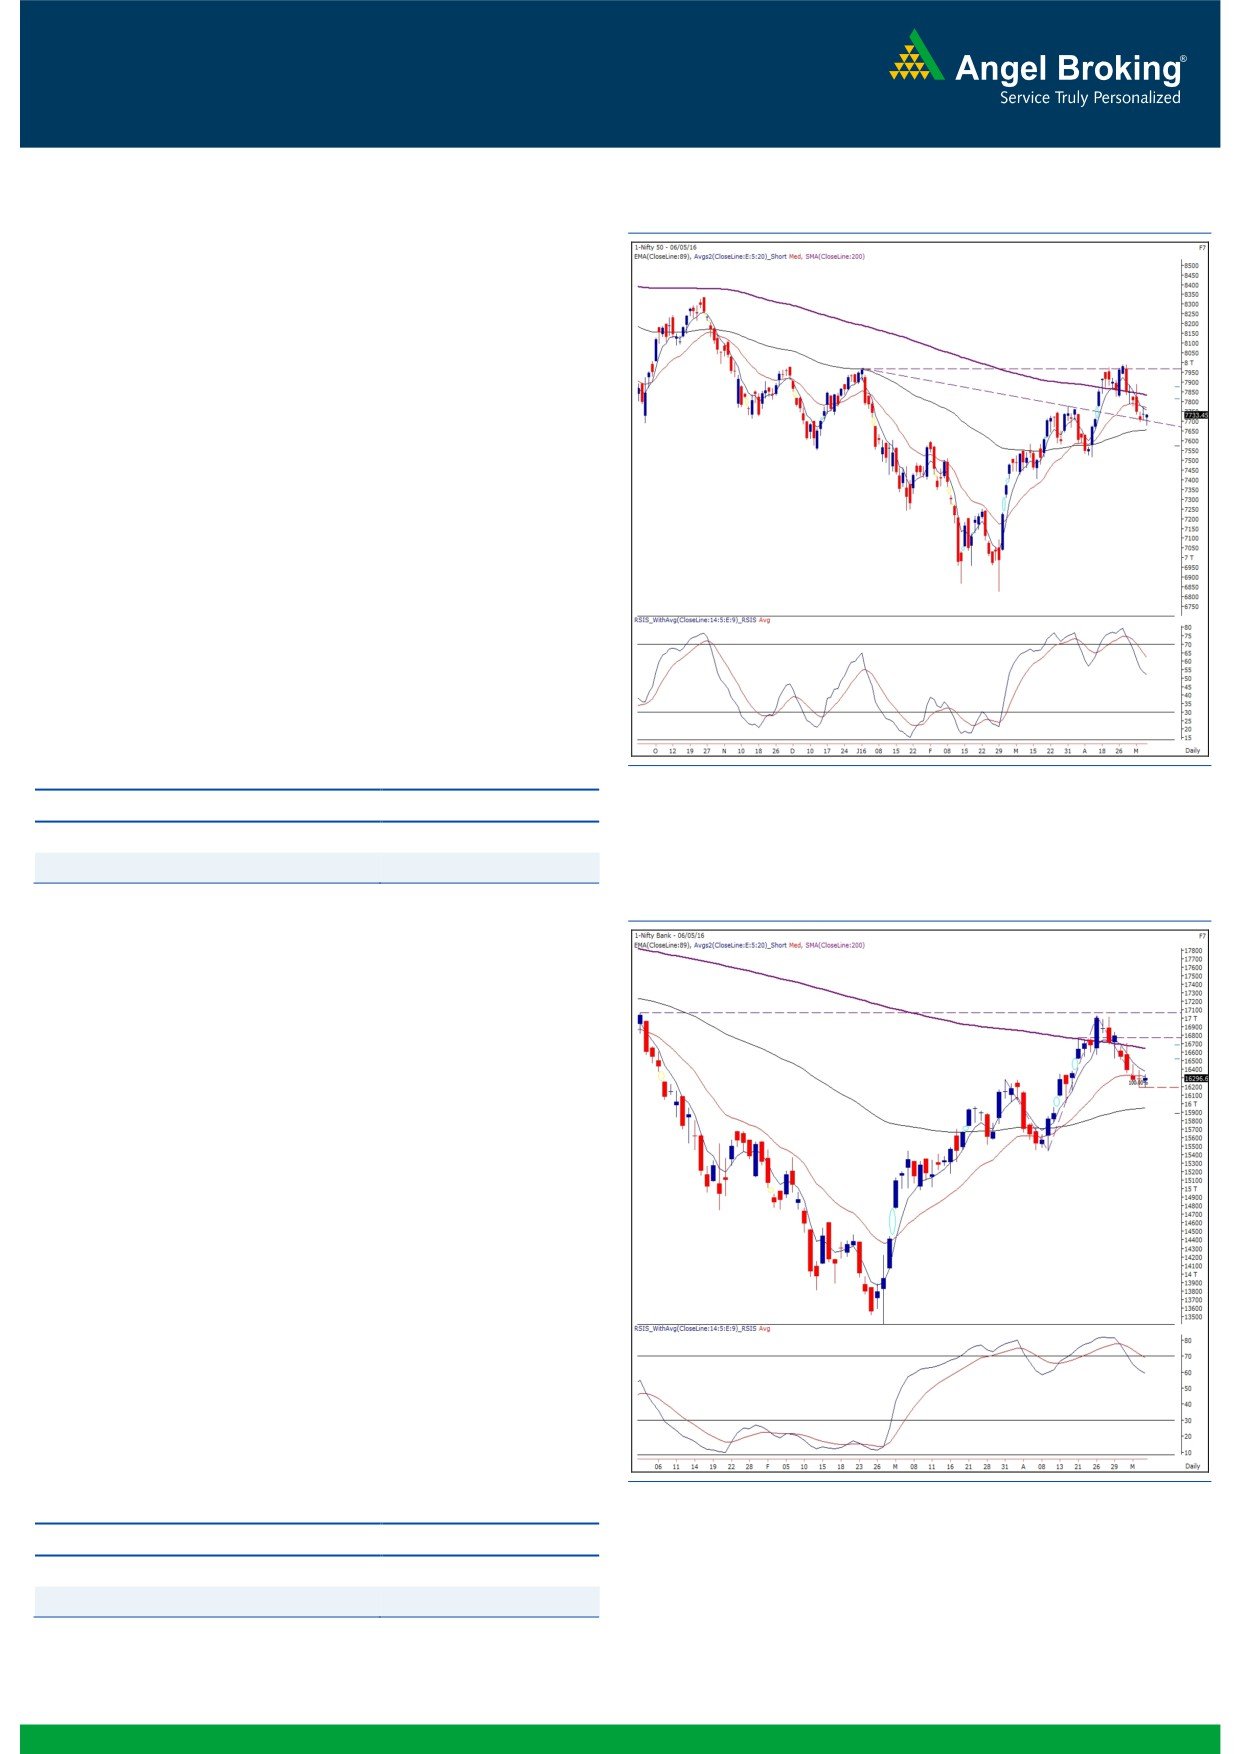
Exhibit 1: Nifty Daily Chart
Post negative opening on Friday, the Nifty index pulled back
higher from its support zone and recovered the losses to end the
session on a flat note.
The index’ behaviour post the breakdown below this support in
the following three sessions suggests exhaustion and lack of
strength in this correction. In addition, a few important technical
evidences such as the ‘Downward Sloping Trend Line’ (at 7700)
and the daily ’89 EMA’ (at 7650) are likely to act as a sheet
anchor for the bulls. Going forward, as long as the Nifty
manages to sustain above the 7650 mark, there is a fair
possibility of a decent bounce back towards 7870 - 7920. We
reiterate our view that traders should refrain from creating fresh
short positions and should ideally keep a close track on the 7780
mark, which may provide a potential trade on the long side.
Meanwhile, lots of individual stocks are likely to perform well in
the forthcoming session. Thus, traders can adopt a stock centric
approach with a proper exit strategy.
Key Levels
Support 1 - 7700
Resistance 1 - 7780
Support 2 - 7650
Resistance 2 - 7890
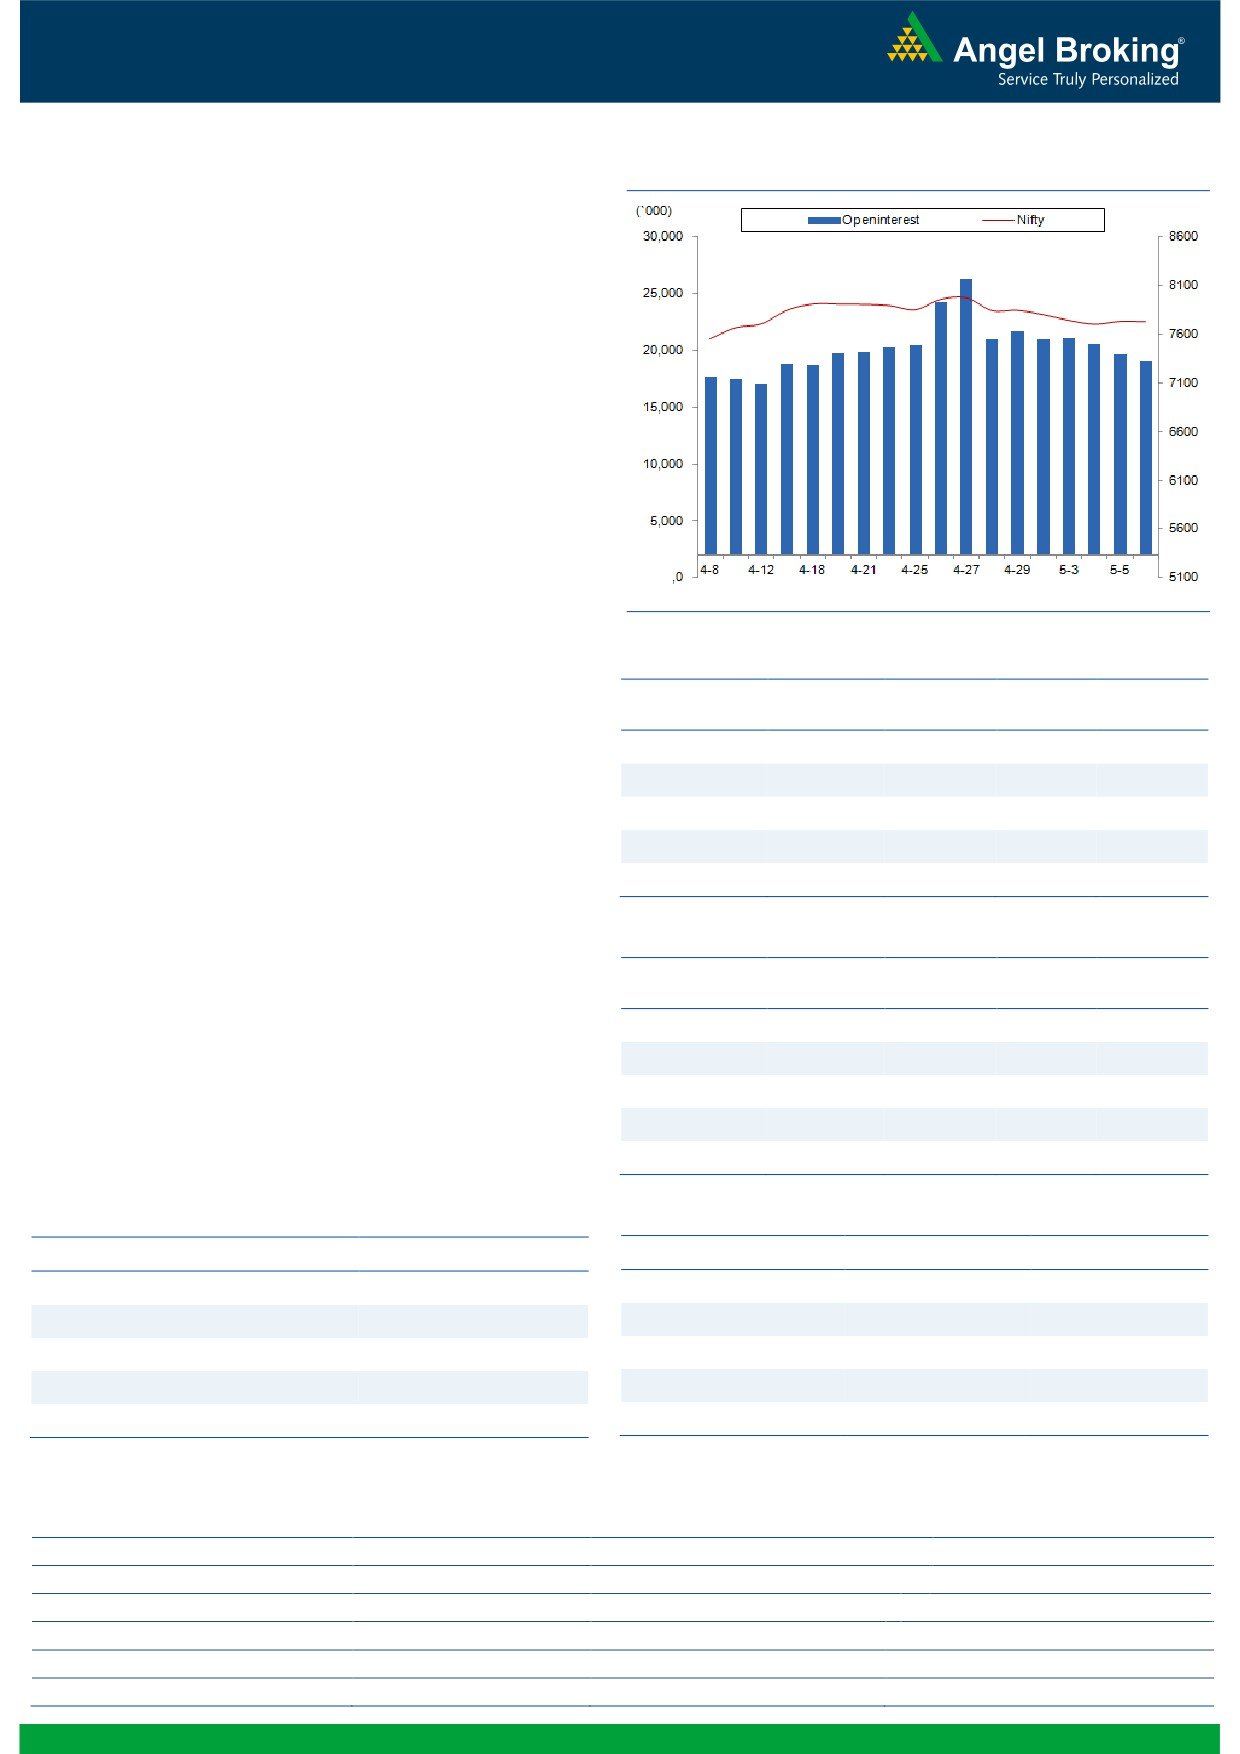
Exhibit 2: Nifty Bank Daily Chart
Nifty Bank Outlook - (16297)
The Nifty Bank index opened with marginal loss on Friday and
corrected in initial hour of trading. However, the index reversed
piercingly and rallied by around a percent from its intraday lows.
Eventually, the Nifty Bank index ended with negligible gains of
0.10 percent.
On Friday too, the Nifty Bank index traded in a narrow range and
registered low near the support of 16187 which is the 100%
extension level of the previous corrective move seen in the month
of April (16282.75 to 15440.25). This has led to formation of
‘Reciprocal AB=CD’ pattern on daily chart, which is a reversal
pattern. The Nifty Bank index also has an immediate support at
16146 (Super Trend indicator on daily chart) and at 16050
(61.8% retracement of the previous upmove). Since there are
multiple supports in the range of 16050 to 16190, we may see a
pullback rally in the index. Thus, traders are advised to book
profit in short positions and start initiating long on declines with
proper exit strategy. On the flipside, immediate resistance for the
index is seen around 16465 and 16530.
Key Levels
Support 1 - 16146
Resistance 1 - 16465
Support 2 - 16050
Resistance 2 - 16530
1
Technical & Derivatives Report
May 09, 2016
Comments
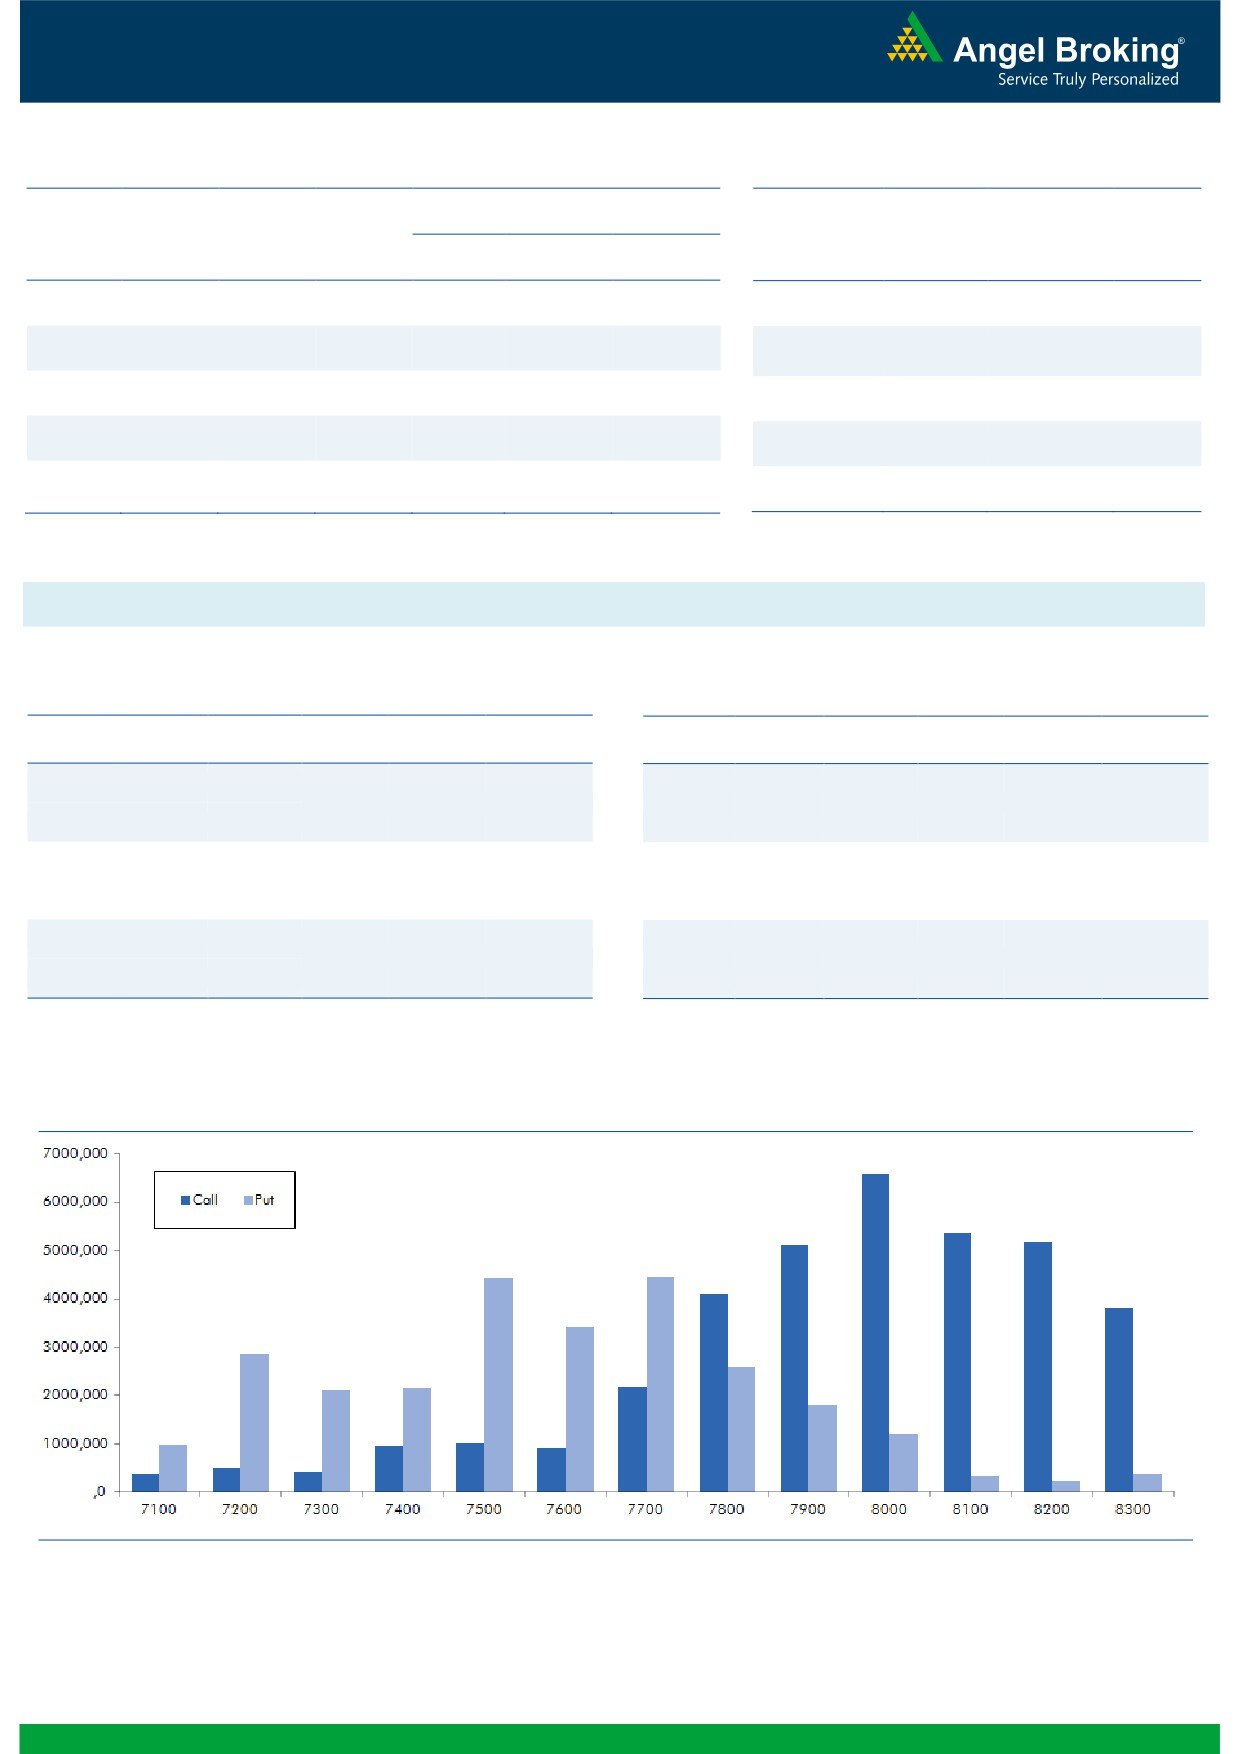
Nifty Vs OI
The Nifty futures open interest has decreased by 3.08%
BankNifty futures open interest has increased by 0.95%
as market closed at 7733.45 levels.
The Nifty May future closed at a premium of 26.80
points against a premium of 37.60 points. The June
series closed at a premium of 38.25 points.
The Implied Volatility of at the money options has
decreased from 15.75% to 15.05%.
The total OI of the market is Rs. 2,06,457/- cr. and the
stock futures OI is Rs. 58,292/- cr.
Few of the liquid counters where we have seen high cost
of carry are JPASSOCIAT, UNITECH, ADANIENT,
ADANIPOWER and SOUTHBANK.
Views
FIIs activity in cash market segment was subdued. While
in Index Futures, they continue selling to the tune of Rs.
OI Gainers
989 crores with fall in OI, indicating long unwinding in
OI
PRICE
SCRIP
OI
PRICE
last trading session.
CHG. (%)
CHG. (%)
VOLTAS
4798000
9.60
306.55
5.18
In Index Options front, FIIs sold worth Rs. 113 crores with
TITAN
6862500
9.37
364.90
1.66
good amount of rise in OI. In call options, 7900 and
IDFC
63554700
8.69
47.10
11.61
8000 strikes were quite active and they also added some
fresh positions. While in put options, we hardly saw any
WOCKPHARMA
2414625
8.42
942.15
-3.53
meaningful OI addition, decent amount of unwinding
GAIL
7149800
8.41
384.10
4.63
was visible in 7400 put options. Maximum OI in call
options has shifted from 8000 to 8100 strike; whereas in
OI Losers
put options, it remained intact at 7700 strike. Nifty
OI
PRICE
SCRIP
OI
PRICE
remained under pressure but this move was only because
CHG. (%)
CHG. (%)
of long unwinding, we didn’t witness any short
INDUSINDBK
4912800
-5.37
1042.40
-0.21
formation. Since, the Nifty is trading near around its
TATAMOTORS
24498000
-4.46
391.60
2.30
crucial support of 7650 - 7700 zone, shorting at current
COALINDIA
20506800
-3.42
282.60
0.71
levels won’t be a prudent strategy. Thus, we advise
WIPRO
8263000
-3.41
545.85
0.67
traders to remain light in this market till we see any
TVSMOTOR
5786000
-3.31
295.10
1.92
meaningful fresh positions in either direction.
Historical Volatility
Put-Call Ratio
SCRIP
HV
SCRIP
PCR-OI
PCR-VOL
IDFC
67.27
NIFTY
0.79
0.78
KTKBANK
42.28
BANKNIFTY
0.77
0.67
GAIL
41.06
ICICIBANK
0.37
0.26
VOLTAS
43.65
RELIANCE
0.38
0.32
HEXAWARE
39.68
SBIN
0.54
0.40
Strategy Date
Symbol
Strategy
Status
02-05-2016
NIFTY
Long Strangle
Active
2
Technical & Derivatives Report
May 09, 2016
FII Statistics for 06-May 2016
Turnover on 06-May 2016
Open Interest
No. of
Turnover
Change
Detail
Buy
Sell
Net
Instrument
Value
Contracts
( in Cr. )
(%)
Contracts
Change (%)
(in Cr.)
INDEX
INDEX
776.25
1765.32
(989.07)
236196
13391.94
(2.03)
228642
12573.15
-23.40
FUTURES
FUTURES
INDEX
INDEX
20291.18
20404.25
(113.07)
1018091
58571.63
4.19
2332850
134951.18
-2.56
OPTIONS
OPTIONS
STOCK
3716.86
3632.12
84.73
991668
47145.43
0.91
STOCK
FUTURES
457961
21989.93
-20.25
FUTURES
STOCK
STOCK
1868.74
1908.84
(40.10)
58322
2793.52
10.53
OPTIONS
248050
11956.22
-19.89
OPTIONS
TOTAL
26653.02
27710.53
(1057.51)
2304277
121902.52
2.24
TOTAL
3267503
181470.48
-8.07
Nifty Spot = 7733.45
Lot Size = 75
Bull-Call Spreads
Bear-Put Spreads
Action
Strike
Price
Risk
Reward
BEP
Action
Strike
Price
Risk
Reward
BEP
Buy
7800
89.00
Buy
7700
85.60
38.15
61.85
7838.15
30.30
69.70
7669.70
Sell
7900
50.85
Sell
7600
55.30
Buy
7800
89.00
Buy
7700
85.60
61.20
138.80
7861.20
50.40
149.60
7649.60
Sell
8000
27.80
Sell
7500
35.20
Buy
7900
50.85
Buy
7600
55.30
23.05
76.95
7923.05
20.10
79.90
7579.90
Sell
8000
27.80
Sell
7500
35.20
Note: Above mentioned Bullish or Bearish Spreads in Nifty (May Series) are given as an information and not as a recommendation.
Nifty Put-Call Analysis
3
Technical & Derivatives Report
May 09, 2016
Daily Pivot Levels for Nifty Constituents
Scrips
S2
S1
PIVOT
R1
R2
ACC
1,363
1,394
1,420
1,451
1,476
ADANIPORTS
186
190
195
199
204
AMBUJACEM
213
217
219
222
224
ASIANPAINT
852
870
880
899
909
AUROPHARMA
788
794
801
807
813
AXISBANK
456
459
462
464
467
BAJAJ-AUTO
2,416
2,426
2,440
2,449
2,463
BANKBARODA
147
149
151
153
155
BHEL
118
122
125
129
132
BPCL
920
930
937
947
955
BHARTIARTL
349
354
359
364
369
INFRATEL
364
367
371
374
378
BOSCH
18,812
18,970
19,122
19,280
19,432
CIPLA
531
534
538
542
546
COALINDIA
276
279
281
284
286
DRREDDY
2,822
2,844
2,882
2,904
2,942
EICHERMOT
19,333
19,774
20,062
20,503
20,791
GAIL
353
368
378
393
402
GRASIM
4,059
4,086
4,108
4,134
4,156
HCLTECH
714
718
726
730
737
HDFCBANK
1,108
1,114
1,123
1,129
1,138
HDFC
1,139
1,153
1,164
1,178
1,188
HEROMOTOCO
2,787
2,839
2,872
2,923
2,957
HINDALCO
88
90
91
93
94
HINDUNILVR
842
848
852
858
862
ICICIBANK
210
214
217
222
224
IDEA
111
113
114
115
116
INDUSINDBK
1,018
1,030
1,037
1,049
1,056
INFY
1,170
1,176
1,183
1,189
1,196
ITC
301
309
314
323
328
KOTAKBANK
689
696
703
710
717
LT
1,244
1,252
1,262
1,271
1,281
LUPIN
1,561
1,574
1,592
1,605
1,622
M&M
1,296
1,314
1,324
1,341
1,351
MARUTI
3,786
3,802
3,819
3,835
3,852
NTPC
137
138
139
141
142
ONGC
205
207
209
210
212
POWERGRID
139
141
142
144
145
RELIANCE
961
965
971
975
981
SBIN
178
181
183
186
188
SUNPHARMA
794
799
807
812
820
TCS
2,410
2,442
2,463
2,495
2,516
TATAMTRDVR
275
281
284
290
294
TATAMOTORS
378
389
395
405
411
TATAPOWER
69
71
72
73
74
TATASTEEL
322
326
329
332
335
TECHM
466
469
474
478
483
ULTRACEMCO
3,028
3,064
3,098
3,134
3,168
WIPRO
522
528
537
543
552
YESBANK
898
904
912
918
926
ZEEL
395
399
402
406
410
4
Technical & Derivatives Report
May 09, 2016
Research Team Tel: 022 - 39357800
For Technical Queries
For Derivatives Queries
DISCLAIMER
Angel Broking Private Limited (hereinafter referred to as “Angel”) is a registered Member of National Stock Exchange of India Limited,
Bombay Stock Exchange Limited and MCX Stock Exchange Limited. It is also registered as a Depository Participant with CDSL and
Portfolio Manager with SEBI. It also has registration with AMFI as a Mutual Fund Distributor. Angel Broking Private Limited is a
registered entity with SEBI for Research Analyst in terms of SEBI (Research Analyst) Regulations, 2014 vide registration number
INH000000164. Angel or its associates has not been debarred/ suspended by SEBI or any other regulatory authority for accessing
/dealing in securities Market. Angel or its associates including its relatives/analyst do not hold any financial interest/beneficial
ownership of more than 1% in the company covered by Analyst. Angel or its associates/analyst has not received any compensation /
managed or co-managed public offering of securities of the company covered by Analyst during the past twelve months. Angel/analyst
has not served as an officer, director or employee of company covered by Analyst and has not been engaged in market making activity
of the company covered by Analyst.
This document is solely for the personal information of the recipient, and must not be singularly used as the basis of any investment
decision. Nothing in this document should be construed as investment or financial advice. Each recipient of this document should
make such investigations as they deem necessary to arrive at an independent evaluation of an investment in the securities of the
companies referred to in this document (including the merits and risks involved), and should consult their own advisors to determine
the merits and risks of such an investment.
Reports based on technical and derivative analysis center on studying charts of a stock's price movement, outstanding positions and
trading volume, as opposed to focusing on a company's fundamentals and, as such, may not match with a report on a company's
fundamentals.
The information in this document has been printed on the basis of publicly available information, internal data and other reliable
sources believed to be true, but we do not represent that it is accurate or complete and it should not be relied on as such, as this
document is for general guidance only. Angel Broking Pvt. Limited or any of its affiliates/ group companies shall not be in any way
responsible for any loss or damage that may arise to any person from any inadvertent error in the information contained in this report.
Angel Broking Pvt. Limited has not independently verified all the information contained within this document. Accordingly, we cannot
testify, nor make any representation or warranty, express or implied, to the accuracy, contents or data contained within this document.
While Angel Broking Pvt. Limited endeavors to update on a reasonable basis the information discussed in this material, there may be
regulatory, compliance, or other reasons that prevent us from doing so.
This document is being supplied to you solely for your information, and its contents, information or data may not be reproduced,
redistributed or passed on, directly or indirectly.
Neither Angel Broking Pvt. Limited, nor its directors, employees or affiliates shall be liable for any loss or damage that may arise from
or in connection with the use of this information.
Note: Please refer to the important ‘Stock Holding Disclosure' report on the Angel website (Research Section). Also, please refer to the
latest update on respective stocks for the disclosure status in respect of those stocks. Angel Broking Pvt. Limited and its affiliates may
have investment positions in the stocks recommended in this report.
5