Technical & Derivatives Report
March 09, 2016
Sensex (24659) / Nifty (7485)
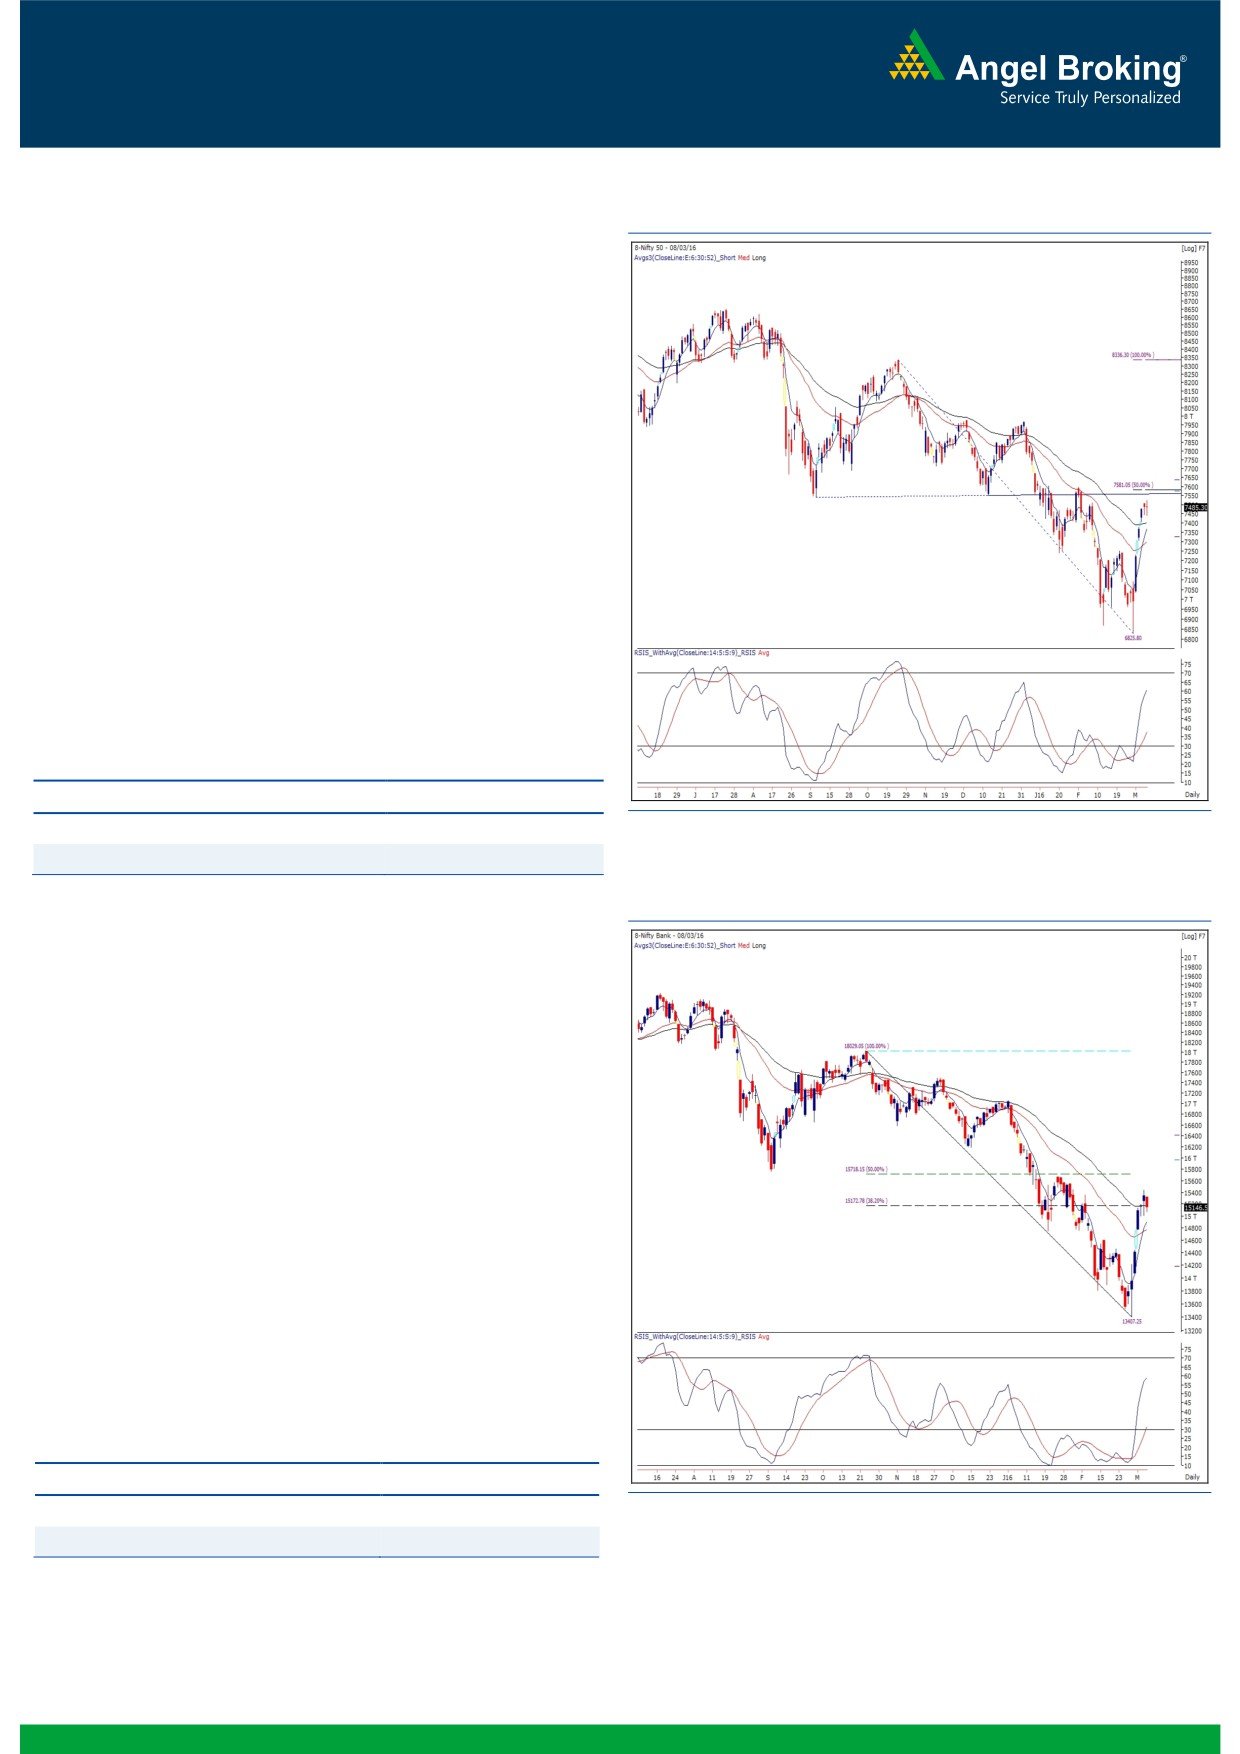
Exhibit 1: Nifty Daily Chart
After a long weekend, our market opened on a flat note in
yesterday’s session and started moving higher from initial
trades. But, post the positive momentum in initial hour of
trade, we witnessed a decent correction in Nifty. However, due
to some recovery towards the fag end, Nifty trimmed off its
intraday losses and closed on a flat note.
Yesterday, the Nifty had formed a ‘Doji’ candle near its
resistance of 7550 (previous breakdown level) on the daily
chart, which coincides with the
‘89 DEMA’ and
50%
retracement level of the previous down move from 8336.30 to
6825.80. The formation of ‘Doji’ candle around resistance
zone indicates indecision amongst traders. A follow-up closing
below 7442 may result into a minor pull back in the Nifty. But,
we advise traders to not short this market and remain light on
positions. Going forward, immediate resistance for index is
placed at 7550 - 7600 levels; whereas, support is visible at
7442 and 7390 levels.
Key Levels
Support 1 - 7442
Resistance 1 - 7550
Support 2 - 7390
Resistance 2 -
7600
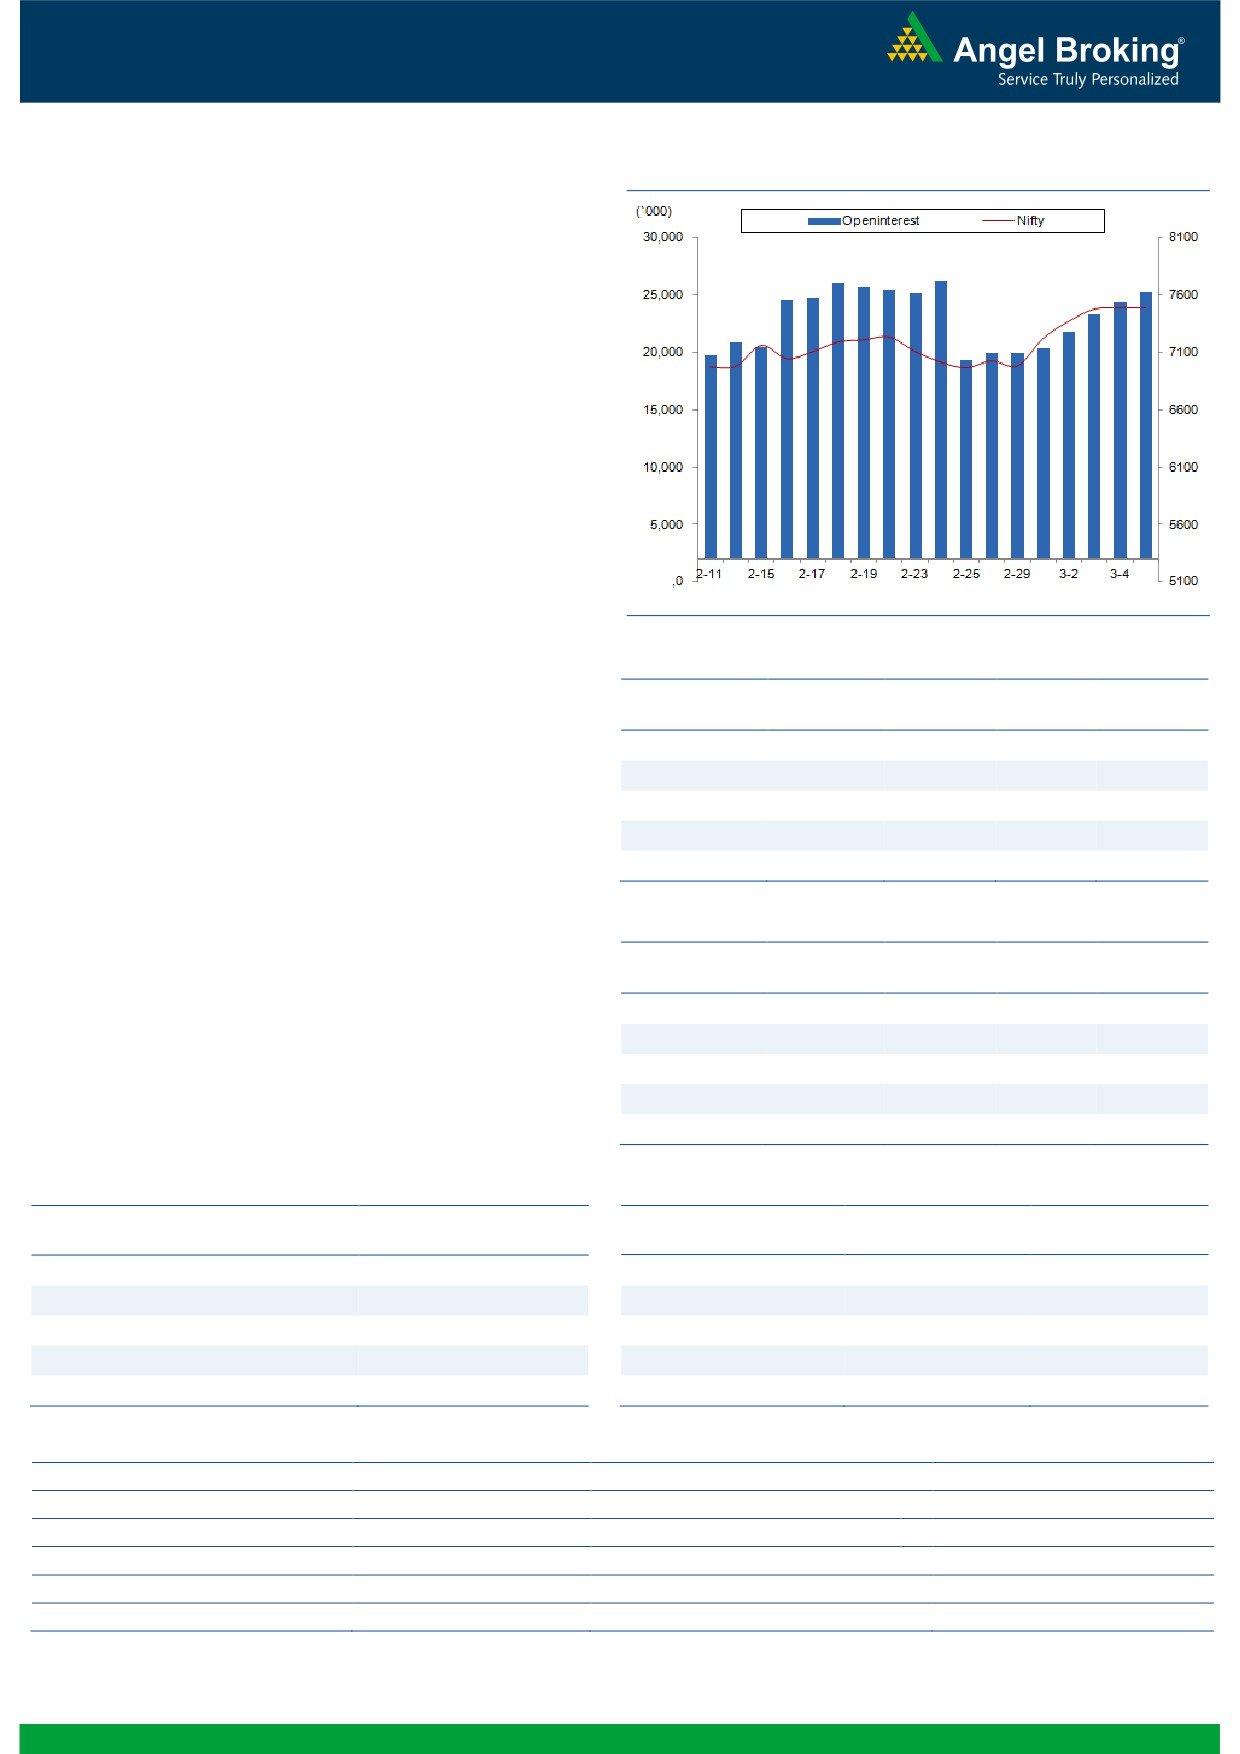
Exhibit 2: Nifty Bank Daily Chart
Nifty Bank Outlook - (15147)
In yesterday's trading session, the Nifty Bank index traded with
negative bias and ended the day with losses of 1.26%, led by
the PSU banks.
Since last two trading sessions, the index has traded in a
range with alternate bouts of buying and selling seen in
stocks. Yet, there are no reversal signs and thus the short term
trend continues to remain positive. The recent gap area of
14767-14445 is likely to provide support to the index on any
corrective action; whereas the near term resistance is seen
around 15680 - 15765 which is the previous resistance and
89EMA on daily charts. Traders with long positions in the
index should look to book profits around the mentioned
resistance zone and should trail the stop loss below the lower
end of the mentioned gap area. The intraday support for the
index is placed around 15005 and 14767 whereas resistances
are seen around 15225 and 15680.
Key Levels
Support 1 - 15005
Resistance 1 - 15225
Support 2 - 14767
Resistance 2 - 15680
1
Technical & Derivatives Report
March 09, 2016
Comments
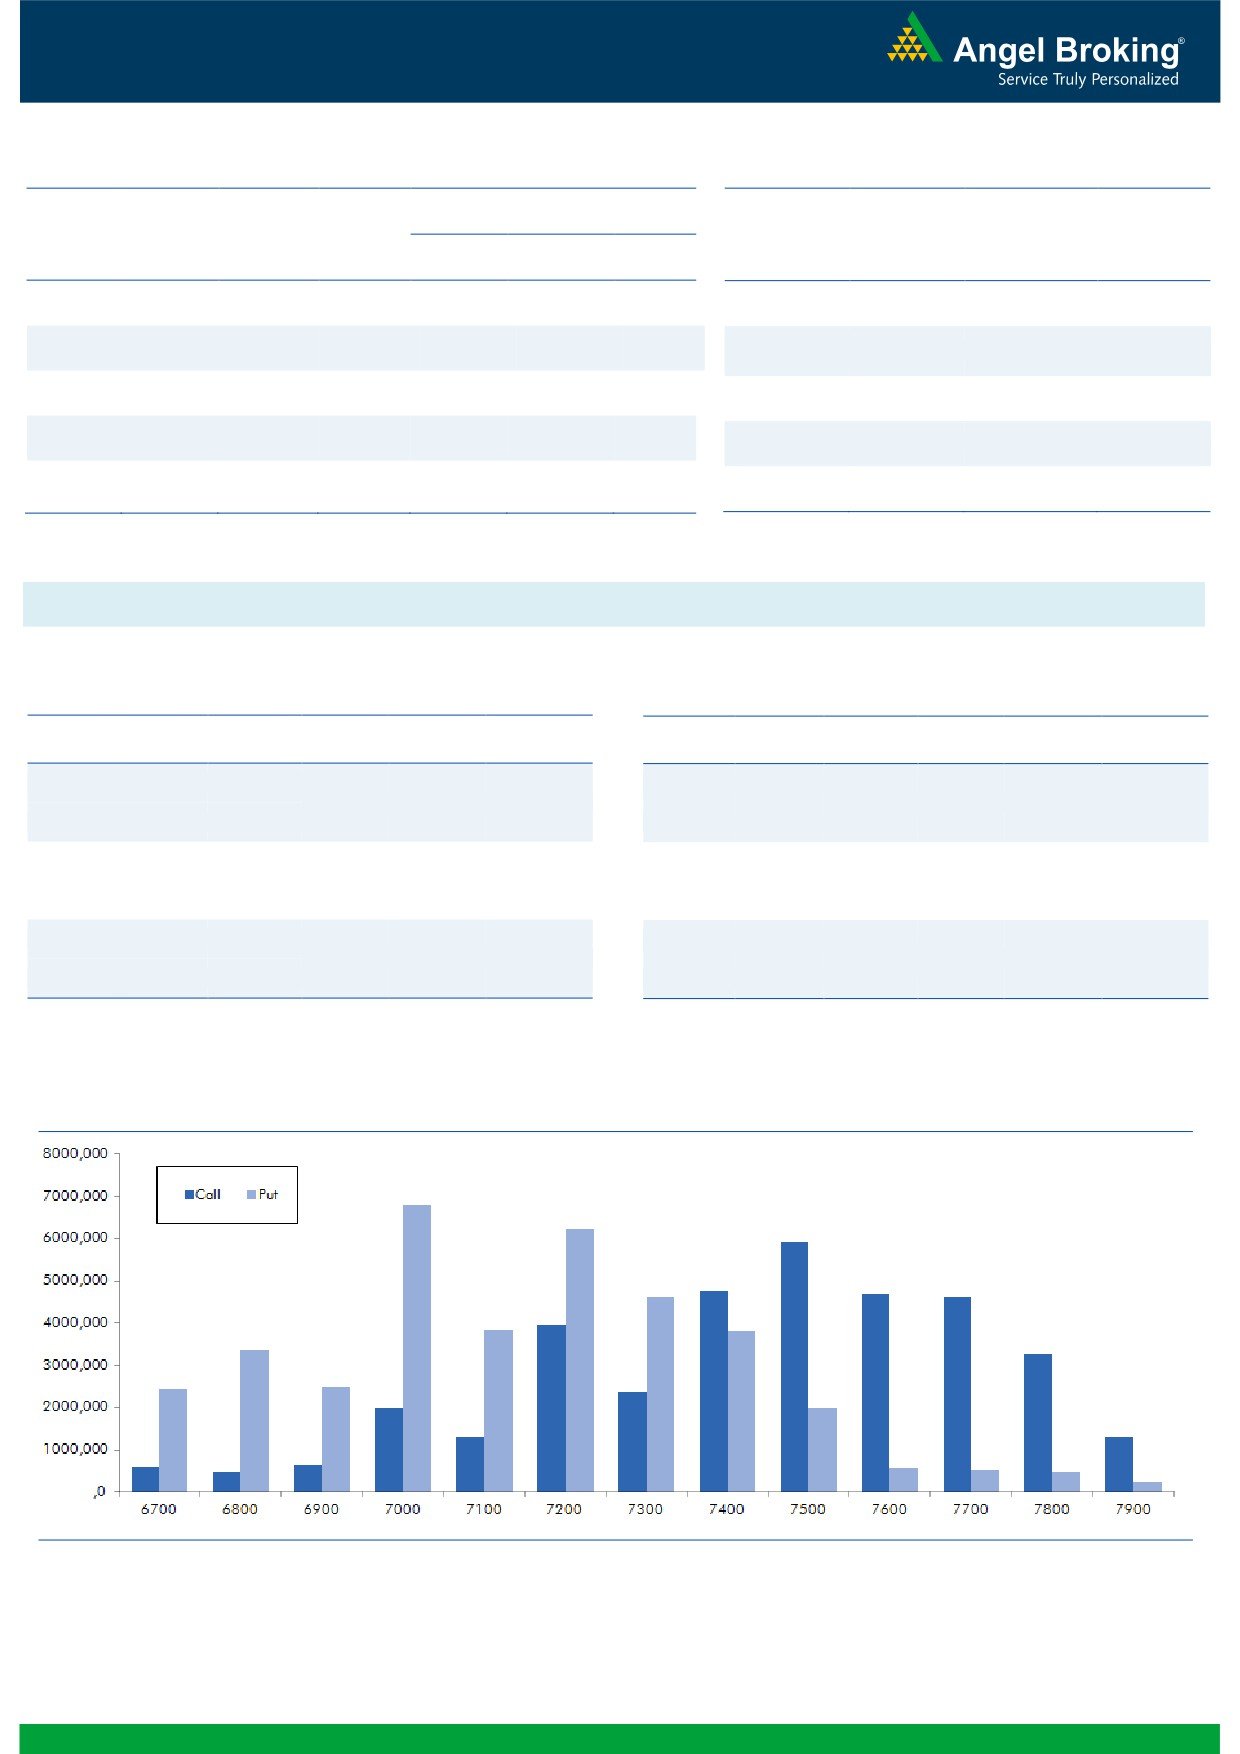
Nifty Vs OI
The Nifty futures open interest has increased by 3.74%
BankNifty futures open interest has decreased by 1.51%
as market closed at 7485.30 levels.
The Nifty March future closed at a discount of 32.65
points against a discount of 25.00 points. The April
series closed at a discount of 3.10 points.
The Implied Volatility of at the money options has
increased from 15.19% to 16.12%.
The total OI of the market is Rs. 2,16,063/- cr. and the
stock futures OI is Rs. 56,270/- cr.
Few of the liquid counters where we have seen high cost
of carry are JPASSOCIAT, JISLJALEQS, IFCI, GMRINFRA
and FEDERALBNK.
OI Gainers
Views
OI
PRICE
FIIs continue buying in both cash and F&O segment.
SCRIP
OI
PRICE
CHG. (%)
CHG. (%)
They bought equities to the tune of Rs. 775 crores. While
MINDTREE
1855200
22.18
1472.85
-0.94
in Index Futures, they were net buyers of Rs. 803 crores
HINDZINC
3052800
19.10
175.25
0.95
with decent rise in OI, suggesting fresh long formation in
NMDC
11130000
16.91
95.10
6.49
last trading session.
OIL
1122000
16.58
309.15
0.18
In Index Options front, FIIs sold of worth Rs. 567 crores
MCDOWELL-N
548000
12.76
2452.65
0.20
with marginal change in OI. In call options, we hardly
saw any meaningful activity. Whereas, in put options,
OI Losers
7200 strike was active and it also added some fresh
OI
PRICE
build-up. Maximum OI in current series is visible in 7500
SCRIP
OI
PRICE
CHG. (%)
CHG. (%)
call and 7000 put options. Seeing the quantum of buying
UNIONBANK
10641000
-15.59
126.25
0.16
in equities & Index Futures from past few trading
BHEL
26228000
-9.75
105.90
-1.49
sessions, we believe Nifty may continue to show strength.
GODREJIND
1756300
-8.41
321.10
1.63
Trade with a positive bias.
IBULHSGFIN
8557600
-7.86
650.90
-2.02
CUMMINSIND
45000
-7.41
864.35
-0.21
Historical Volatility
Put-Call Ratio
SCRIP
HV
SCRIP
PCR-OI
PCR-VOL
UNITECH
107.34
NIFTY
0.99
0.98
SAIL
67.74
BANKNIFTY
1.12
0.82
COLPAL
25.34
SBIN
0.84
0.49
JUSTDIAL
157.17
ICICIBANK
0.89
0.72
CAIRN
66.59
MARUTI
0.89
0.99
Strategy Date
Symbol
Strategy
Status
February 29, 2016
RELIANCE
Ratio Bull Call Spread
Active
March 05, 2016
BHEL
Long Call Ladder
Active
2
Technical & Derivatives Report
March 09, 2016
FII Statistics for 08-March 2016
Turnover on 08-March 2016
Open Interest
No. of
Turnover
Change
Detail
Buy
Sell
Net
Instrument
Value
Change
Contracts
( in Cr. )
(%)
Contracts
(in Cr.)
(%)
INDEX
INDEX
1835.81
1032.41
803.41
294380
15959.38
6.14
264912
13707.58
-15.45
FUTURES
FUTURES
INDEX
INDEX
25235.54
25802.58
(567.04)
1269583
70424.59
0.09
2740550
150309.76
-5.89
OPTIONS
OPTIONS
STOCK
4151.64
3802.60
349.04
1059140
47517.11
(1.49)
STOCK
FUTURES
536349
24200.80
-8.82
FUTURES
STOCK
STOCK
2030.88
2014.96
15.92
62924
2800.88
7.34
OPTIONS
267243
12206.80
-11.08
OPTIONS
TOTAL
33253.87
32652.54
601.33
2686027
136701.95
0.24
TOTAL
3809054
200424.94
-7.29
Nifty Spot = 7485.30
Lot Size = 75
Bull-Call Spreads
Bear-Put Spreads
Action
Strike
Price
Risk
Reward
BEP
Action
Strike
Price
Risk
Reward
BEP
Buy
7500
97.00
Buy
7400
102.20
41.90
58.10
7541.90
30.60
69.40
7369.40
Sell
7600
55.10
Sell
7300
71.60
Buy
7500
97.00
Buy
7400
102.20
68.55
131.45
7568.55
52.10
147.90
7347.90
Sell
7700
28.45
Sell
7200
50.10
Buy
7600
55.10
Buy
7300
71.60
26.65
73.35
7626.65
21.50
78.50
7278.50
Sell
7700
28.45
Sell
7200
50.10
Note: Above mentioned Bullish or Bearish Spreads in Nifty (March Series) are given as an information and not as a recommendation.
Nifty Put-Call Analysis
3
Technical & Derivatives Report
March 09, 2016
Daily Pivot Levels for Nifty 50 Stocks
Scrips
S2
S1
PIVOT
R1
R2
ACC
1,219
1,230
1,242
1,254
1,266
ADANIPORTS
218
223
227
233
237
AMBUJACEM
197
199
202
204
207
ASIANPAINT
848
862
872
886
896
AXISBANK
400
406
415
420
429
BAJAJ-AUTO
2,276
2,301
2,320
2,345
2,364
BANKBARODA
136
139
143
146
150
BHEL
101
103
107
110
114
BPCL
794
807
821
835
848
BHARTIARTL
324
328
331
335
338
BOSCHLTD
16,961
17,201
17,376
17,616
17,790
CAIRN
128
132
136
140
143
CIPLA
516
524
537
545
558
COALINDIA
316
320
326
331
337
DRREDDY
3,144
3,182
3,226
3,264
3,308
GAIL
332
341
347
356
362
GRASIM
3,479
3,504
3,526
3,551
3,573
HCLTECH
796
806
819
828
841
HDFCBANK
1,001
1,008
1,016
1,022
1,030
HDFC
1,107
1,127
1,139
1,159
1,171
HEROMOTOCO
2,777
2,793
2,817
2,833
2,856
HINDALCO
78
81
82
85
87
HINDUNILVR
809
818
833
842
857
ICICIBANK
211
214
217
220
223
IDEA
103
105
106
107
108
INDUSINDBK
894
908
918
931
941
INFY
1,124
1,144
1,167
1,187
1,210
ITC
312
316
320
324
328
KOTAKBANK
637
644
655
662
673
LT
1,152
1,170
1,191
1,209
1,230
LUPIN
1,732
1,778
1,807
1,853
1,881
M&M
1,204
1,212
1,223
1,231
1,242
MARUTI
3,356
3,409
3,504
3,558
3,652
NTPC
123
125
127
129
130
ONGC
198
200
203
205
208
POWERGRID
134
136
138
140
141
PNB
80
81
82
83
84
RELIANCE
998
1,013
1,022
1,036
1,045
SBIN
178
181
184
186
189
SUNPHARMA
841
850
860
869
880
TCS
2,279
2,317
2,342
2,379
2,405
TATAMOTORS
335
340
347
353
359
TATAPOWER
58
58
59
60
60
TATASTEEL
282
287
292
297
302
TECHM
437
443
451
457
466
ULTRACEMCO
2,892
2,921
2,938
2,967
2,984
VEDL
86
88
90
92
95
WIPRO
530
536
540
545
549
YESBANK
742
751
760
769
778
ZEEL
375
383
392
400
409
4
Technical & Derivatives Report
March 09, 2016
Research Team Tel: 022 - 39357800
For Technical Queries
For Derivatives Queries
DISCLAIMER
Angel Broking Private Limited (hereinafter referred to as “Angel”) is a registered Member of National Stock Exchange of India Limited,
Bombay Stock Exchange Limited and MCX Stock Exchange Limited. It is also registered as a Depository Participant with CDSL and
Portfolio Manager with SEBI. It also has registration with AMFI as a Mutual Fund Distributor. Angel Broking Private Limited is a
registered entity with SEBI for Research Analyst in terms of SEBI (Research Analyst) Regulations, 2014 vide registration number
INH000000164. Angel or its associates has not been debarred/ suspended by SEBI or any other regulatory authority for accessing
/dealing in securities Market. Angel or its associates including its relatives/analyst do not hold any financial interest/beneficial
ownership of more than 1% in the company covered by Analyst. Angel or its associates/analyst has not received any compensation /
managed or co-managed public offering of securities of the company covered by Analyst during the past twelve months. Angel/analyst
has not served as an officer, director or employee of company covered by Analyst and has not been engaged in market making activity
of the company covered by Analyst.
This document is solely for the personal information of the recipient, and must not be singularly used as the basis of any investment
decision. Nothing in this document should be construed as investment or financial advice. Each recipient of this document should
make such investigations as they deem necessary to arrive at an independent evaluation of an investment in the securities of the
companies referred to in this document (including the merits and risks involved), and should consult their own advisors to determine
the merits and risks of such an investment.
Reports based on technical and derivative analysis center on studying charts of a stock's price movement, outstanding positions and
trading volume, as opposed to focusing on a company's fundamentals and, as such, may not match with a report on a company's
fundamentals.
The information in this document has been printed on the basis of publicly available information, internal data and other reliable
sources believed to be true, but we do not represent that it is accurate or complete and it should not be relied on as such, as this
document is for general guidance only. Angel Broking Pvt. Limited or any of its affiliates/ group companies shall not be in any way
responsible for any loss or damage that may arise to any person from any inadvertent error in the information contained in this report.
Angel Broking Pvt. Limited has not independently verified all the information contained within this document. Accordingly, we cannot
testify, nor make any representation or warranty, express or implied, to the accuracy, contents or data contained within this document.
While Angel Broking Pvt. Limited endeavors to update on a reasonable basis the information discussed in this material, there may be
regulatory, compliance, or other reasons that prevent us from doing so.
This document is being supplied to you solely for your information, and its contents, information or data may not be reproduced,
redistributed or passed on, directly or indirectly.
Neither Angel Broking Pvt. Limited, nor its directors, employees or affiliates shall be liable for any loss or damage that may arise from
or in connection with the use of this information.
Note: Please refer to the important ‘Stock Holding Disclosure' report on the Angel website (Research Section). Also, please refer to the
latest update on respective stocks for the disclosure status in respect of those stocks. Angel Broking Pvt. Limited and its affiliates may
have investment positions in the stocks recommended in this report.
5