Technical & Derivatives Report
November 08, 2016
Sensex (27459) / Nifty (8497)
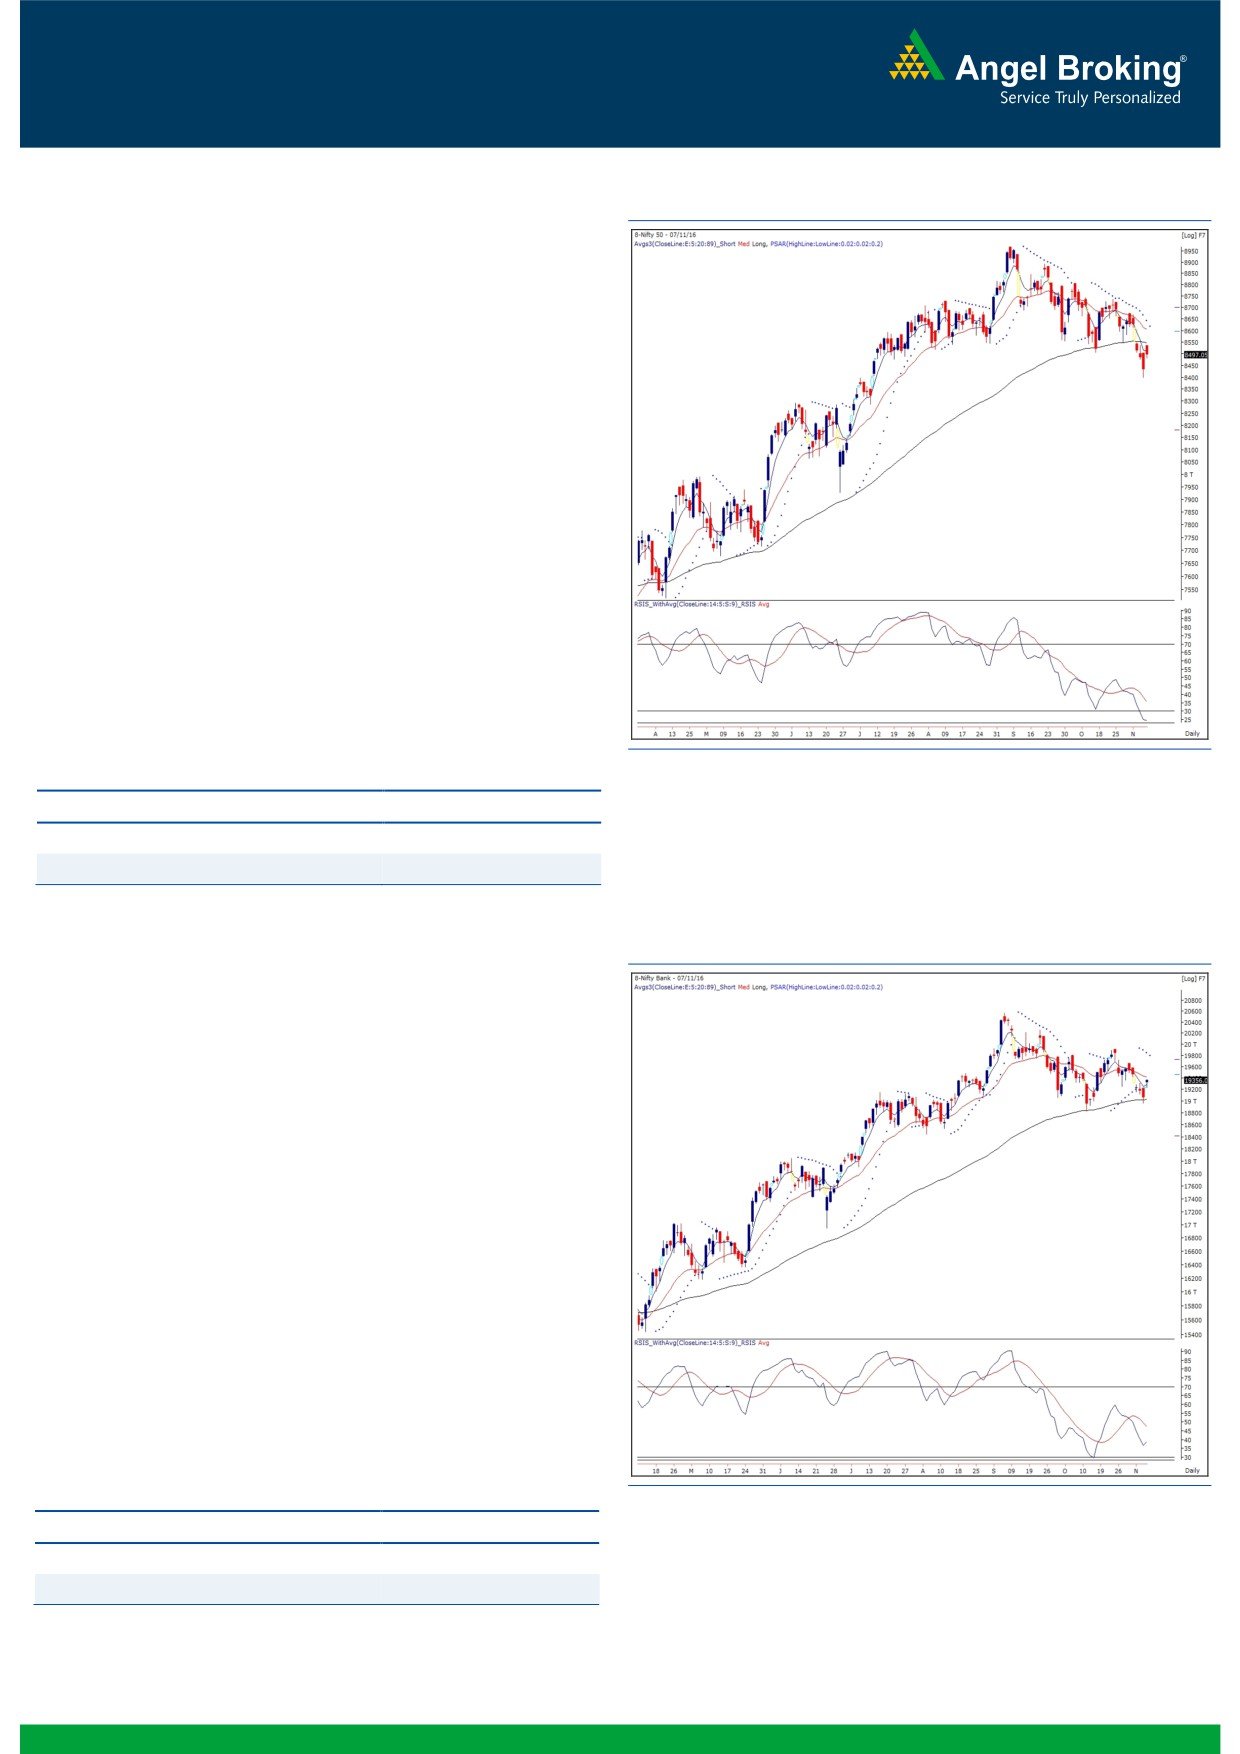
Exhibit 1: Nifty Daily Chart
Yesterday, our markets surprised most of the participants with a
huge 100 points gap up opening on Nifty. This was mainly on the
back of positive developments seen in U.S. over the weekend.
Although, this was not what we had expected to see considering
Friday’s close, we still maintained our cautious stance as there
was no follow up buying seen in the market. As a result, the Nifty
corrected a bit from highs to end the session tad below the 8500
mark.
Technically speaking, such gaps if not filled can indicate probable
reversal in the market; but, we saw this gap being filled and
hence, 8550 - 8600 has now become a strong and important
hurdle for the market. In fact, we will not be surprised to see
another leg of downward move in the forthcoming sessions. On
the lower side, 8475 - 8400 would be seen as intraday supports.
We continue to advise caution in the market and thus, traders
should not get carried away by yesterday’s gap up opening. It’s
advisable to stay light and avoid taking undue risks.
Key Levels
Support 1 - 8475
Resistance 1 - 8550
Support 2 - 8400
Resistance 2 - 8600
Exhibit 2: Nifty Bank Daily Chart
Nifty Bank Outlook - (19356)
Citing positive global cues, the Nifty Bank index too opened with
a gap up opening yesterday and ended the session with gains of
1.56 percent over its previous session's close.
The Nifty Bank index has pulled back higher from the '89 DEMA'
support which has now acted as support twice in last one month.
On the flipside, the lower top formation remains intact on the
daily chart. This indicates consolidation phase wherein the bulls
are trying to protect the support zone; whereas the bears are
showing their dominance on pullback rallies. Hence, until the
index either breaches the '89 DEMA' support or forms any bullish
structure; the consolidation is expected to continue. Traders are
thus advised to wait for some definite signs and avoid speculating
on the directional momentum. Traders can follow stock specific
moves and trade with proper risk management. The intraday
supports for the Nifty Bank index are placed around 19165 and
18960 whereas resistances are seen around 19420 and 19592.
Key Levels
Support 1 - 19165
Resistance 1 - 19420
Support 2 - 18960
Resistance 2 - 19592
1
Technical & Derivatives Report
November 08, 2016
Comments
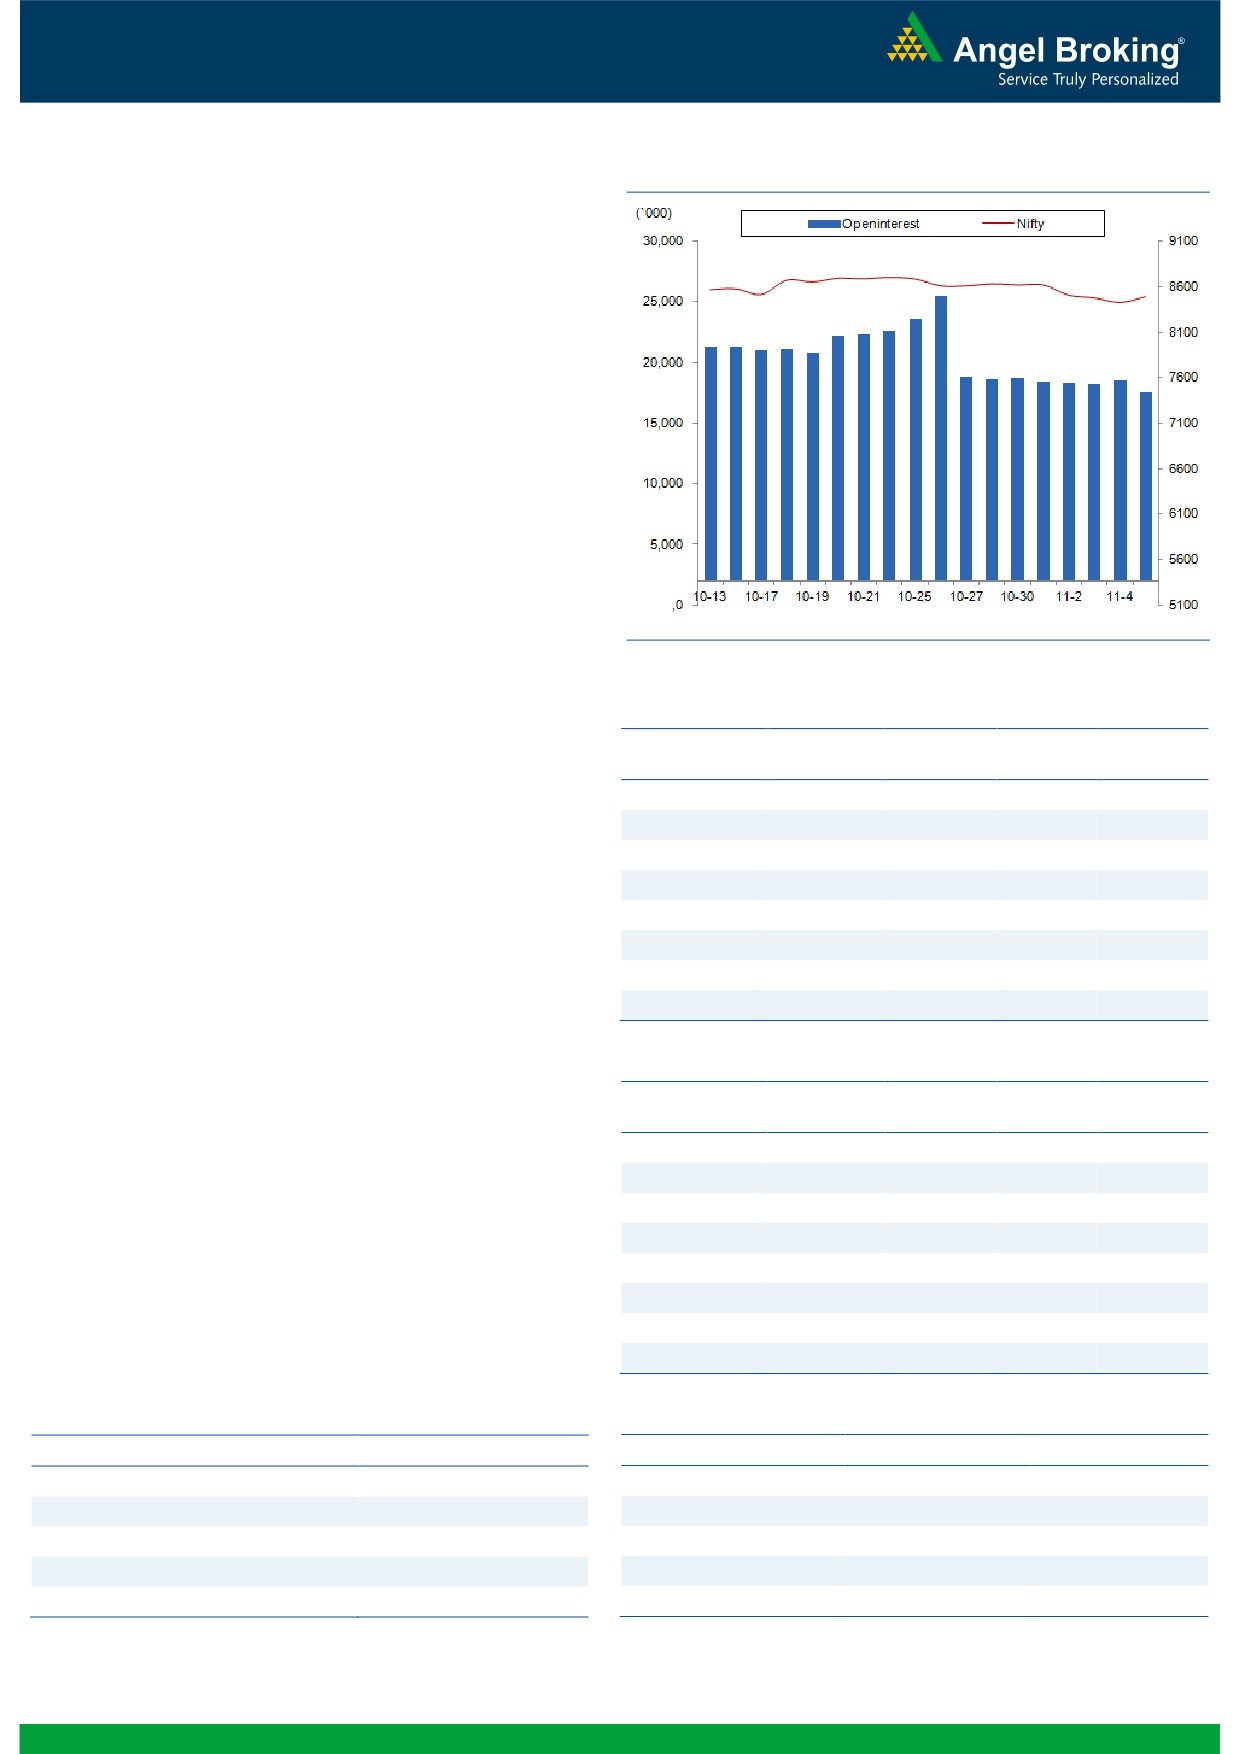
Nifty Vs OI
The Nifty futures open interest has decreased by 5.88%
BankNifty futures open interest has decreased by 7.13%
as market closed at 8497.05 levels.
The Nifty November future closed with a premium of
22.95 against the premium of 24.45 points in last
trading session. The December series closed at a
premium of 69.95 points.
The Implied Volatility of at the money options has
increased from 16.33% to 16.86%. At the same time, the
PCR-OI of Nifty has increased from 0.92 to 0.93 levels.
The total OI of the market is Rs. 2,45,517/- cr. and the
stock futures OI is Rs. 74,924/- cr.
Few of the liquid counters where we have seen high cost
of carry are ADANIPOWER, NIITTECH, GAIL, KTKBANK
and INDIACEM.
Views
OI Gainers
After long time, FIIs were net buyers in equity cash; they
OI
PRICE
SCRIP
OI
PRICE
CHG. (%)
CHG. (%)
bought equities worth Rs. 311 crores. While, in index
CROMPGREAV
10848000
26.61
85.90
12.21
futures, they were net seller to the tune of Rs. 236 crores
DABUR
9900000
13.11
296.45
-0.47
with significant fall in open interest, indicating blend of
NMDC
16158000
11.56
127.50
0.43
long unwinding and covering of short positions formedng.com
VOLTAS
3782000
8.00
360.55
-0.39
earlier.
FEDERALBNK
49181000
7.55
77.50
0.78
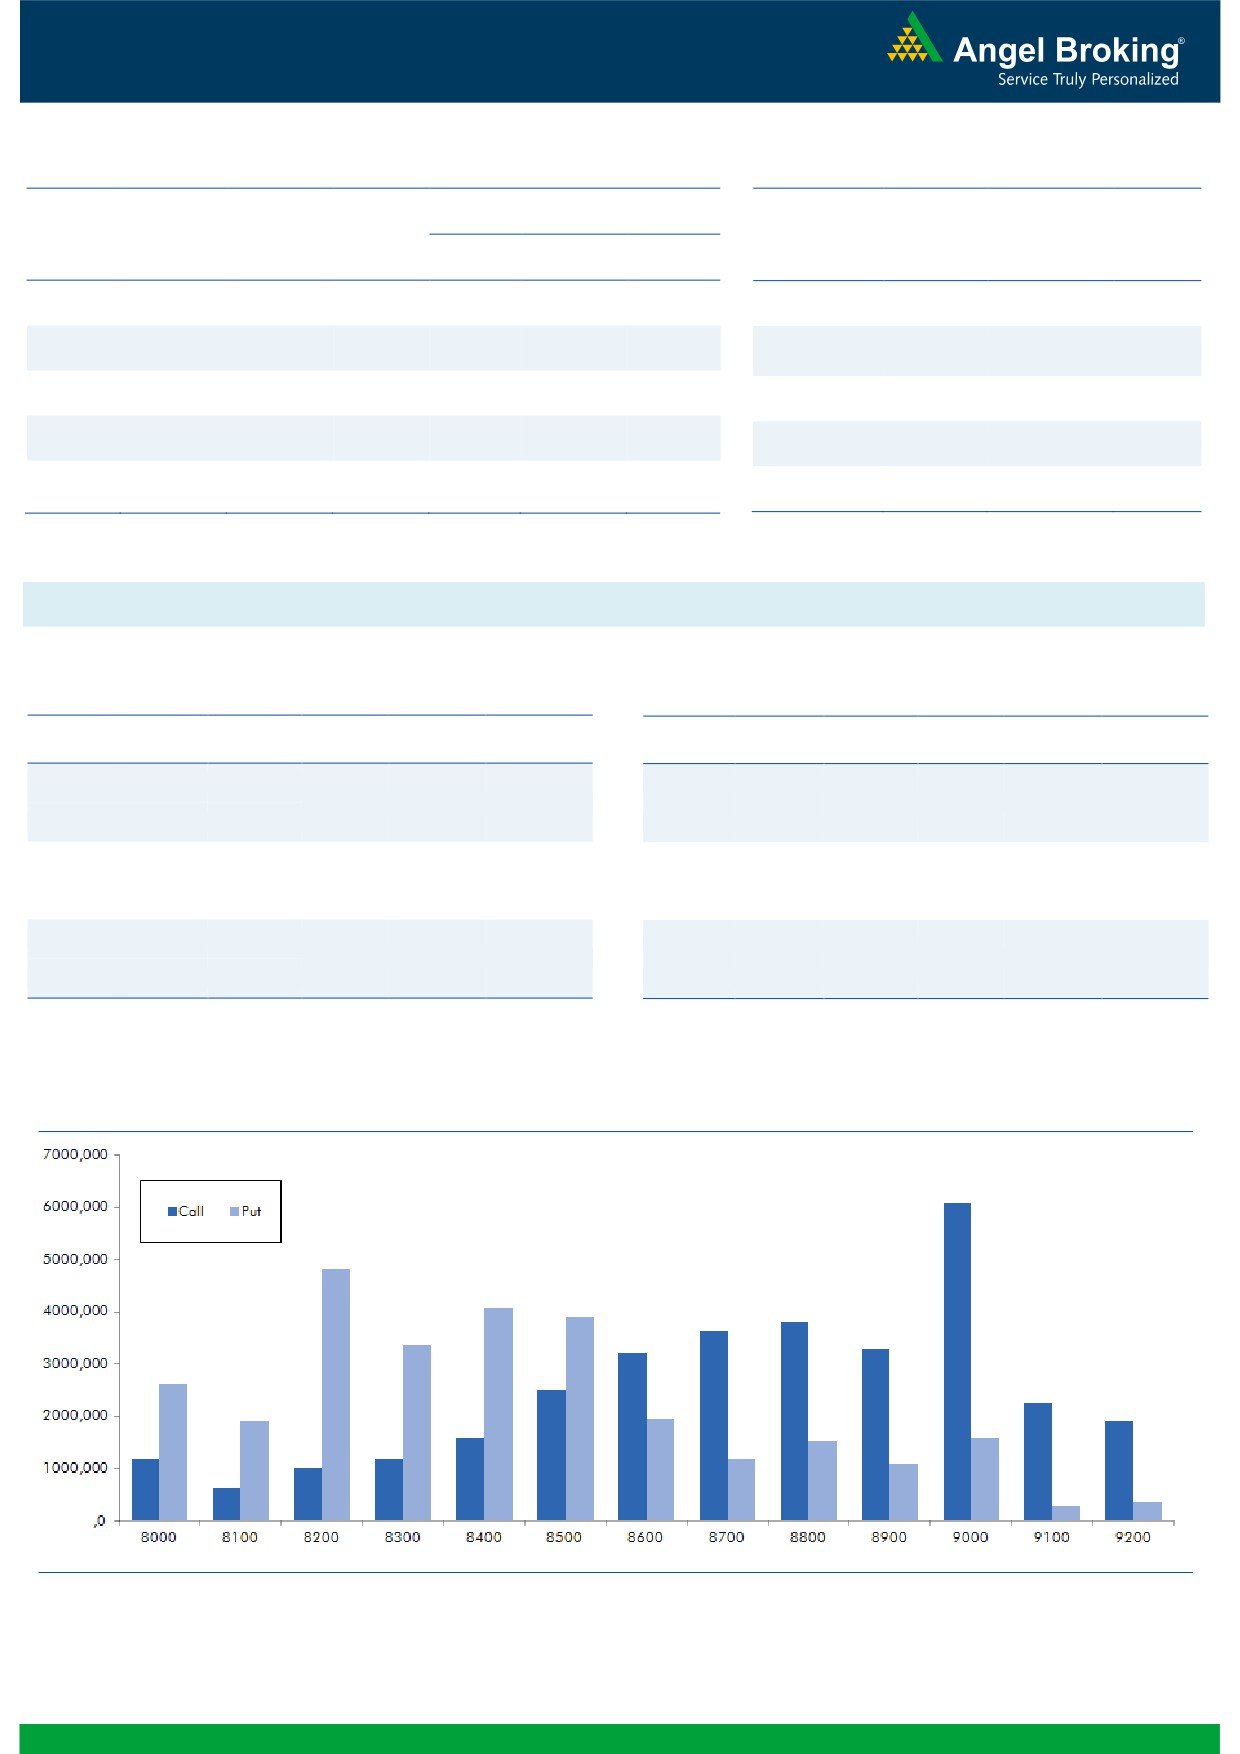
On Index Options front, FIIs sold of worth Rs. 344 crores
IDFCBANK
30464000
7.18
72.95
-0.07
with some rise in OI. We hardly saw any meaningful
AMARAJABAT
679200
6.39
1015.00
0.55
open interest additions in both call and put options of
GAIL
5893500
5.85
428.60
0.63
Nifty. However, 8800 call and 8500 put options were
comparatively active and they also added some fresh
positions. Maximum OI in November series is placed at
OI Losers
9000 call and 8200 put options.
OI
PRICE
SCRIP
OI
PRICE
CHG. (%)
CHG. (%)
Since past few trading sessions, we have been
LUPIN
6471800
-9.89
1520.45
6.90
continuously witnessing good amount of long unwinding
TORNTPHARM
440000
-9.24
1333.10
2.81
and some fresh short formation in Index Futures by
UBL
1550500
-9.00
895.35
1.94
stronger hands. They also bought good amount of put
GLENMARK
2494100
-7.77
896.40
2.93
options during these period. Looking at the above data,
BIOCON
4074000
-6.82
898.70
2.22
we believe market has limited upside. Traders should
SBIN
56646000
-5.90
253.60
3.98
avoid forming long positions in Nifty unless we see any
meaningful change in data.
HEROMOTOCO
1160200
-5.54
3360.70
2.12
CANBK
11082000
-5.35
299.55
3.01
Historical Volatility
Put-Call Ratio
SCRIP
HV
SCRIP
PCR-OI
PCR-VOL
CROMPGREAV
63.17
NIFTY
0.93
0.87
LUPIN
43.43
BANKNIFTY
1.26
0.76
PNB
55.12
RELIANCE
0.44
0.39
SBIN
34.60
SBIN
0.54
0.49
HINDALCO
50.18
AXISBANK
0.44
0.46
2
Technical & Derivatives Report
November 08, 2016
FII Statistics for November 07, 2016
Turnover on November 07, 2016
Open Interest
No. of
Turnover
Change
Detail
Buy
Sell
Net
Instrument
Value
Change
Contracts
( in Cr. )
(%)
Contracts
(in Cr.)
(%)
INDEX
INDEX
1452.56
1688.34
(235.79)
186160
12397.44
(9.62)
177867
12185.24
-28.38
FUTURES
FUTURES
INDEX
INDEX
21351.64
21695.36
(343.72)
979108
63738.45
0.87
2140663
148592.94
-26.46
OPTIONS
OPTIONS
STOCK
5997.04
5043.76
953.29
881997
55677.16
(0.68)
STOCK
FUTURES
452325
30846.51
-27.40
FUTURES
STOCK
STOCK
4082.91
4115.42
(32.52)
86309
5758.60
5.43
OPTIONS
317896
22336.99
-19.40
OPTIONS
TOTAL
32884.15
32542.88
341.27
2133574
137571.65
(0.60)
TOTAL
3088751
213961.68
-26.04
Nifty Spot = 8497.05
Lot Size = 75
Bull-Call Spreads
Bear-Put Spreads
Action
Strike
Price
Risk
Reward
BEP
Action
Strike
Price
Risk
Reward
BEP
Buy
8600
82.00
Buy
8500
113.45
35.85
64.15
8635.85
34.95
65.05
8465.05
Sell
8700
46.15
Sell
8400
78.50
Buy
8600
82.00
Buy
8500
113.45
58.50
141.50
8658.50
60.15
139.85
8439.85
Sell
8800
23.50
Sell
8300
53.30
Buy
8700
46.15
Buy
8400
78.50
22.65
77.35
8722.65
25.20
74.80
8374.80
Sell
8800
23.50
Sell
8300
53.30
Note: Above mentioned Bullish or Bearish Spreads in Nifty (November Series) are given as an information and not as a recommendation.
Nifty Put-Call Analysis
3
Technical & Derivatives Report
November 08, 2016
Daily Pivot Levels for Nifty Constituents
Scrips
S2
S1
PIVOT
R1
R2
ACC
1,462
1,475
1,496
1,509
1,530
ADANIPORTS
287
290
294
298
302
AMBUJACEM
237
239
243
246
250
ASIANPAINT
1,010
1,024
1,042
1,055
1,073
AUROPHARMA
739
753
765
779
791
AXISBANK
478
482
486
489
493
BAJAJ-AUTO
2,749
2,787
2,818
2,856
2,887
BANKBARODA
142
145
147
150
152
BHEL
134
137
139
141
143
BPCL
638
649
658
669
678
BHARTIARTL
299
302
307
310
315
INFRATEL
343
349
359
366
376
BOSCH
20,727
21,075
21,648
21,996
22,569
CIPLA
537
541
549
553
560
COALINDIA
314
316
319
322
325
DRREDDY
3,040
3,073
3,114
3,147
3,188
EICHERMOT
23,557
23,789
24,187
24,419
24,817
GAIL
418
422
426
430
434
GRASIM
898
908
919
929
939
HCLTECH
781
799
813
832
846
HDFCBANK
1,233
1,241
1,248
1,256
1,263
HDFC
1,357
1,369
1,386
1,398
1,414
HEROMOTOCO
3,218
3,288
3,335
3,406
3,453
HINDALCO
159
163
166
170
173
HINDUNILVR
824
831
841
848
859
ICICIBANK
269
274
277
282
286
IDEA
72
72
73
74
75
INDUSINDBK
1,199
1,207
1,218
1,227
1,237
INFY
969
973
980
984
991
ITC
242
249
254
262
267
KOTAKBANK
795
799
803
807
811
LT
1,368
1,383
1,407
1,422
1,447
LUPIN
1,468
1,493
1,514
1,539
1,560
M&M
1,358
1,368
1,381
1,391
1,403
MARUTI
5,659
5,688
5,736
5,765
5,813
NTPC
152
153
155
157
159
ONGC
262
264
269
272
277
POWERGRID
173
174
174
175
175
RELIANCE
988
995
1,006
1,012
1,023
SBIN
242
248
251
256
259
SUNPHARMA
638
646
662
670
686
TCS
2,209
2,243
2,294
2,328
2,379
TATAMTRDVR
317
322
332
337
347
TATAMOTORS
495
501
511
517
527
TATAPOWER
74
75
76
76
77
TATASTEEL
402
407
411
417
420
TECHM
423
434
442
453
461
ULTRACEMCO
3,833
3,871
3,908
3,946
3,983
WIPRO
444
447
451
454
458
YESBANK
1,187
1,197
1,214
1,225
1,242
ZEEL
496
502
509
515
522
4
Technical & Derivatives Report
November 08, 2016
Research Team Tel: 022 - 39357800
For Technical Queries
For Derivatives Queries
DISCLAIMER
Angel Broking Private Limited (hereinafter referred to as “Angel”) is a registered Member of National Stock Exchange of India Limited,
Bombay Stock Exchange Limited and Metropolitan Stock Exchange Limited. It is also registered as a Depository Participant with CDSL
and Portfolio Manager with SEBI. It also has registration with AMFI as a Mutual Fund Distributor. Angel Broking Private Limited is a
registered entity with SEBI for Research Analyst in terms of SEBI (Research Analyst) Regulations, 2014 vide registration number
INH000000164. Angel or its associates has not been debarred/ suspended by SEBI or any other regulatory authority for accessing
/dealing in securities Market. Angel or its associates/analyst has not received any compensation / managed or co-managed public
offering of securities of the company covered by Analyst during the past twelve months.
This document is solely for the personal information of the recipient, and must not be singularly used as the basis of any investment
decision. Nothing in this document should be construed as investment or financial advice. Each recipient of this document should
make such investigations as they deem necessary to arrive at an independent evaluation of an investment in the securities of the
companies referred to in this document (including the merits and risks involved), and should consult their own advisors to determine
the merits and risks of such an investment.
Reports based on technical and derivative analysis center on studying charts of a stock's price movement, outstanding positions and
trading volume, as opposed to focusing on a company's fundamentals and, as such, may not match with a report on a company's
fundamentals. Investors are advised to refer the Fundamental and Technical Research Reports available on our website to evaluate the
contrary view, if any.
The information in this document has been printed on the basis of publicly available information, internal data and other reliable
sources believed to be true, but we do not represent that it is accurate or complete and it should not be relied on as such, as this
document is for general guidance only. Angel Broking Pvt. Limited or any of its affiliates/ group companies shall not be in any way
responsible for any loss or damage that may arise to any person from any inadvertent error in the information contained in this report.
Angel Broking Pvt. Limited has not independently verified all the information contained within this document. Accordingly, we cannot
testify, nor make any representation or warranty, express or implied, to the accuracy, contents or data contained within this document.
While Angel Broking Pvt. Limited endeavors to update on a reasonable basis the information discussed in this material, there may be
regulatory, compliance, or other reasons that prevent us from doing so.
This document is being supplied to you solely for your information, and its contents, information or data may not be reproduced,
redistributed or passed on, directly or indirectly.
Neither Angel Broking Pvt. Limited, nor its directors, employees or affiliates shall be liable for any loss or damage that may arise from
or in connection with the use of this information.
5