Technical & Derivatives Report
August 08, 2016
Sensex (28078) / Nifty (8683)
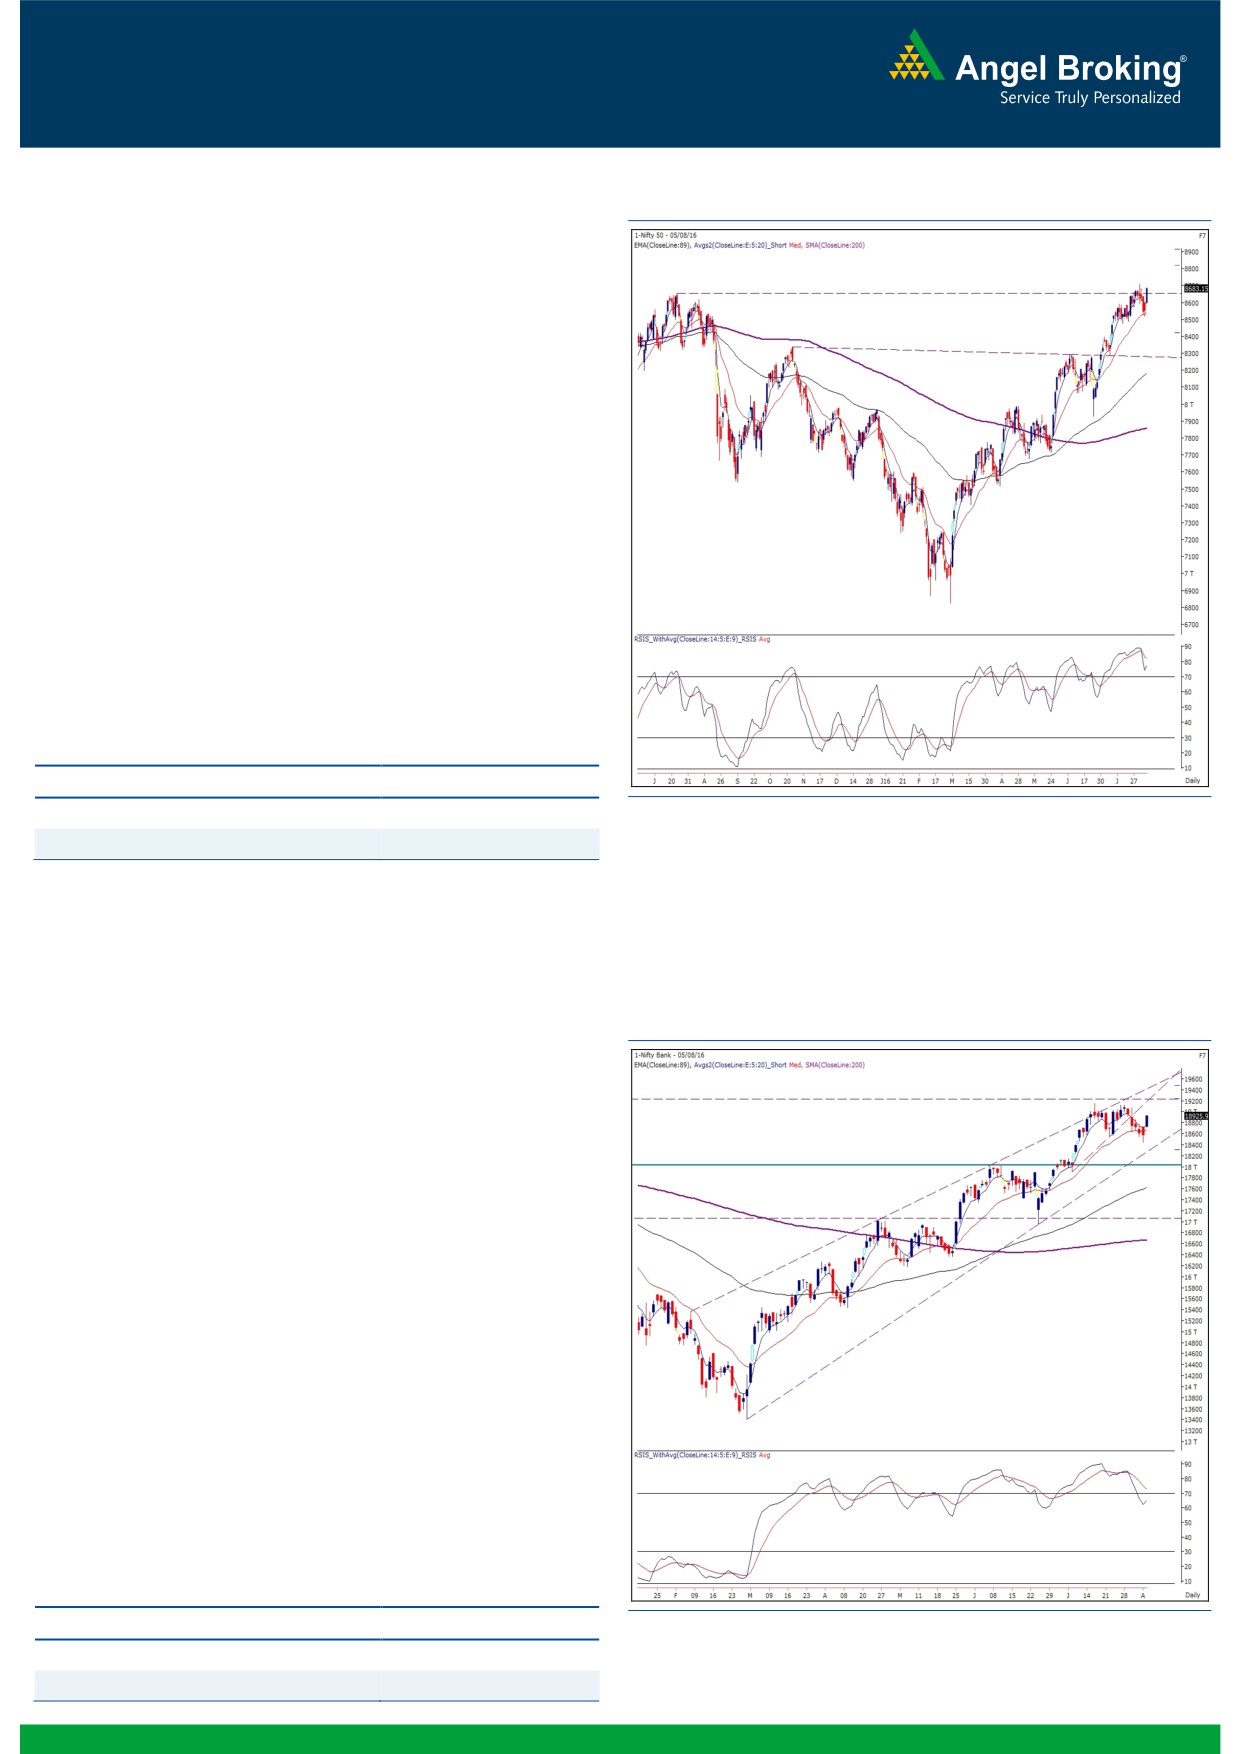
Exhibit 1: Nifty Daily Chart
The concluded week saw the Nifty witness a minor corrective
move after breaching the ‘Rising Wedge’ pattern. The index then
rebounded sharply after nearing the strong support zone of 8500
- 8480 levels. From a technical analysis perspective, we now
expect the index to slip into a consolidation mode and this would
make it difficult to find clear trades. From a larger degree view,
the trend remains bullish and we reiterate at the likelihood of the
Nifty reaching the next resistance zone of 8780 - 8830 quite
soon. In the forthcoming week, the Nifty would gain momentum
after surpassing 8711.30 convincingly; whereas, on the flipside,
8590 - 8518 would now be seen as important support levels.
Going forward, in case of the Nifty reaching our near term targets
of 8780 - 8830 (the ‘Super Trend’ indicator on Monthly chart is
placed at 8830), then we would advise traders to start lightening
up their longs as we may then see some pause in the bullish
momentum. Traders are further advised to shift their focus on
individual stocks following a proper exit strategy.
Key Levels
Support 1 - 8590
Resistance 1 - 8780
Support 2 - 8518
Resistance 2 - 8830
Nifty Bank Outlook - (18926)
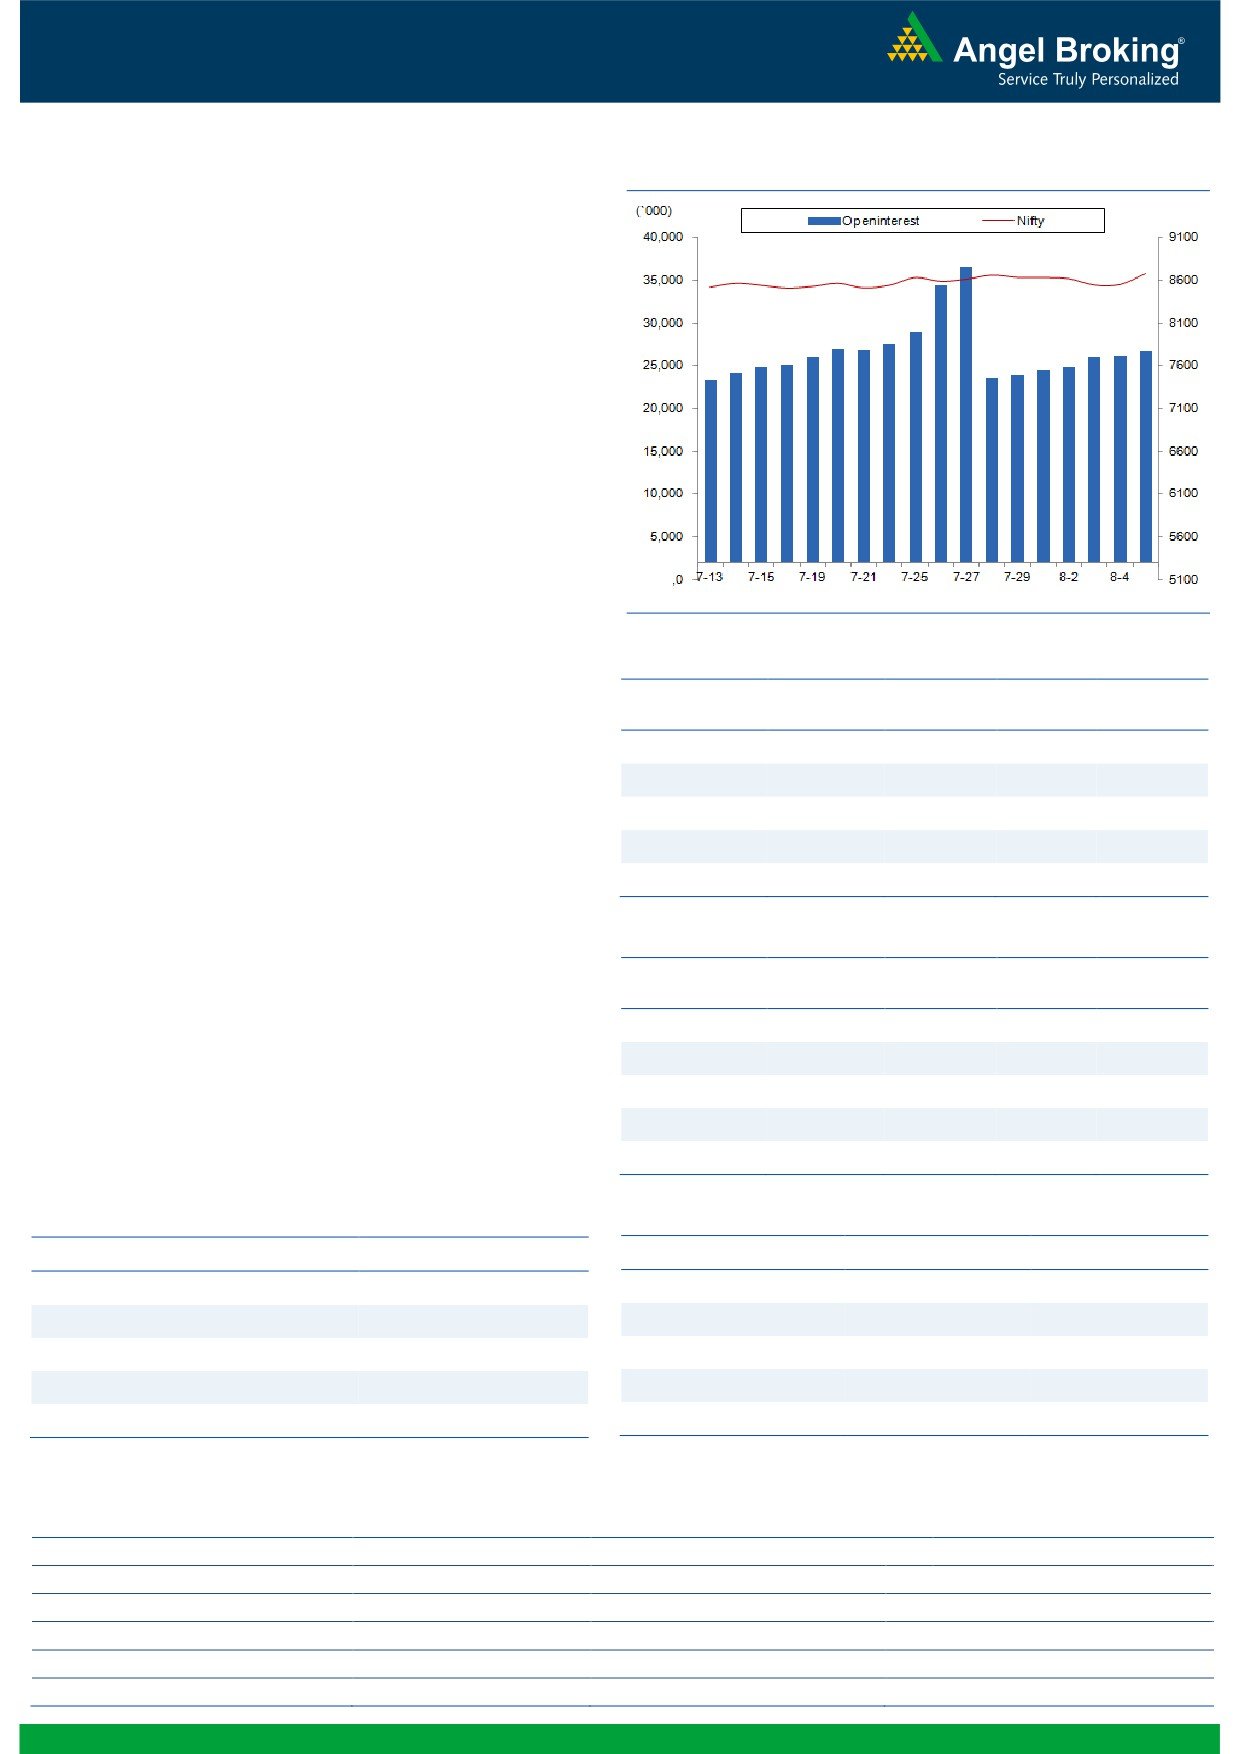
Exhibit 2: Nifty Bank Hourly Chart
In Friday's trading session, the Nifty Bank index opened gap up
and continued the positive momentum throughout the session. At
closing, the index gained 1.91 percent over its previous sessions
close. The Nifty PSU Bank index continued its outperformance and
gained 2.49 percent on Friday.
The Nifty Bank index had roller coaster ride last week wherein the
index corrected in four trading sessions and recovered smartly on
Friday to post weekly loss of just 0.14 percent. The highlight
during the week was the support level of 18450 which was the
'200 SMA' on hourly chart and 'SuperTrend' indicator support on
daily chart. The index resumed its uptrend from the mentioned
support and thus. we continue with our with our last week's advise
to avoid creating short positions. Traders should continue to trade
with the trend and on long positions, one should now revise stop
loss below last week's low of 18443.65. The intraday support for
the index are placed around
18773 and
18670 whereas
resistances are seen around 19127 and 19229.
Key Levels
Support 1 - 18773
Resistance 1 - 19127
Support 2 - 18670
Resistance 2 - 19229
1
Technical & Derivatives Report
August 08, 2016
Comments
Nifty Vs OI
The Nifty futures open interest has increased by 1.94%
BankNifty futures open interest has increased by 5.00%
as market closed at 8683.15 levels.
The Nifty August future closed with a premium of 25.05
points against a premium of 43.30 points in previous
session. The September series closed at a premium of
72.85 points.
The Implied Volatility of at the money options has
decreased from 13.97% to 12.78%.
The total OI of the market is Rs. 2,46,461/- cr. and the
stock futures OI is Rs. 75,103/- cr.
Few of the liquid counters where we have seen high cost
of
carry
are
JPASSOCIAT,
CUMMINSIND,
ADANIPOWER, IRB and SAIL.
Views
OI Gainers
FIIs continue to pour in liquidity in both equities and
OI
PRICE
Index Futures. They bought in cash market segment to
SCRIP
OI
PRICE
CHG. (%)
CHG. (%)
the tune of Rs. 436 crores. While, they were net buyers of
OFSS
187200
73.33
3701.35
3.35
Rs. 481 crores in Index Futures with decent rise in OI,
GODREJIND
2440500
35.58
402.45
0.46
indicating fresh long formation in last trading session.
On Index Options front, FIIs bought significantly of Rs.
HINDZINC
6259200
26.93
220.00
4.94
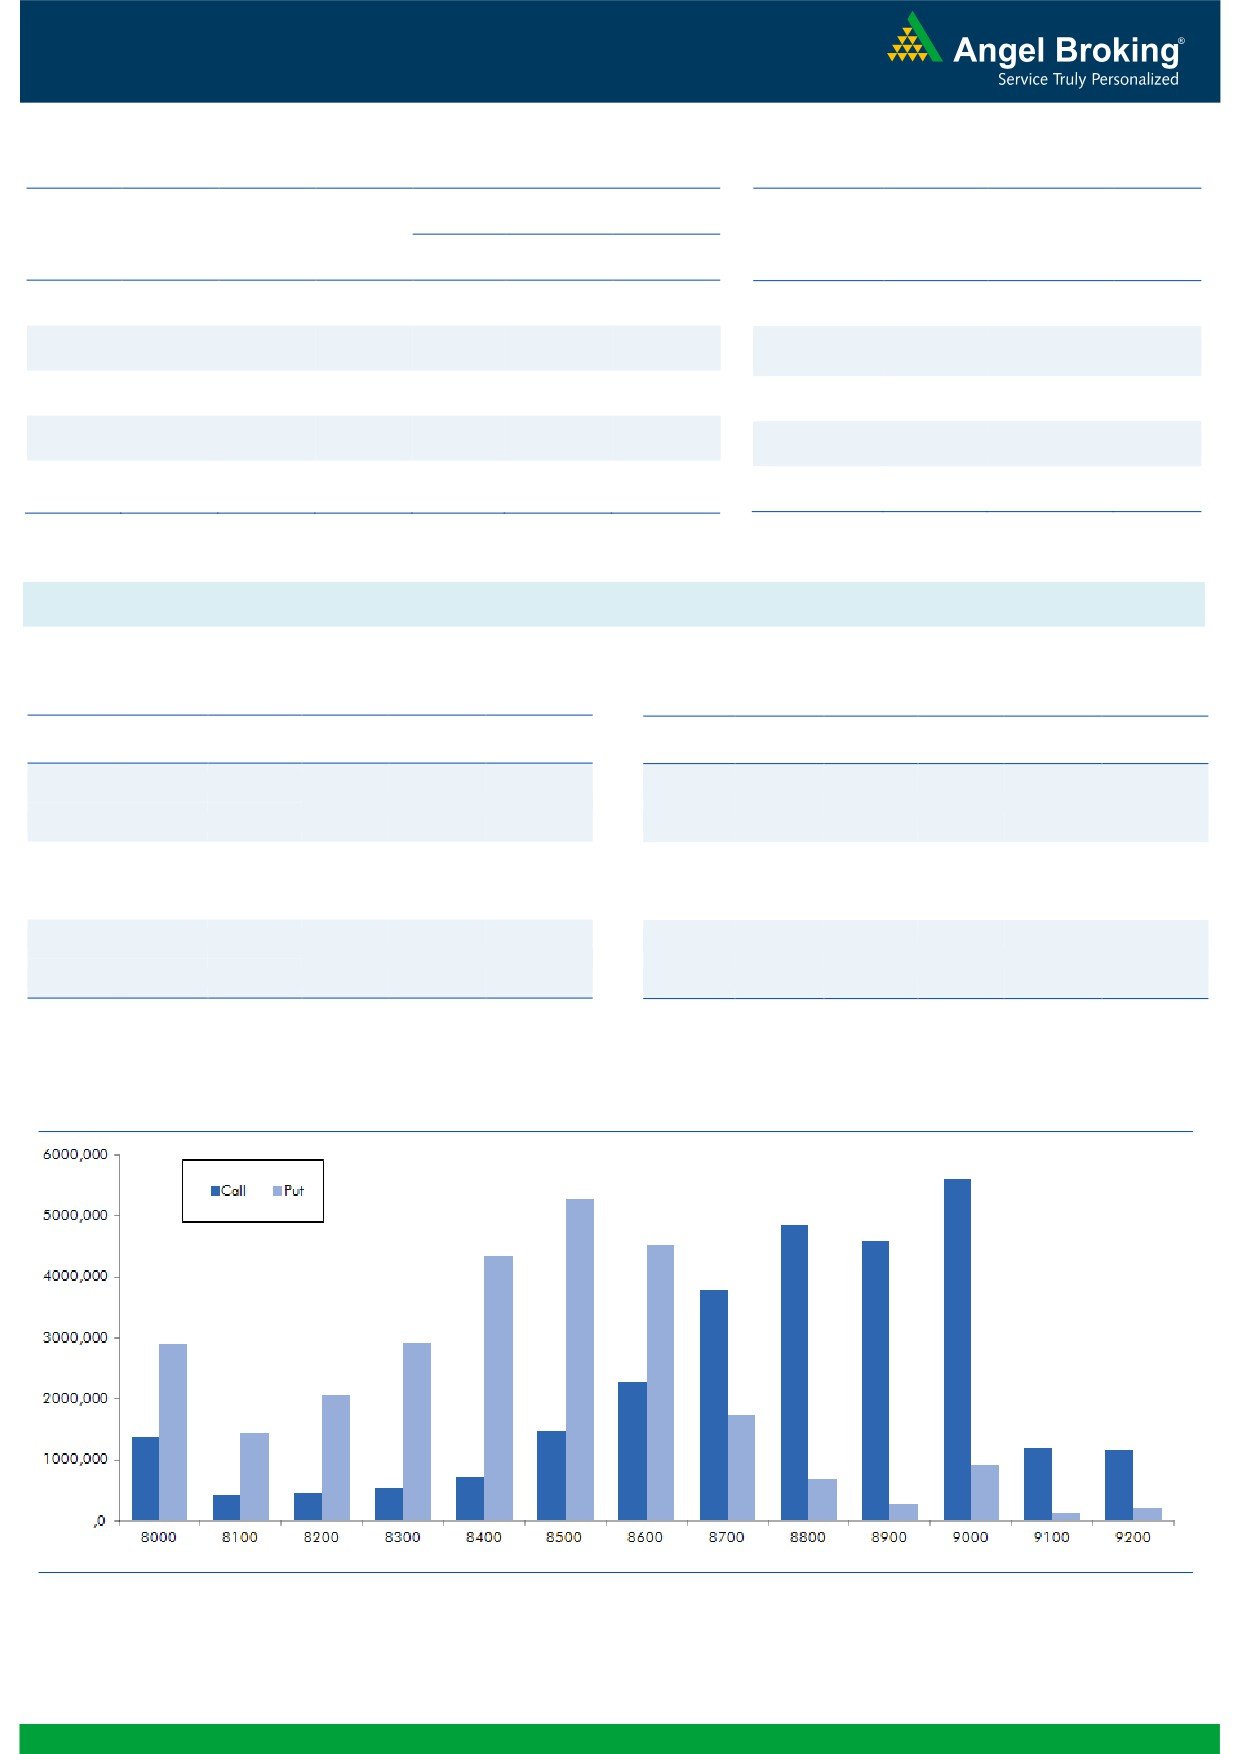
1999 crores with some rise in OI. In call options, we
JUBLFOOD
1679000
19.63
1171.85
-0.21
hardly saw any relevant OI addition,
huge amount of
IBREALEST
37860000
19.32
85.10
-3.62
unwinding was witnessed in 8700-8800 and 9000 call
options. While in put options, 8400-8600 strikes added
OI Losers
decent build-up. Highest OI in August series is placed at
OI
PRICE
SCRIP
OI
PRICE
9000 call and 8500 put options.
CHG. (%)
CHG. (%)
In the start of August series, we observed FIIs writing
ARVIND
8426000
-7.89
311.00
1.65
OTM call options 8800-9000. We believe FIIs have
MRF
53355
-7.80
37112.95
4.64
square-off decent amount of these positions last Friday,
JSWSTEEL
5081400
-7.60
1746.45
1.67
indicating they are still optimistic and they are expecting
SIEMENS
1173000
-7.60
1273.50
2.29
Nifty to surpass 8800 levels in near term. Thus, traders
STAR
778500
-6.60
1152.15
1.78
are suggested to hold on to their longs.
Historical Volatility
Put-Call Ratio
SCRIP
HV
SCRIP
PCR-OI
PCR-VOL
BHARATFORG
66.38
NIFTY
0.97
0.95
GRASIM
33.18
BANKNIFTY
1.08
0.92
APOLLOTYRE
50.59
ICICIBANK
0.35
0.25
HEROMOTOCO
31.54
INFY
0.29
0.52
AMBUJACEM
28.64
LT
0.49
0.40
Strategy Date
Symbol
Strategy
Status
01-08-2016
RELIANCE
Ratio Bear Put Spread
Active
2
Technical & Derivatives Report
August 08, 2016
FII Statistics for 05-August 2016
Turnover on 05-August 2016
Open Interest
No. of
Turnover
Change
Detail
Buy
Sell
Net
Instrument
Value
Contracts
( in Cr. )
(%)
Contracts
Change (%)
(in Cr.)
INDEX
INDEX
2451.23
1970.32
480.91
322687
21473.91
4.60
223943
15334.58
-7.67
FUTURES
FUTURES
INDEX
INDEX
30128.51
28129.58
1998.93
925620
60742.10
1.85
2366513
161088.97
-58.45
OPTIONS
OPTIONS
STOCK
6027.82
6042.99
(15.17)
853279
55879.81
1.36
STOCK
FUTURES
627747
42538.40
17.56
FUTURES
STOCK
STOCK
3749.66
3752.79
(3.13)
67633
4493.95
9.22
OPTIONS
343231
23472.66
17.32
OPTIONS
TOTAL
42357.23
39895.69
2461.54
2169219
142589.78
2.27
TOTAL
3561434
242434.61
-47.35
Nifty Spot = 8683.15
Lot Size = 75
Bull-Call Spreads
Bear-Put Spreads
Action
Strike
Price
Risk
Reward
BEP
Action
Strike
Price
Risk
Reward
BEP
Buy
8700
106.10
Buy
8700
100.20
44.85
55.15
8744.85
37.15
62.85
8662.85
Sell
8800
61.25
Sell
8600
63.05
Buy
8700
106.10
Buy
8700
100.20
74.05
125.95
8774.05
62.15
137.85
8637.85
Sell
8900
32.05
Sell
8500
38.05
Buy
8800
61.25
Buy
8600
63.05
29.20
70.80
8829.20
25.00
75.00
8575.00
Sell
8900
32.05
Sell
8500
38.05
Note: Above mentioned Bullish or Bearish Spreads in Nifty (August Series) are given as an information and not as a recommendation.
Nifty Put-Call Analysis
3
Technical & Derivatives Report
August 08, 2016
Daily Pivot Levels for Nifty Constituents
Scrips
S2
S1
PIVOT
R1
R2
ACC
1,647
1,684
1,704
1,741
1,761
ADANIPORTS
227
231
233
236
238
AMBUJACEM
261
268
273
280
284
ASIANPAINT
1,123
1,133
1,139
1,150
1,156
AUROPHARMA
745
757
765
778
785
AXISBANK
544
556
562
574
581
BAJAJ-AUTO
2,700
2,781
2,831
2,912
2,962
BANKBARODA
154
156
158
159
161
BHEL
134
136
137
139
141
BPCL
568
577
583
592
597
BHARTIARTL
353
359
365
370
377
INFRATEL
383
386
391
395
400
BOSCH
24,632
24,834
24,967
25,168
25,301
CIPLA
524
529
532
536
539
COALINDIA
323
326
328
332
334
DRREDDY
2,954
2,981
2,998
3,026
3,042
EICHERMOT
21,230
21,727
22,013
22,509
22,795
GAIL
371
377
380
386
390
GRASIM
4,846
5,056
5,209
5,418
5,571
HCLTECH
809
816
824
830
838
HDFCBANK
1,235
1,242
1,249
1,256
1,263
HDFC
1,311
1,326
1,338
1,354
1,366
HEROMOTOCO
3,212
3,328
3,397
3,513
3,582
HINDALCO
136
140
142
146
148
HINDUNILVR
911
918
924
931
936
ICICIBANK
242
244
246
248
251
IDEA
104
105
106
107
108
INDUSINDBK
1,168
1,176
1,182
1,191
1,197
INFY
1,054
1,061
1,067
1,074
1,081
ITC
248
250
253
256
259
KOTAKBANK
750
762
769
781
788
LT
1,464
1,488
1,502
1,527
1,541
LUPIN
1,644
1,659
1,677
1,692
1,709
M&M
1,427
1,455
1,473
1,501
1,519
MARUTI
4,871
4,906
4,936
4,971
5,001
NTPC
157
159
161
163
165
ONGC
218
222
224
228
231
POWERGRID
173
175
178
180
183
RELIANCE
989
1,003
1,011
1,024
1,033
SBIN
224
228
231
235
238
SUNPHARMA
827
834
844
852
862
TCS
2,603
2,626
2,655
2,678
2,707
TATAMTRDVR
318
325
329
335
339
TATAMOTORS
496
506
512
523
529
TATAPOWER
71
71
71
71
72
TATASTEEL
374
378
380
384
387
TECHM
484
490
499
504
513
ULTRACEMCO
3,600
3,704
3,773
3,877
3,946
WIPRO
542
544
548
551
555
YESBANK
1,223
1,241
1,252
1,269
1,280
ZEEL
485
491
494
500
504
4
Technical & Derivatives Report
August 08, 2016
Research Team Tel: 022 - 39357800
For Technical Queries
For Derivatives Queries
DISCLAIMER
Angel Broking Private Limited (hereinafter referred to as “Angel”) is a registered Member of National Stock Exchange of India Limited,
Bombay Stock Exchange Limited and Metropolitan Stock Exchange Limited. It is also registered as a Depository Participant with CDSL
and Portfolio Manager with SEBI. It also has registration with AMFI as a Mutual Fund Distributor. Angel Broking Private Limited is a
registered entity with SEBI for Research Analyst in terms of SEBI (Research Analyst) Regulations, 2014 vide registration number
INH000000164. Angel or its associates has not been debarred/ suspended by SEBI or any other regulatory authority for accessing
/dealing in securities Market. Angel or its associates/analyst has not received any compensation / managed or co-managed public
offering of securities of the company covered by Analyst during the past twelve months.
This document is solely for the personal information of the recipient, and must not be singularly used as the basis of any investment
decision. Nothing in this document should be construed as investment or financial advice. Each recipient of this document should
make such investigations as they deem necessary to arrive at an independent evaluation of an investment in the securities of the
companies referred to in this document (including the merits and risks involved), and should consult their own advisors to determine
the merits and risks of such an investment.
Reports based on technical and derivative analysis center on studying charts of a stock's price movement, outstanding positions and
trading volume, as opposed to focusing on a company's fundamentals and, as such, may not match with a report on a company's
fundamentals. Investors are advised to refer the Fundamental and Technical Research Reports available on our website to evaluate the
contrary view, if any.
The information in this document has been printed on the basis of publicly available information, internal data and other reliable
sources believed to be true, but we do not represent that it is accurate or complete and it should not be relied on as such, as this
document is for general guidance only. Angel Broking Pvt. Limited or any of its affiliates/ group companies shall not be in any way
responsible for any loss or damage that may arise to any person from any inadvertent error in the information contained in this report.
Angel Broking Pvt. Limited has not independently verified all the information contained within this document. Accordingly, we cannot
testify, nor make any representation or warranty, express or implied, to the accuracy, contents or data contained within this document.
While Angel Broking Pvt. Limited endeavors to update on a reasonable basis the information discussed in this material, there may be
regulatory, compliance, or other reasons that prevent us from doing so.
This document is being supplied to you solely for your information, and its contents, information or data may not be reproduced,
redistributed or passed on, directly or indirectly.
Neither Angel Broking Pvt. Limited, nor its directors, employees or affiliates shall be liable for any loss or damage that may arise from
or in connection with the use of this information.
5