Technical & Derivatives Report
July 08, 2016
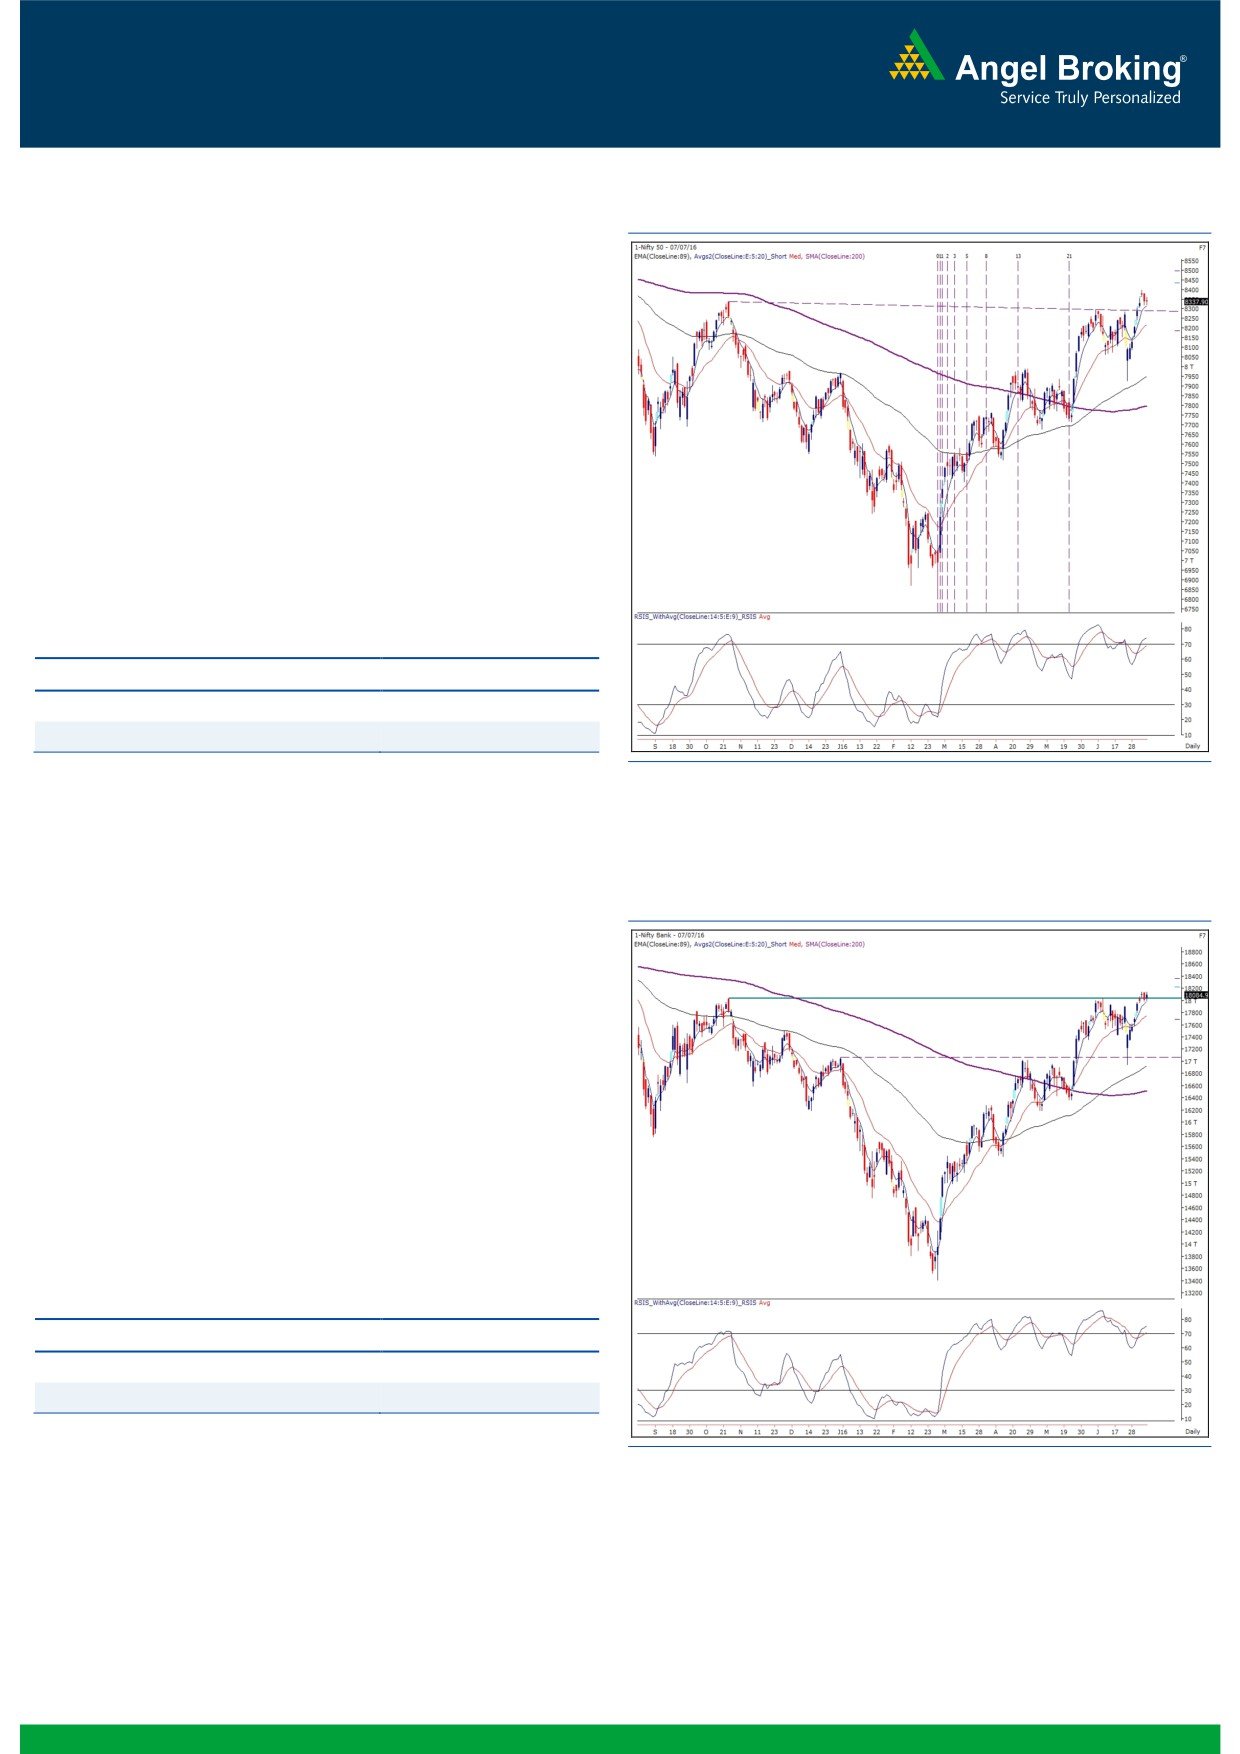
Exhibit 1: Nifty Daily Chart
Sensex (27201) / Nifty (8338)
Our markets opened on a flat note owing to mixed global cues.
The index consolidated for quite some time and then made a
valiant attempt to move higher immediately post the mid session.
However, a strong selling pressure near day's high pulled the
index lower to end the session almost near to previous day's
close.
It was yet another day of consolidation for our market; however,
the bias in the broader market remained positive throughout the
day. We do not see any notable change in the chart structure and
thus, we maintain our positive stance on the market and expect
the index to move towards 8420 - 8450 levels. On the flipside,
8280 - 8240 remains to be a strong support zone.
Key Levels
Support 1 - 8280
Resistance 1 - 8420
Support 2 - 8240
Resistance 2 - 8450
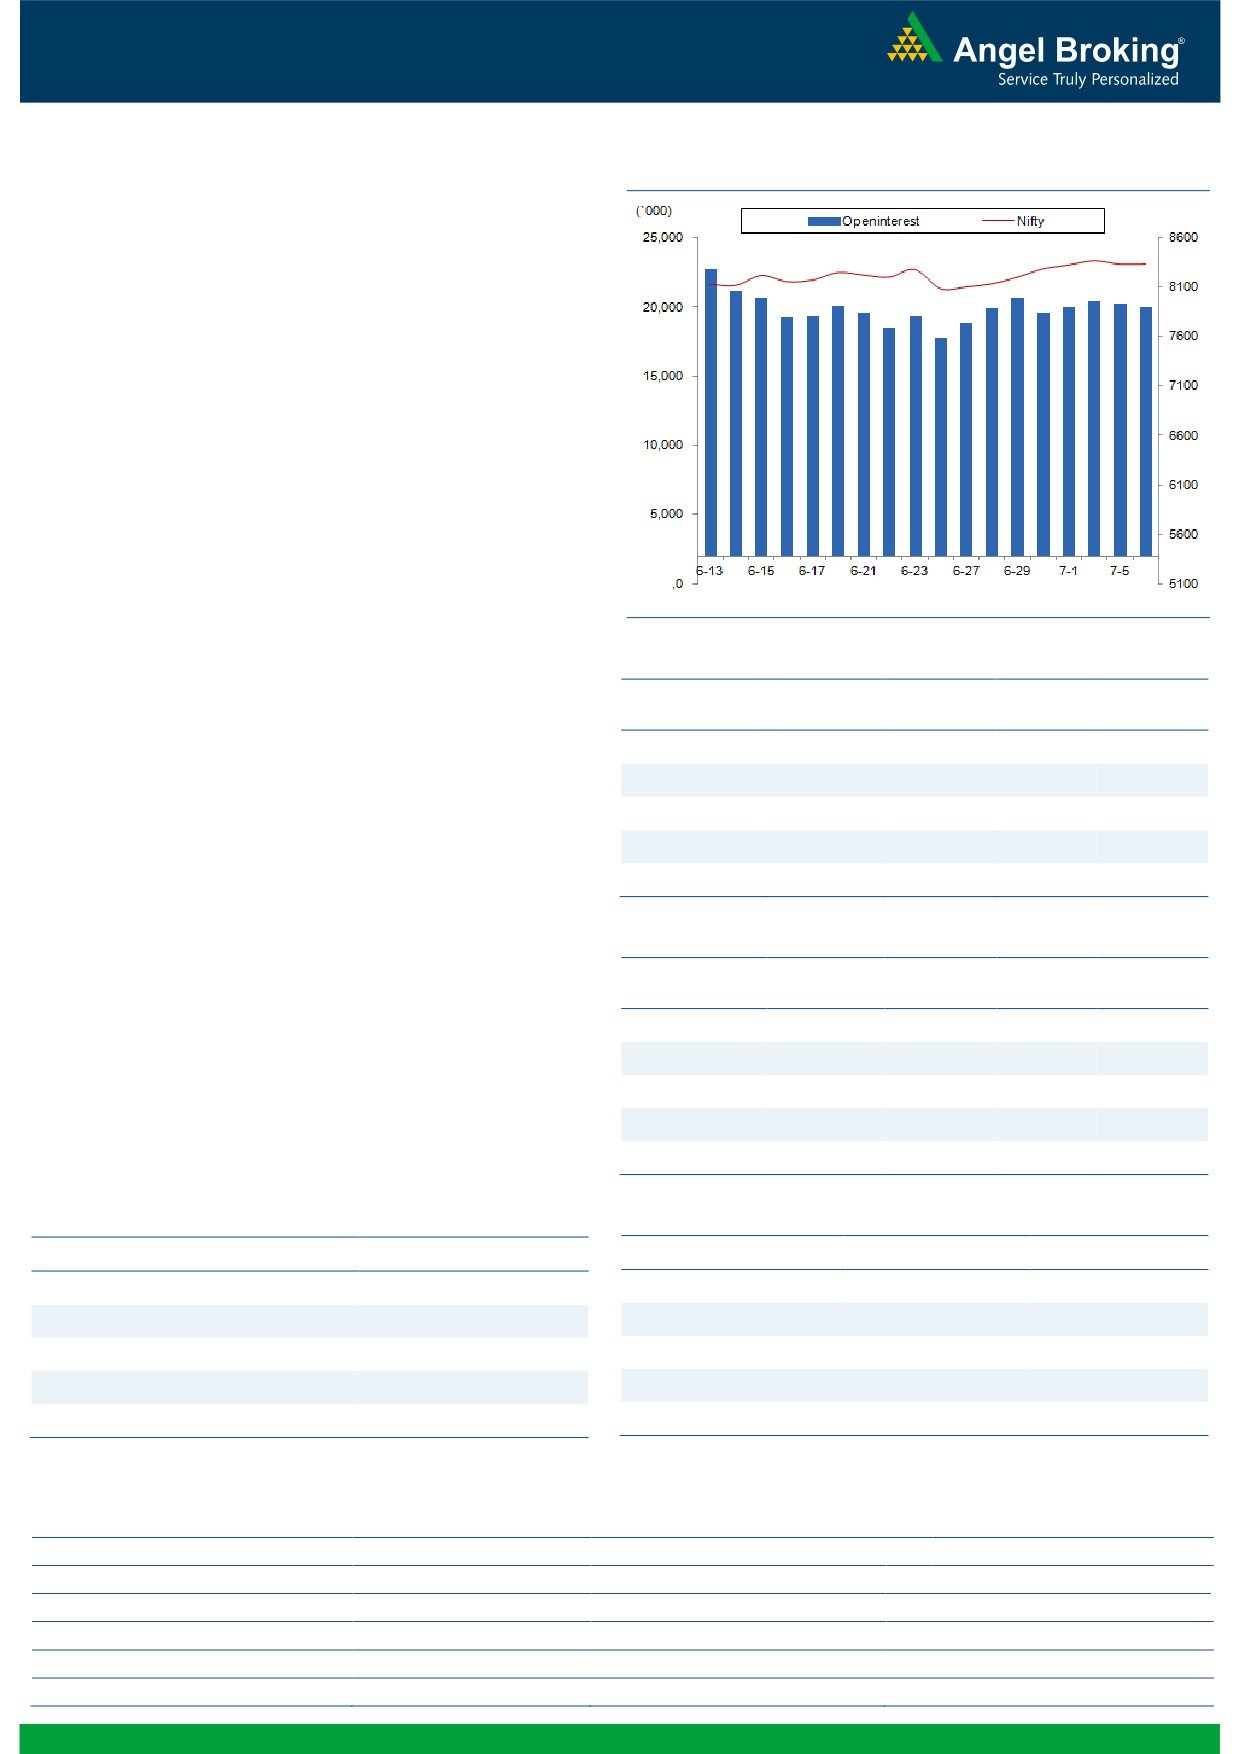
Exhibit 2: Nifty Bank Daily Chart
Nifty Bank Outlook - (18085)
In yesterday's trading session, the Nifty Bank index traded in a
narrow range and ended the session with minor gains of 0.45
percent over its previous day's close.
Since last three trading sessions, the index has been consolidating
in a narrow range and has been forming small body candles.
This consolidation is seen post a sharp rally of 1200 points from
the low of 16946 on 24th June. The consolidation move just
seems to be a breather within the uptrend and hence traders are
advised to look for buying opportunities on minor dips. The
intraday supports for the index are placed around 17975 and
17840; whereas resistances are seen around 18200 and 18350.
Key Levels
Support 1 - 17975
Resistance 1 - 18200
Support 2 - 17840
Resistance 2 - 18350
1
Technical & Derivatives Report
July 08, 2016
Comments
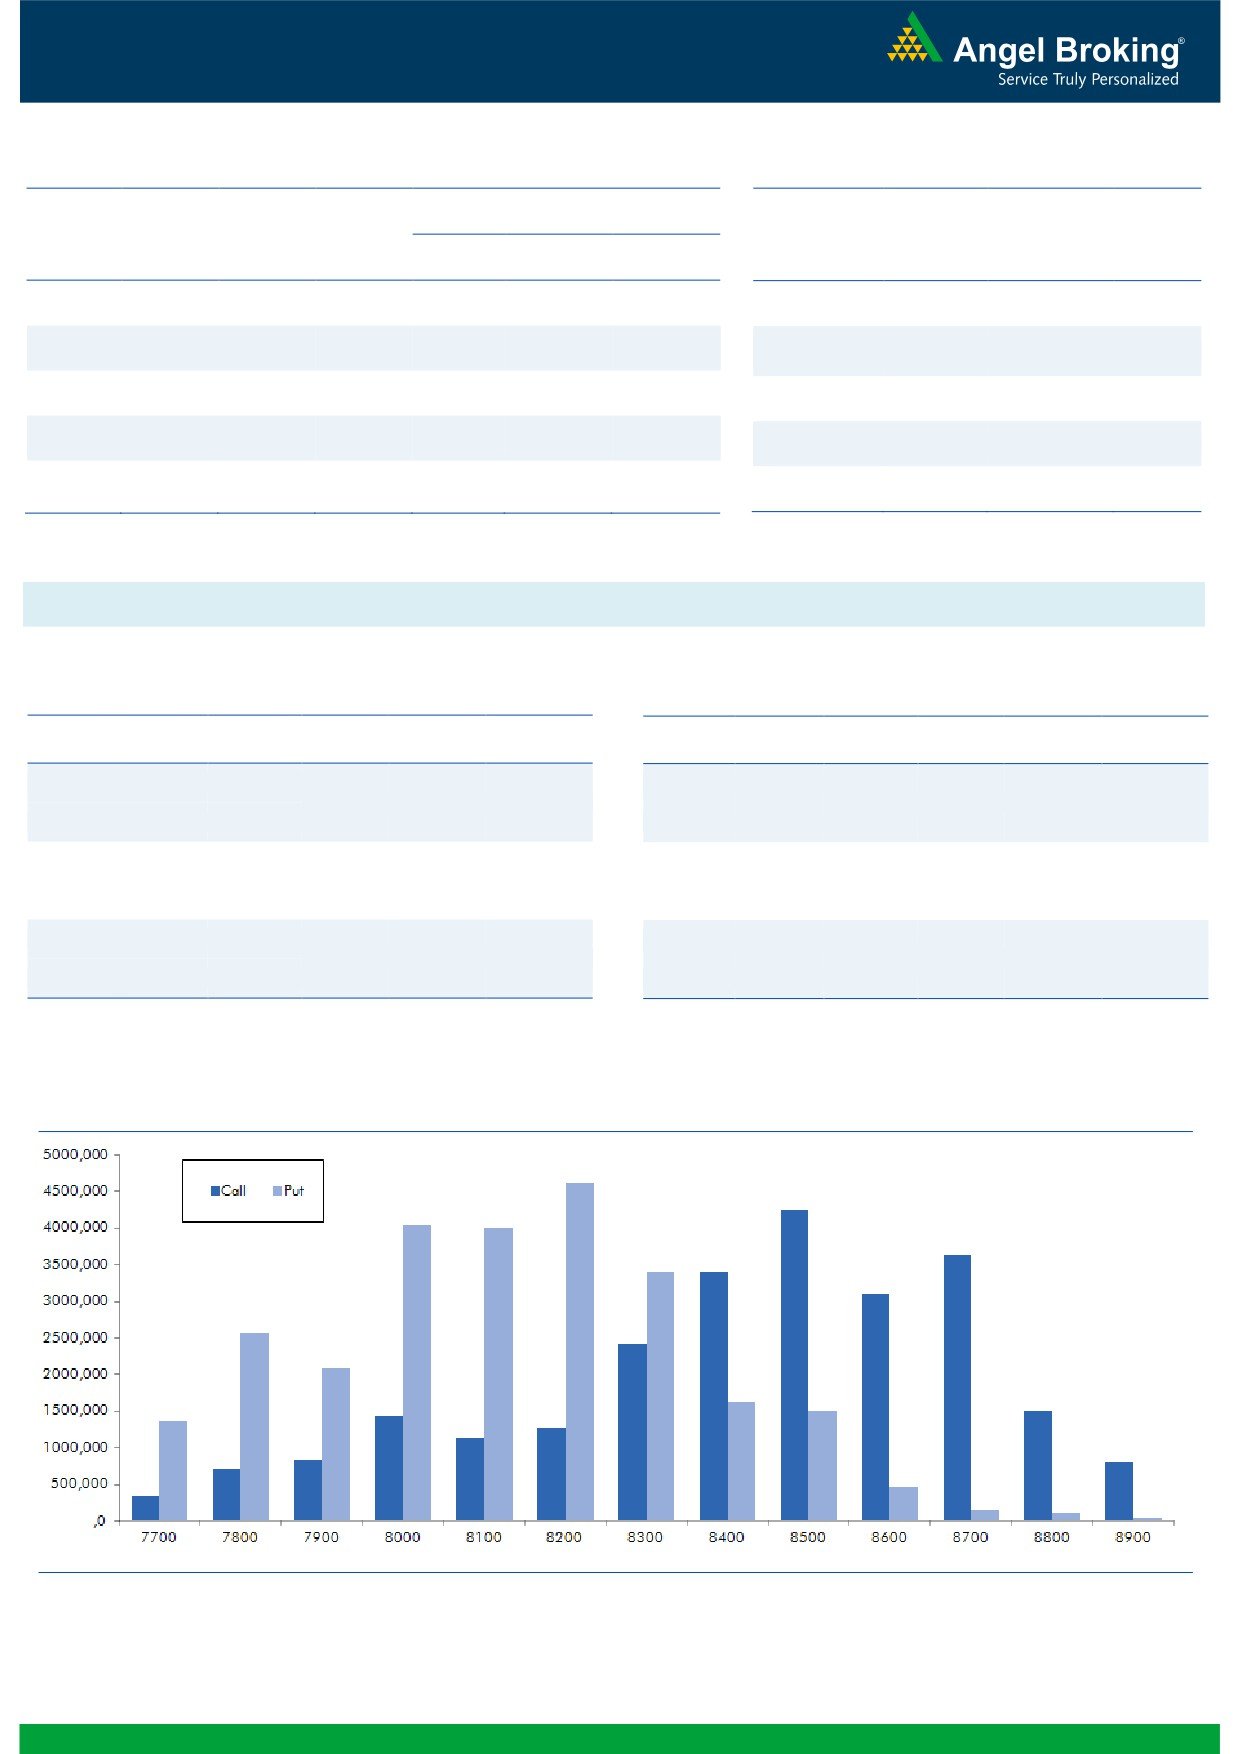
Nifty Vs OI
The Nifty futures open interest has decreased by 1.18%
BankNifty futures open interest has increased by 0.26%
as market closed at 8337.90 levels.
The Nifty July future closed with a premium of 20.40
points against a premium of 18.05 points in previous
session. The August series closed at a premium of 56.90
points.
The Implied Volatility of at the money options has
increased from 14.05% to 14.14%.
The total OI of the market is Rs. 2,22,721/- cr. and the
stock futures OI is Rs. 64,381/- cr.
Few of the liquid counters where we have seen high cost
of carry are ADANIPOWER, APOLLOHOSP, IDFC,
ADANIENT and IFCI.
Views
OI Gainers
FIIs were net sellers in both cash market segment and in
OI
PRICE
Index Futures. They sold equities to the tune of Rs. 299
SCRIP
OI
PRICE
CHG. (%)
CHG. (%)
crores. While in Index Futures, they were net sellers of Rs.
NIITTECH
785000
48.67
501.75
-4.70
224 crores with marginal change in open interest,
BPCL
6967200
23.00
1108.10
1.38
indicating mix of long unwinding and some formation in
previous trading session.
AMARAJABAT
918000
21.91
840.30
-2.40
On Index Options front, FIIs bought worth Rs. 350 crores
SINTEX
13125000
20.66
80.30
-2.61
with rise in open interest. We hardly saw any meaningful
TATASTEEL
26722000
19.99
310.55
-5.18
open interest addition in Nifty options. 8400 call and
8300 puts were comparatively active. Maximum open
OI Losers
interest in current series is placed at 8500 call and of put
OI
PRICE
SCRIP
OI
PRICE
has shifted from 8000 to 8200 strikes.
CHG. (%)
CHG. (%)
We witness good amount of long formation in Index
JPASSOCIAT
167076000
-13.76
12.05
2.99
Futures and these positions are still intact. In last two
CESC
1196800
-6.29
614.90
0.97
trading sessions, FIIs were net sellers in Index futures but
RELINFRA
9217000
-5.34
571.15
0.11
quantum is negligible. We believe resistance of 8280-
UPL
8791200
-4.21
555.55
1.35
8300 may now act as a support for Nifty. Hence, traders
WIPRO
5656000
-4.01
560.00
-0.92
are advised to trade with positive bias.
Historical Volatility
Put-Call Ratio
SCRIP
HV
SCRIP
PCR-OI
PCR-VOL
LUPIN
41.51
NIFTY
1.05
1.04
HAVELLS
27.58
BANKNIFTY
0.99
0.93
APOLLOTYRE
33.33
SBIN
0.70
0.64
HINDUNILVR
26.70
RELIANCE
0.50
0.35
TATASTEEL
45.31
ASHOKLEY
0.34
0.27
Strategy Date
Symbol
Strategy
Status
04-07-2016
RCOM
Ratio Bull Call Spread
Active
2
Technical & Derivatives Report
July 08, 2016
FII Statistics for 07-July 2016
Turnover on 07-July 2016
Open Interest
No. of
Turnover
Change
Detail
Buy
Sell
Net
Instrument
Value
Contracts
( in Cr. )
(%)
Contracts
Change (%)
(in Cr.)
INDEX
INDEX
719.93
944.31
(224.37)
233001
14864.02
(0.15)
176039
11730.78
4.94
FUTURES
FUTURES
INDEX
INDEX
14805.80
14456.11
349.69
799783
50230.18
1.44
2909422
200398.47
51.21
OPTIONS
OPTIONS
STOCK
4414.08
4893.30
(479.22)
784360
49075.84
0.72
STOCK
FUTURES
476093
30846.51
-4.53
FUTURES
STOCK
STOCK
2620.16
2633.72
(13.56)
51592
3276.11
30.09
OPTIONS
247628
16480.63
-5.01
OPTIONS
TOTAL
22559.97
22927.44
(367.46)
1868736
117446.14
1.55
TOTAL
3809182
259456.39
34.18
Nifty Spot = 8337.90
Lot Size = 75
Bull-Call Spreads
Bear-Put Spreads
Action
Strike
Price
Risk
Reward
BEP
Action
Strike
Price
Risk
Reward
BEP
Buy
8400
91.15
Buy
8300
89.60
41.10
58.90
8441.10
30.05
69.95
8269.95
Sell
8500
50.05
Sell
8200
59.55
Buy
8400
91.15
Buy
8300
89.60
66.80
133.20
8466.80
50.95
149.05
8249.05
Sell
8600
24.35
Sell
8100
38.65
Buy
8500
50.05
Buy
8200
59.55
25.70
74.30
8525.70
20.90
79.10
8179.10
Sell
8600
24.35
Sell
8100
38.65
Note: Above mentioned Bullish or Bearish Spreads in Nifty (July Series) are given as an information and not as a recommendation.
Nifty Put-Call Analysis
3
Technical & Derivatives Report
July 08, 2016
Daily Pivot Levels for Nifty Constituents
Scrips
S2
S1
PIVOT
R1
R2
ACC
1,554
1,579
1,595
1,620
1,635
ADANIPORTS
204
207
212
215
220
AMBUJACEM
250
254
256
260
262
ASIANPAINT
978
983
990
995
1,002
AUROPHARMA
747
755
767
775
787
AXISBANK
531
536
541
547
552
BAJAJ-AUTO
2,574
2,592
2,609
2,627
2,644
BANKBARODA
155
156
159
161
164
BHEL
138
139
140
141
143
BPCL
1,077
1,095
1,108
1,127
1,140
BHARTIARTL
357
360
366
369
374
INFRATEL
343
347
353
357
363
BOSCH
22,251
22,490
22,632
22,872
23,014
CIPLA
499
506
512
520
525
COALINDIA
308
312
319
323
330
DRREDDY
3,435
3,480
3,513
3,558
3,591
EICHERMOT
19,165
19,379
19,514
19,728
19,863
GAIL
379
382
387
389
394
GRASIM
4,497
4,524
4,547
4,574
4,597
HCLTECH
699
708
725
733
750
HDFCBANK
1,151
1,168
1,178
1,196
1,206
HDFC
1,238
1,264
1,280
1,306
1,322
HEROMOTOCO
3,070
3,086
3,111
3,128
3,153
HINDALCO
123
125
127
129
131
HINDUNILVR
878
898
909
929
940
ICICIBANK
242
244
245
247
248
IDEA
103
104
105
106
107
INDUSINDBK
1,085
1,095
1,106
1,116
1,127
INFY
1,145
1,151
1,161
1,167
1,177
ITC
242
244
247
249
251
KOTAKBANK
733
740
746
752
758
LT
1,531
1,543
1,562
1,574
1,594
LUPIN
1,487
1,572
1,635
1,719
1,782
M&M
1,439
1,448
1,459
1,468
1,479
MARUTI
4,087
4,114
4,152
4,179
4,217
NTPC
148
151
152
155
157
ONGC
223
225
228
230
234
POWERGRID
159
161
163
165
167
RELIANCE
977
983
992
997
1,006
SBIN
216
218
221
223
227
SUNPHARMA
771
774
779
782
787
TCS
2,382
2,406
2,449
2,473
2,516
TATAMTRDVR
285
288
293
296
301
TATAMOTORS
447
451
458
462
470
TATAPOWER
73
73
74
74
75
TATASTEEL
303
310
324
331
345
TECHM
496
500
508
512
519
ULTRACEMCO
3,310
3,346
3,383
3,419
3,455
WIPRO
551
555
562
566
572
YESBANK
1,097
1,105
1,117
1,125
1,137
ZEEL
436
442
452
458
469
4
Technical & Derivatives Report
July 08, 2016
Research Team Tel: 022 - 39357800
For Technical Queries
For Derivatives Queries
DISCLAIMER
Angel Broking Private Limited (hereinafter referred to as “Angel”) is a registered Member of National Stock Exchange of India Limited,
Bombay Stock Exchange Limited and MCX Stock Exchange Limited. It is also registered as a Depository Participant with CDSL and
Portfolio Manager with SEBI. It also has registration with AMFI as a Mutual Fund Distributor. Angel Broking Private Limited is a
registered entity with SEBI for Research Analyst in terms of SEBI (Research Analyst) Regulations, 2014 vide registration number
INH000000164. Angel or its associates has not been debarred/ suspended by SEBI or any other regulatory authority for accessing
/dealing in securities Market. Angel or its associates including its relatives/analyst do not hold any financial interest/beneficial
ownership of more than 1% in the company covered by Analyst. Angel or its associates/analyst has not received any compensation /
managed or co-managed public offering of securities of the company covered by Analyst during the past twelve months. Angel/analyst
has not served as an officer, director or employee of company covered by Analyst and has not been engaged in market making activity
of the company covered by Analyst.
This document is solely for the personal information of the recipient, and must not be singularly used as the basis of any investment
decision. Nothing in this document should be construed as investment or financial advice. Each recipient of this document should
make such investigations as they deem necessary to arrive at an independent evaluation of an investment in the securities of the
companies referred to in this document (including the merits and risks involved), and should consult their own advisors to determine
the merits and risks of such an investment.
Reports based on technical and derivative analysis center on studying charts of a stock's price movement, outstanding positions and
trading volume, as opposed to focusing on a company's fundamentals and, as such, may not match with a report on a company's
fundamentals.
The information in this document has been printed on the basis of publicly available information, internal data and other reliable
sources believed to be true, but we do not represent that it is accurate or complete and it should not be relied on as such, as this
document is for general guidance only. Angel Broking Pvt. Limited or any of its affiliates/ group companies shall not be in any way
responsible for any loss or damage that may arise to any person from any inadvertent error in the information contained in this report.
Angel Broking Pvt. Limited has not independently verified all the information contained within this document. Accordingly, we cannot
testify, nor make any representation or warranty, express or implied, to the accuracy, contents or data contained within this document.
While Angel Broking Pvt. Limited endeavors to update on a reasonable basis the information discussed in this material, there may be
regulatory, compliance, or other reasons that prevent us from doing so.
This document is being supplied to you solely for your information, and its contents, information or data may not be reproduced,
redistributed or passed on, directly or indirectly.
Neither Angel Broking Pvt. Limited, nor its directors, employees or affiliates shall be liable for any loss or damage that may arise from
or in connection with the use of this information.
Note: Please refer to the important ‘Stock Holding Disclosure' report on the Angel website (Research Section). Also, please refer to the
latest update on respective stocks for the disclosure status in respect of those stocks. Angel Broking Pvt. Limited and its affiliates may
have investment positions in the stocks recommended in this report.
5