Technical & Derivatives Report
April 08, 2016
Sensex (24685) / Nifty (7546)
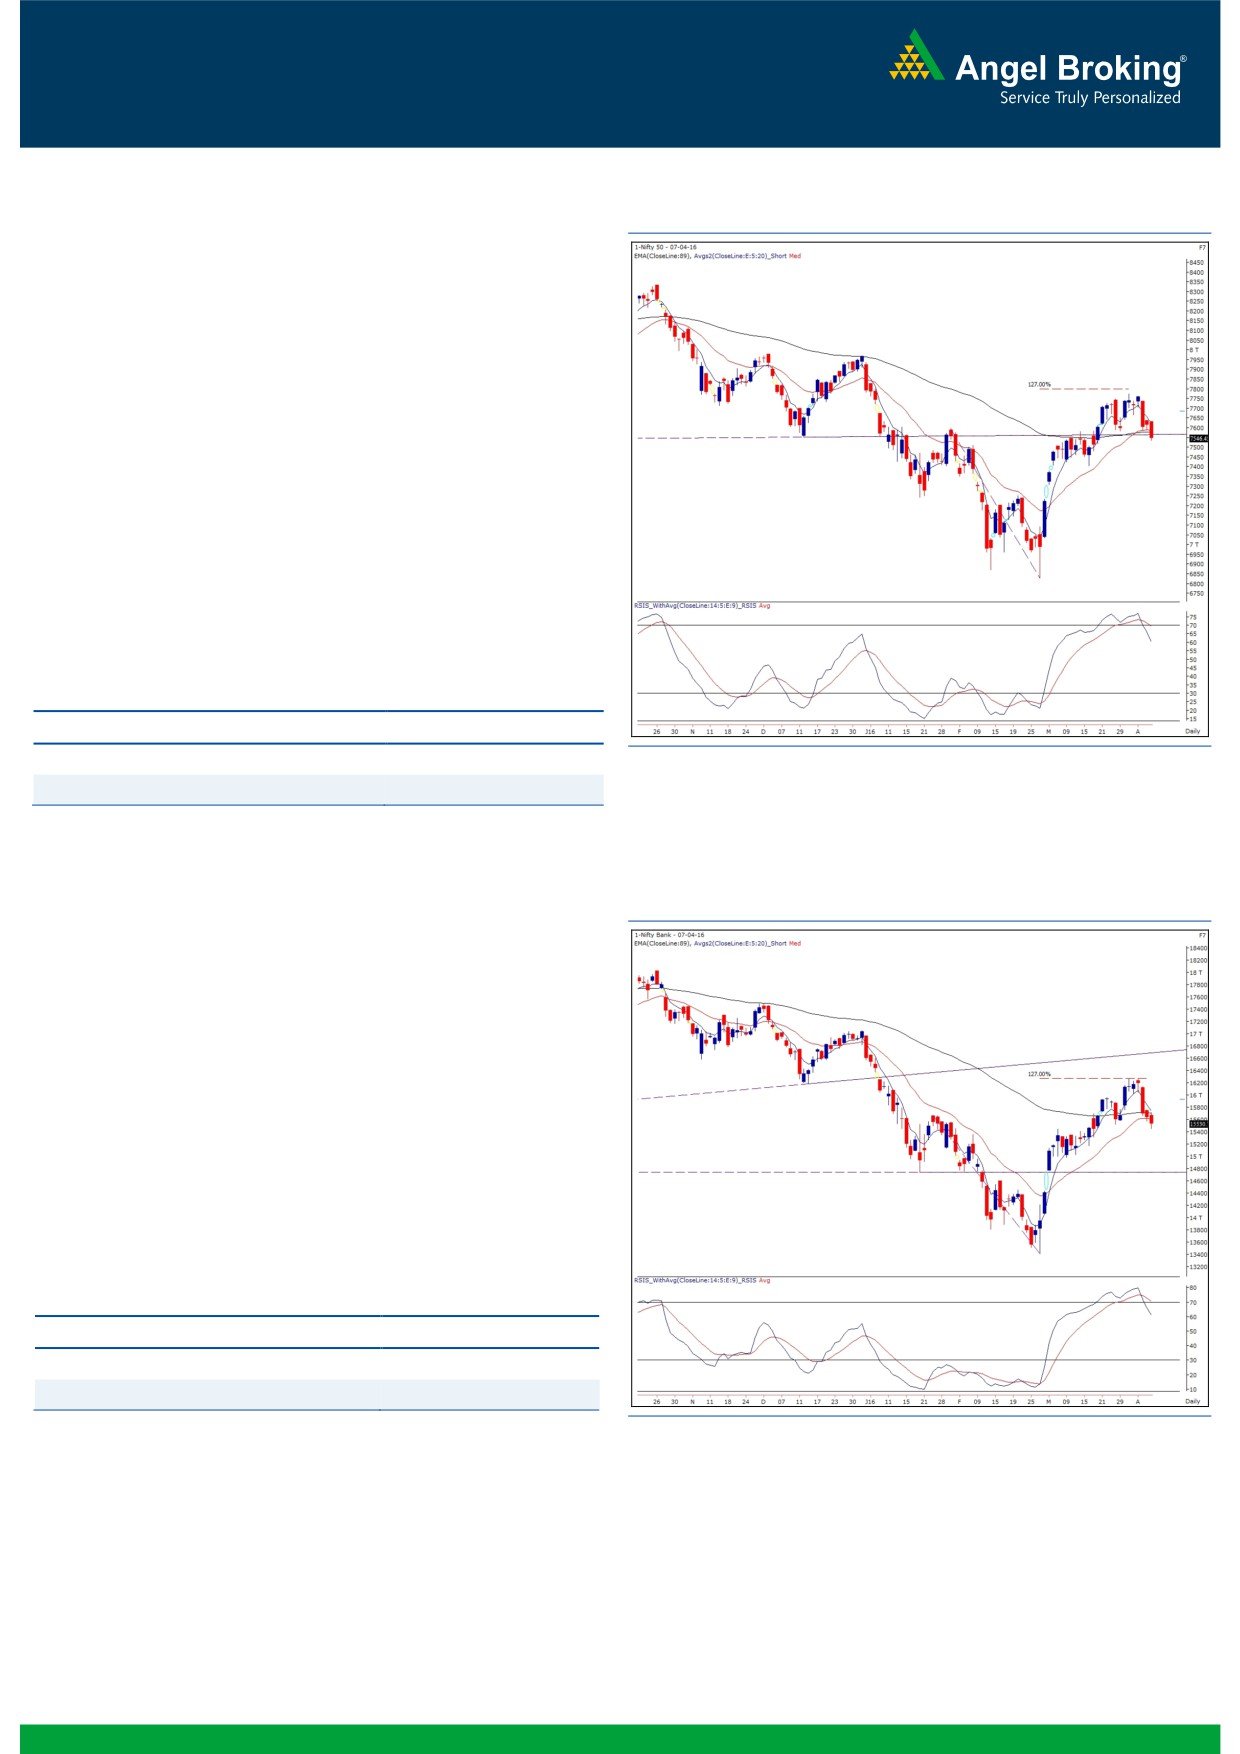
Exhibit 1: Nifty Daily Chart
A breather on Wednesday was followed by a muted opening; but,
the Nifty almost started with a ‘Open High’; hinting weakness
right from the beginning. The bears obliged to this move and
took the momentum forward to sneak below the 7580 mark,
which was very much on the cards. Despite seeing some decent
recovery in the early part of the second half, the Nifty eventually
managed to close with a cut of 0.89.
As expected, the reliable support level of 7580 on hourly chart
was thrashed during the session and the index went on to close
well below the daily ’20 EMA’. This is a sign of weakness and
thus, combining negative placement of the ‘RSI-Smoothened’
oscillator, we expect the Nifty to slide further towards 7490 and
possibly 7460 too. On the flipside, 7580 - 7600 is now likely to
act as a strong resistance for the index.
Key Levels
Support 1 - 7490
Resistance 1 - 7580
Support 2 - 7460
Resistance 2 - 7600
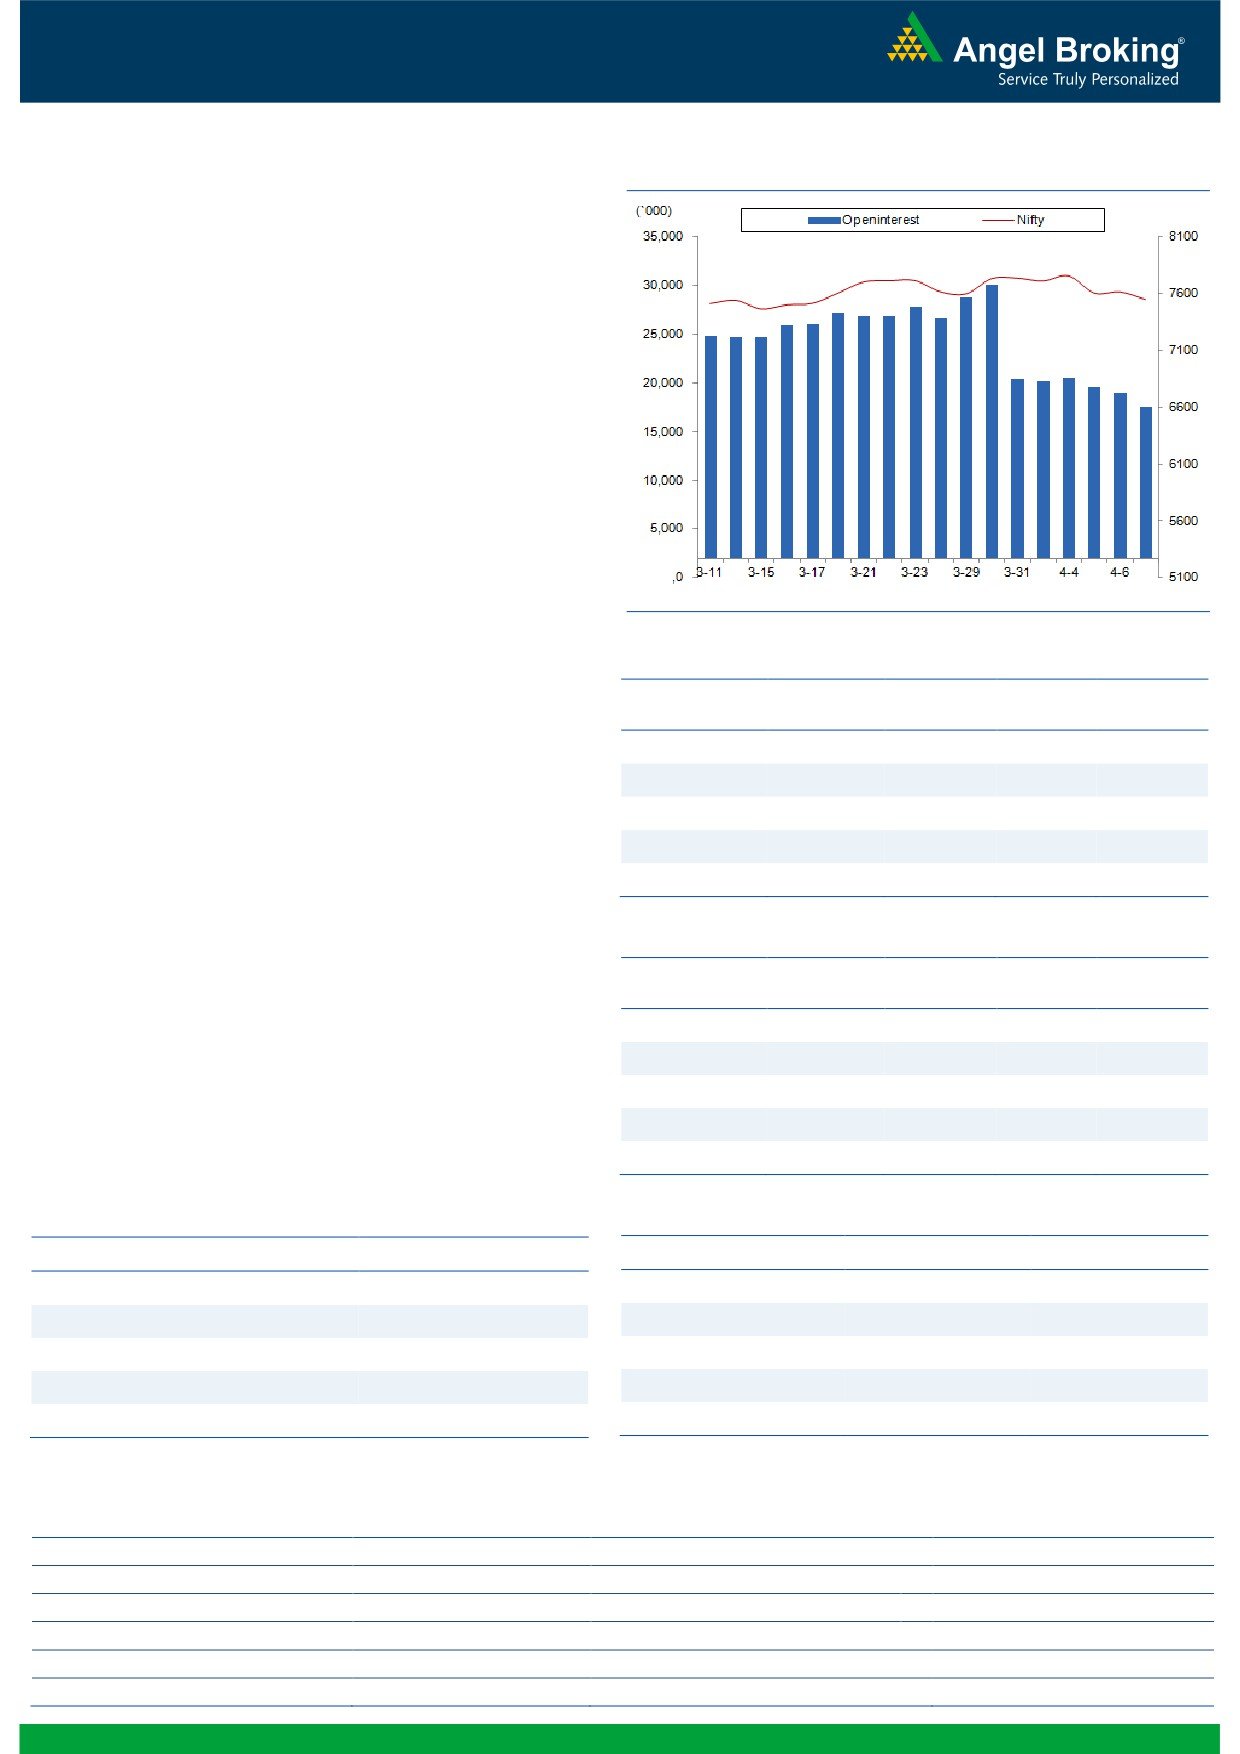
Exhibit 2: Nifty Bank Daily Chart
Nifty Bank Outlook - (15531)
The Nifty Bank index continued its corrective move and ended the
session with losses of 0.68% over its previous day's close.
The index has been correcting on expected lines since last three
trading sessions. There are no signs of reversal yet and hence,
traders are advised to continue to trade with a cautious view at
least for next couple of days. The short term support for the index
is placed around 15375 - 15175 and the index could give a
minor pullback post testing the mentioned support. Traders
should position accordingly and trade with proper risk
management strategy. On the flipside, the near term resistances
are seen around 15760 and 15970.
Key Levels
Support 1 - 15375
Resistance 1 - 15760
Support 2 - 15175
Resistance 2 - 15970
1
Technical & Derivatives Report
April 08, 2016
Comments
Nifty Vs OI
The Nifty futures open interest has decreased by 7.27%
BankNifty futures open interest has decreased by 3.14%
as market closed at 7546.45 levels.
The Nifty April future closed at a premium of 18.60
points against a premium of 20.35 points. The May
series closed at a premium of 52.85 points.
The Implied Volatility of at the money options has
decreased from 15.50% to 14.67%.
The total OI of the market is Rs. 1,94,954/- cr. and the
stock futures OI is Rs. 52,592/- cr.
Few of the liquid counters where we have seen high cost
of carry are UNITECH, INDIACEM, IFCI, JPASSOCIAT
and FEDERALBNK.
Views
FIIs continued to sell in both cash market and Index
OI Gainers
Futures segment. They sold equities to the tune of Rs.
OI
PRICE
295 crores. While in Index Futures, they were net seller of
SCRIP
OI
PRICE
CHG. (%)
CHG. (%)
Rs.
1474 crores with fall in rise in OI, suggesting
TATAPOWER
30936000
21.22
64.15
-3.97
unwinding of long positions in last trading session.
AMARAJABAT
648000
11.11
868.90
-1.54
In Index Options front, FIIs were net sellers of Rs. 550
MCDOWELL-N
772500
10.04
2367.95
-1.70
crores with marginal rise in OI. PCR-OI decreased from
VOLTAS
3969600
9.25
271.10
-2.39
0.78 to 0.76 with fall in IV’s, indicating short formationng.com
UNIONBANK
9120000
9.20
124.70
-1.77
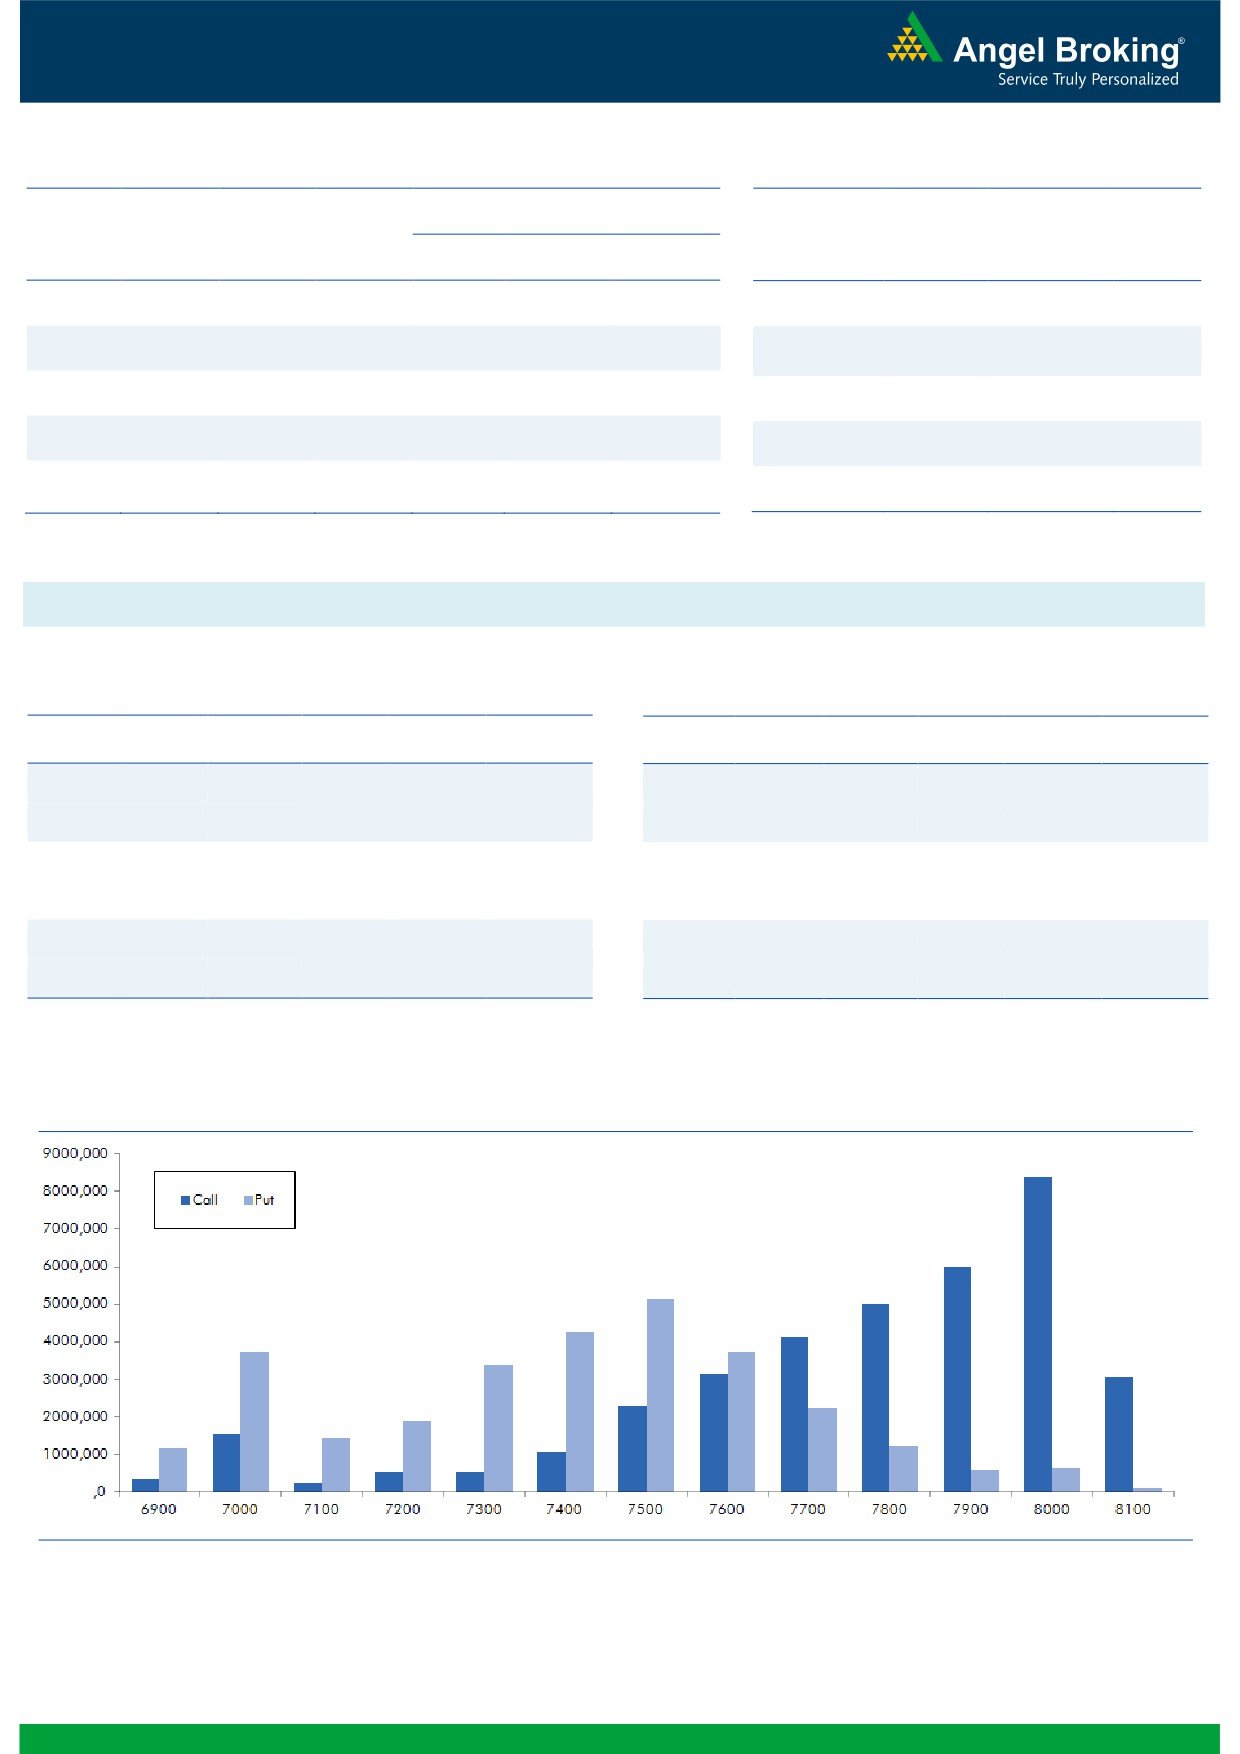
in call options. In call options, 7600 and 7700 strikes
added some fresh positions, which can be on short side.
OI Losers
Whereas, in put options, we hardly saw any strike adding
OI
PRICE
meaningful OI, some unwinding was visible in 7500. We
SCRIP
OI
PRICE
CHG. (%)
CHG. (%)
believe writers of 7500 put are covering their shorts,
CUMMINSIND
282000
-8.91
862.55
-1.81
assuming market to remain under pressure. Maximum
GODREJIND
1194700
-8.01
356.85
0.78
OI in current series is visible in 8000 call and 7500 put
HEXAWARE
2992000
-7.02
251.35
-2.14
options. From last 3-4 trading sessions we are witnessing
INDUSINDBK
4050600
-6.50
943.05
-1.43
meaningful profit booking by FIIs with some fresh shorts.
IOC
5674800
-5.29
411.65
-0.19
We would suggest traders to trade light as of now.
Historical Volatility
Put-Call Ratio
SCRIP
HV
SCRIP
PCR-OI
PCR-VOL
TATAPOWER
42.10
NIFTY
0.76
0.90
HDFC
30.63
BANKNIFTY
0.61
0.71
M&MFIN
46.39
SBIN
0.33
0.37
BHEL
58.14
ICICIBANK
0.37
0.45
MARUTI
39.75
MARUTI
0.40
0.51
Strategy Date
Symbol
Strategy
Status
April 04, 2016
TCS
Ratio Bear Put Spread
Active
2
Technical & Derivatives Report
April 08, 2016
FII Statistics for 07-April 2016
Turnover on 07-April 2016
Open Interest
No. of
Turnover
Change
Detail
Buy
Sell
Net
Instrument
Value
Contracts
( in Cr. )
(%)
Contracts
Change (%)
(in Cr.)
INDEX
INDEX
1105.08
2578.66
(1473.58)
216878
11954.23
(9.03)
324405
17145.27
33.71
FUTURES
FUTURES
INDEX
INDEX
26984.64
27534.39
(549.75)
1017205
56940.19
2.06
2963568
166233.65
27.76
OPTIONS
OPTIONS
STOCK
3691.78
3567.00
124.78
980865
44699.19
0.08
STOCK
FUTURES
539391
25210.23
4.73
FUTURES
STOCK
STOCK
2377.47
2364.72
12.75
49257
2242.23
8.70
OPTIONS
289607
13782.16
14.63
OPTIONS
TOTAL
34158.96
36044.77
(1885.81)
2264205
115835.84
0.16
TOTAL
4116971
222371.30
24.21
Nifty Spot = 7546.45
Lot Size = 75
Bull-Call Spreads
Bear-Put Spreads
Action
Strike
Price
Risk
Reward
BEP
Action
Strike
Price
Risk
Reward
BEP
Buy
7600
89.45
Buy
7500
81.80
38.80
61.20
7638.80
29.45
70.55
7470.55
Sell
7700
50.65
Sell
7400
52.35
Buy
7600
89.45
Buy
7500
81.80
63.45
136.55
7663.45
49.10
150.90
7450.90
Sell
7800
26.00
Sell
7300
32.70
Buy
7700
50.65
Buy
7400
52.35
24.65
75.35
7724.65
19.65
80.35
7380.35
Sell
7800
26.00
Sell
7300
32.70
Note: Above mentioned Bullish or Bearish Spreads in Nifty (April Series) are given as an information and not as a recommendation.
Nifty Put-Call Analysis
3
Technical & Derivatives Report
April 08, 2016
Daily Pivot Levels for Nifty Constituents
Scrips
S2
S1
PIVOT
R1
R2
ACC
1,398
1,408
1,421
1,431
1,444
ADANIPORTS
208
213
220
225
232
AMBUJACEM
222
224
227
229
232
ASIANPAINT
847
853
861
866
875
AUROPHARMA
724
739
754
769
784
AXISBANK
421
424
428
431
435
BAJAJ-AUTO
2,335
2,357
2,376
2,398
2,417
BANKBARODA
140
142
144
146
148
BHEL
109
114
118
123
127
BPCL
870
878
891
898
911
BHARTIARTL
325
328
332
335
339
INFRATEL
365
369
372
376
378
BOSCH
18,527
18,721
19,085
19,279
19,643
CIPLA
496
501
507
512
518
COALINDIA
274
278
280
283
285
DRREDDY
2,969
3,002
3,039
3,072
3,109
EICHERMOT
18,536
18,710
18,954
19,128
19,372
GAIL
336
339
342
344
347
GRASIM
3,880
3,895
3,915
3,930
3,950
HCLTECH
814
821
834
841
854
HDFCBANK
1,038
1,047
1,056
1,064
1,073
HDFC
1,044
1,058
1,079
1,092
1,113
HEROMOTOCO
2,919
2,944
2,965
2,990
3,012
HINDALCO
85
86
88
89
90
HINDUNILVR
844
852
863
872
883
ICICIBANK
216
218
221
223
226
IDEA
107
108
110
111
113
INDUSINDBK
924
932
945
953
967
INFY
1,155
1,168
1,188
1,202
1,222
ITC
314
317
322
325
330
KOTAKBANK
650
656
662
669
675
LT
1,158
1,170
1,190
1,203
1,222
LUPIN
1,472
1,491
1,506
1,526
1,541
M&M
1,194
1,203
1,219
1,228
1,244
MARUTI
3,386
3,429
3,493
3,535
3,599
NTPC
124
125
126
127
128
ONGC
205
206
208
209
211
POWERGRID
139
140
140
141
142
RELIANCE
1,010
1,024
1,036
1,049
1,062
SBIN
178
180
183
185
188
SUNPHARMA
795
804
813
821
831
TCS
2,443
2,457
2,471
2,485
2,499
TATAMTRDVR
263
270
276
282
289
TATAMOTORS
362
369
377
383
391
TATAPOWER
55
60
65
69
74
TATASTEEL
316
320
326
330
337
TECHM
433
439
449
455
465
ULTRACEMCO
3,062
3,100
3,164
3,202
3,266
WIPRO
544
548
554
558
564
YESBANK
824
830
837
843
850
ZEEL
378
381
386
390
395
4
Technical & Derivatives Report
April 08, 2016
Research Team Tel: 022 - 39357800
For Technical Queries
For Derivatives Queries
DISCLAIMER
Angel Broking Private Limited (hereinafter referred to as “Angel”) is a registered Member of National Stock Exchange of India Limited,
Bombay Stock Exchange Limited and MCX Stock Exchange Limited. It is also registered as a Depository Participant with CDSL and
Portfolio Manager with SEBI. It also has registration with AMFI as a Mutual Fund Distributor. Angel Broking Private Limited is a
registered entity with SEBI for Research Analyst in terms of SEBI (Research Analyst) Regulations, 2014 vide registration number
INH000000164. Angel or its associates has not been debarred/ suspended by SEBI or any other regulatory authority for accessing
/dealing in securities Market. Angel or its associates including its relatives/analyst do not hold any financial interest/beneficial
ownership of more than 1% in the company covered by Analyst. Angel or its associates/analyst has not received any compensation /
managed or co-managed public offering of securities of the company covered by Analyst during the past twelve months. Angel/analyst
has not served as an officer, director or employee of company covered by Analyst and has not been engaged in market making activity
of the company covered by Analyst.
This document is solely for the personal information of the recipient, and must not be singularly used as the basis of any investment
decision. Nothing in this document should be construed as investment or financial advice. Each recipient of this document should
make such investigations as they deem necessary to arrive at an independent evaluation of an investment in the securities of the
companies referred to in this document (including the merits and risks involved), and should consult their own advisors to determine
the merits and risks of such an investment.
Reports based on technical and derivative analysis center on studying charts of a stock's price movement, outstanding positions and
trading volume, as opposed to focusing on a company's fundamentals and, as such, may not match with a report on a company's
fundamentals.
The information in this document has been printed on the basis of publicly available information, internal data and other reliable
sources believed to be true, but we do not represent that it is accurate or complete and it should not be relied on as such, as this
document is for general guidance only. Angel Broking Pvt. Limited or any of its affiliates/ group companies shall not be in any way
responsible for any loss or damage that may arise to any person from any inadvertent error in the information contained in this report.
Angel Broking Pvt. Limited has not independently verified all the information contained within this document. Accordingly, we cannot
testify, nor make any representation or warranty, express or implied, to the accuracy, contents or data contained within this document.
While Angel Broking Pvt. Limited endeavors to update on a reasonable basis the information discussed in this material, there may be
regulatory, compliance, or other reasons that prevent us from doing so.
This document is being supplied to you solely for your information, and its contents, information or data may not be reproduced,
redistributed or passed on, directly or indirectly.
Neither Angel Broking Pvt. Limited, nor its directors, employees or affiliates shall be liable for any loss or damage that may arise from
or in connection with the use of this information.
Note: Please refer to the important ‘Stock Holding Disclosure' report on the Angel website (Research Section). Also, please refer to the
latest update on respective stocks for the disclosure status in respect of those stocks. Angel Broking Pvt. Limited and its affiliates may
have investment positions in the stocks recommended in this report.
5