Technical & Derivatives Report
March 08, 2016
Sensex (24646) / Nifty (7485)
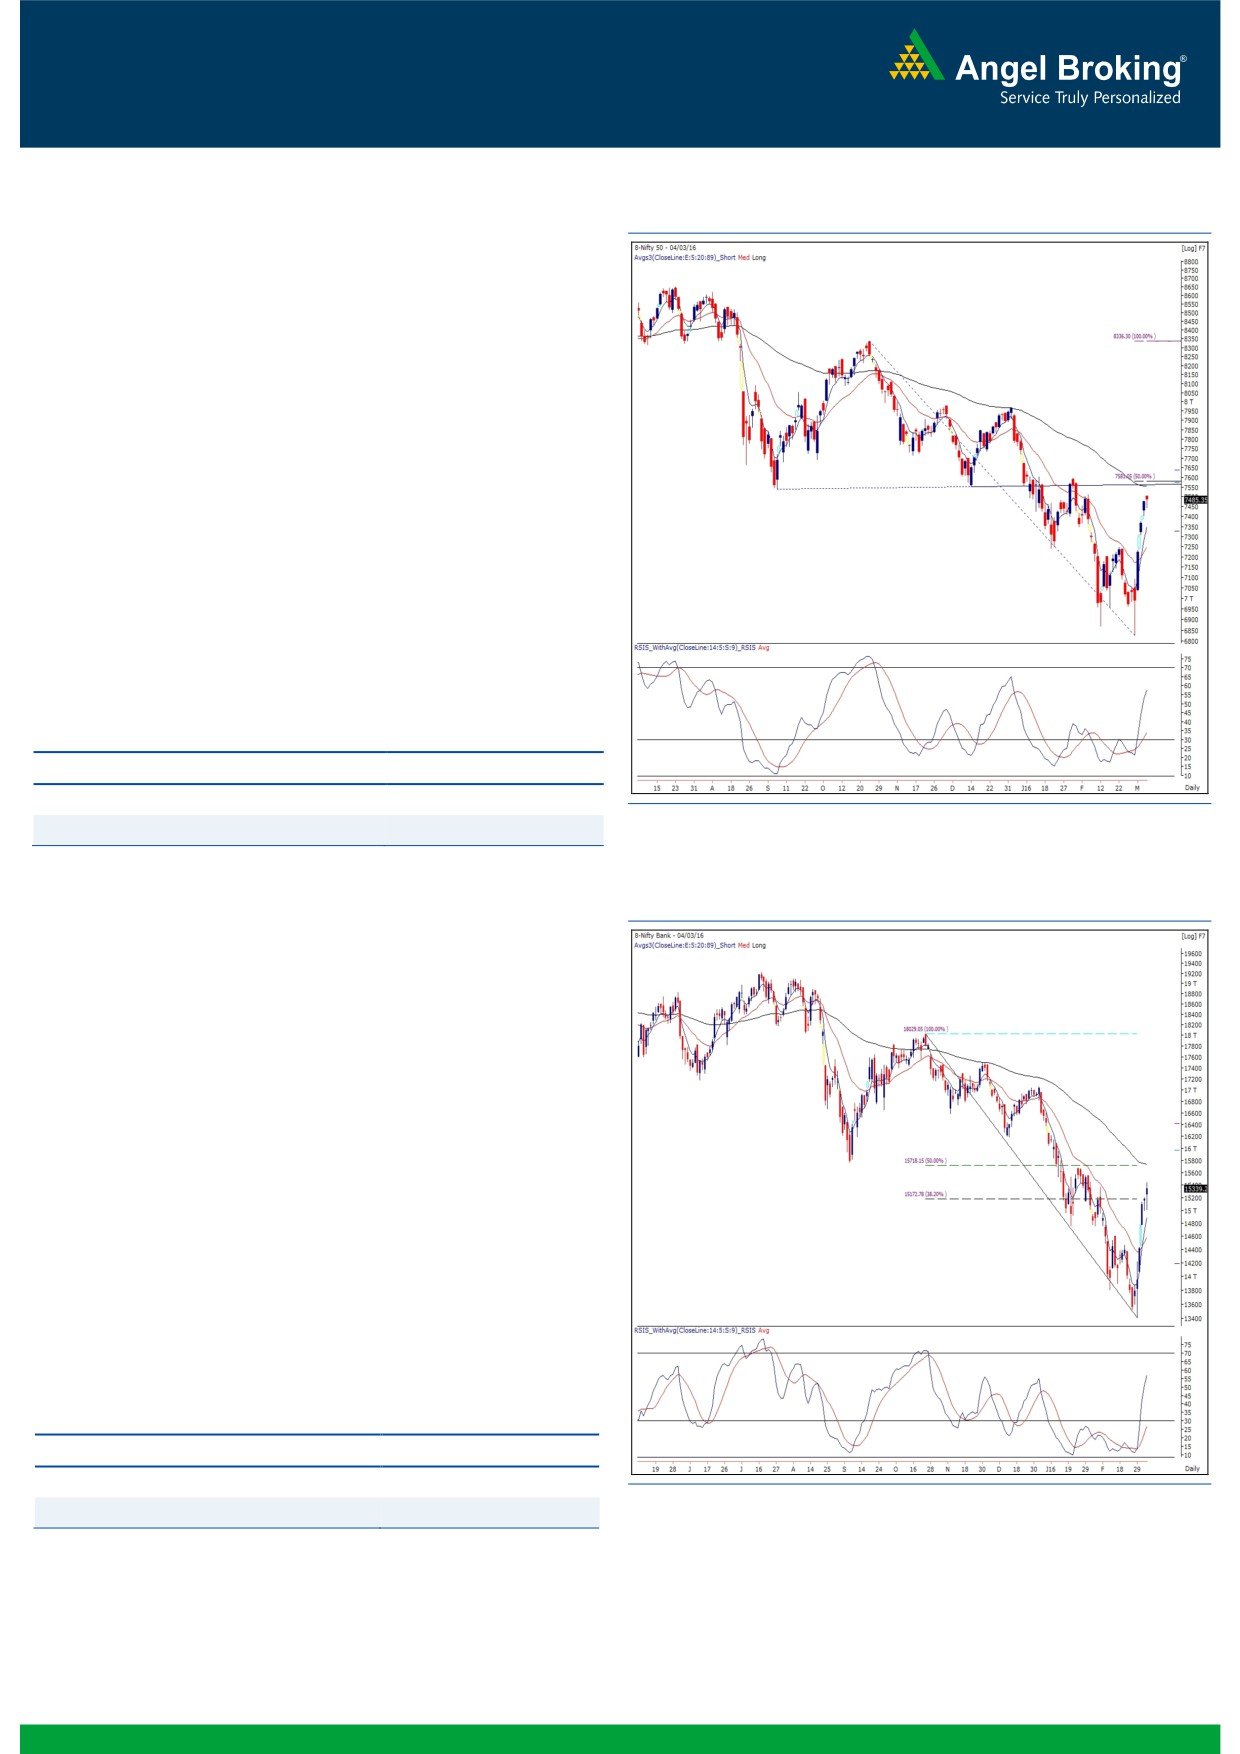
Exhibit 1: Nifty Daily Chart
Post the gap up opening of around 30 points on Friday, the
Nifty corrected in initial hour of the trade. However, it traded
in a narrow range in remaining part of the session and closed
with the negligible gain of 0.13 percent over its previous close.
At the current juncture, the Nifty is trading near its resistance
of 7550 (previous breakdown level) on the daily chart, which
coincides with the ‘89 DEMA’ and 50% retracement level of
the previous down move from
8336.30 to
6825.80.
Considering multiple resistances, a minor pull back cannot be
ruled out although the overall view remains positive. We
advise traders not to get carried away in the anticipated
corrective price action and suggest towards remaining light on
positions until there is a decisive development on the charts.
Going forward, immediate resistance for index is placed at
7550 - 7600 levels; whereas, support is visible at 7440 and
7390 levels.
Key Levels
Support 1 - 7440
Resistance 1 - 7550
Support 2 - 7390
Resistance 2 -
7600
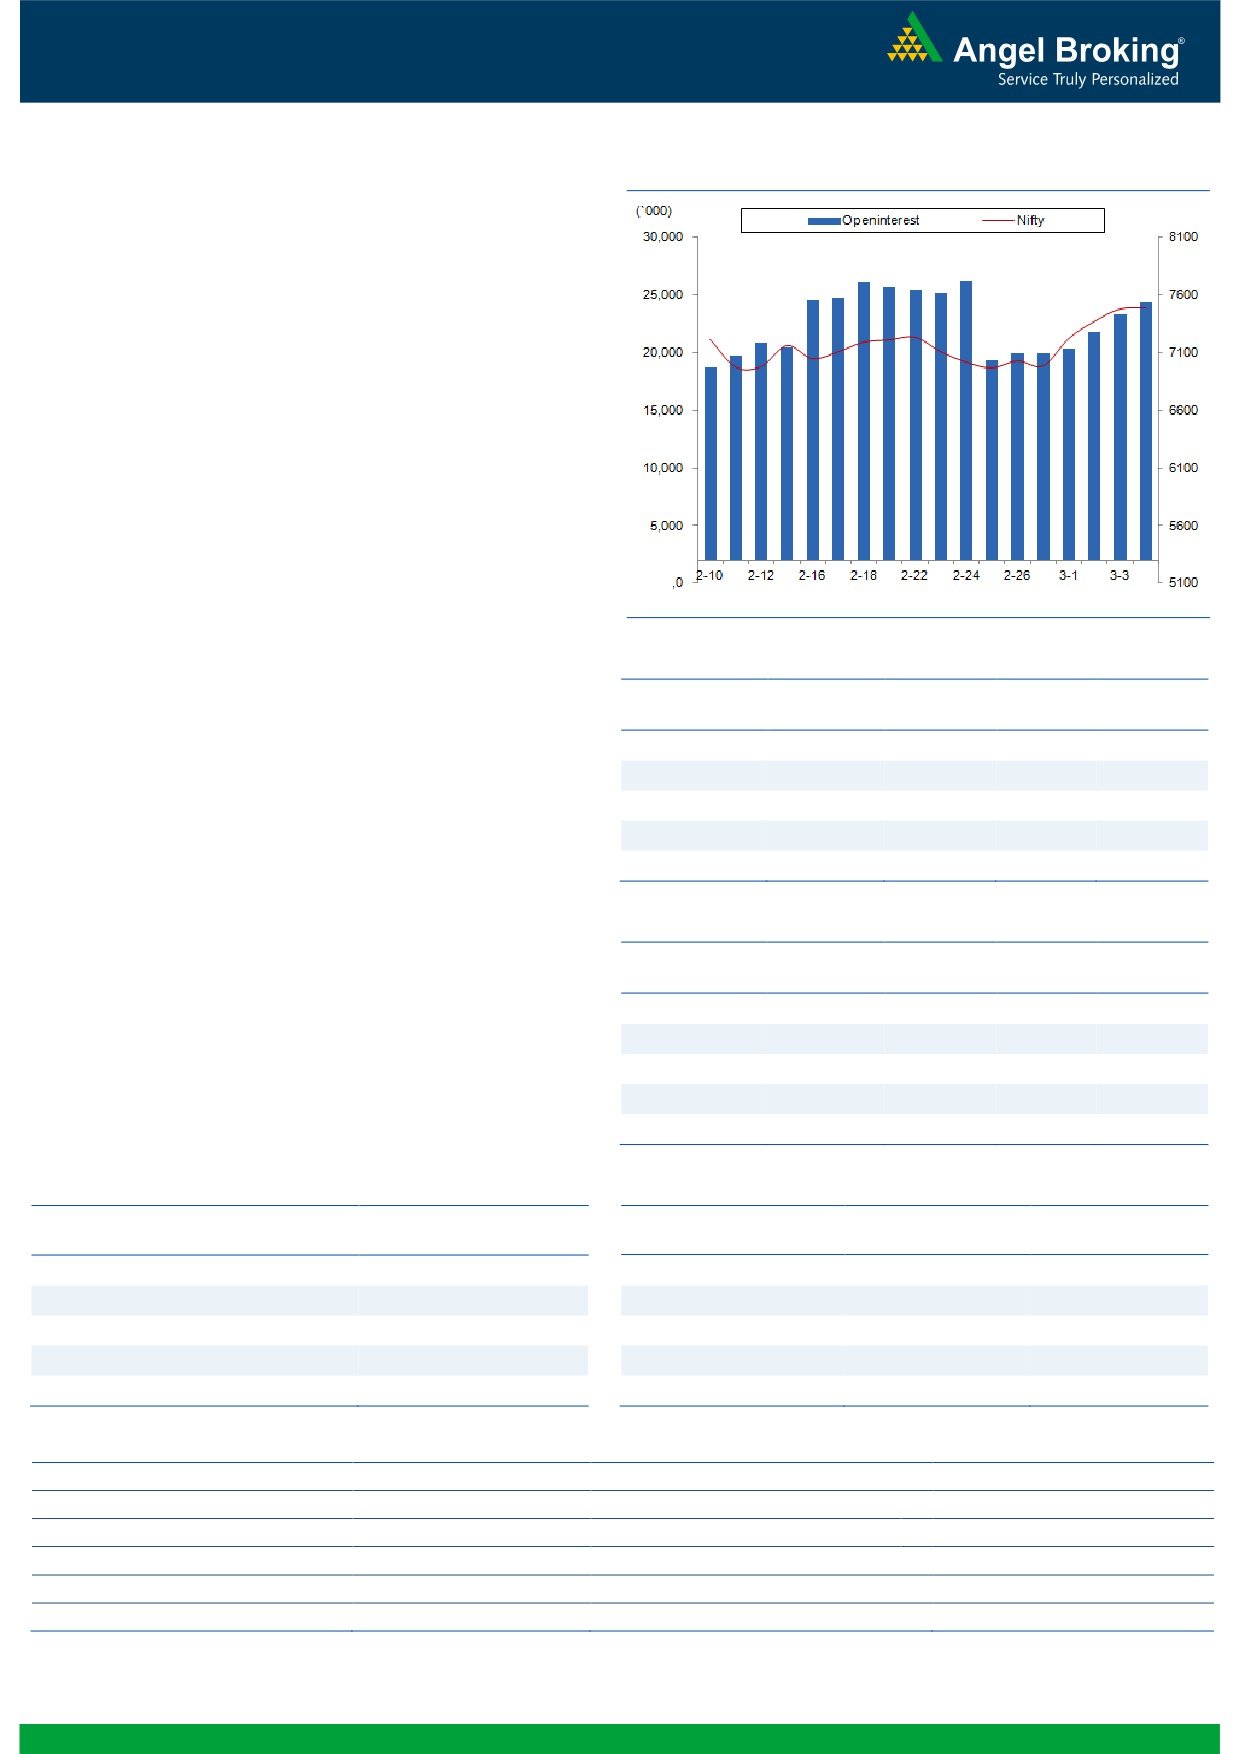
Exhibit 2: Nifty Bank Daily Chart
Nifty Bank Outlook - (15339)
On Friday, the Nifty Bank index opened with an upside gap of
around 66 points and started correcting from the first tick. But,
post the corrective move in the initial hour, the banking index
rebounded stridently and continued to move higher to close
with a gain of 1.06 percent.
On Friday, the banking index has taken support around
Thursday’s low of 15000 and bounced back piercingly to
close above immediate resistance of 38.20% retracement level
of the previous down move from 18029.05 to 13407.25 on
daily chart. Now, the 50% retracement of the mentioned fall
will act as immediate resistance for the index, which coincides
with ’89 EMA’ on daily chart. Current chart structure suggests
extension in ongoing up move towards 15700 - 15850 levels;
thus, traders should trade with positive bias. On the flipside,
immediate support is placed at 15000 mark.
Key Levels
Support 1 - 15125
Resistance 1 - 15700
Support 2 - 15000
Resistance 2 - 15850
1
Technical & Derivatives Report
March 08, 2016
Comments
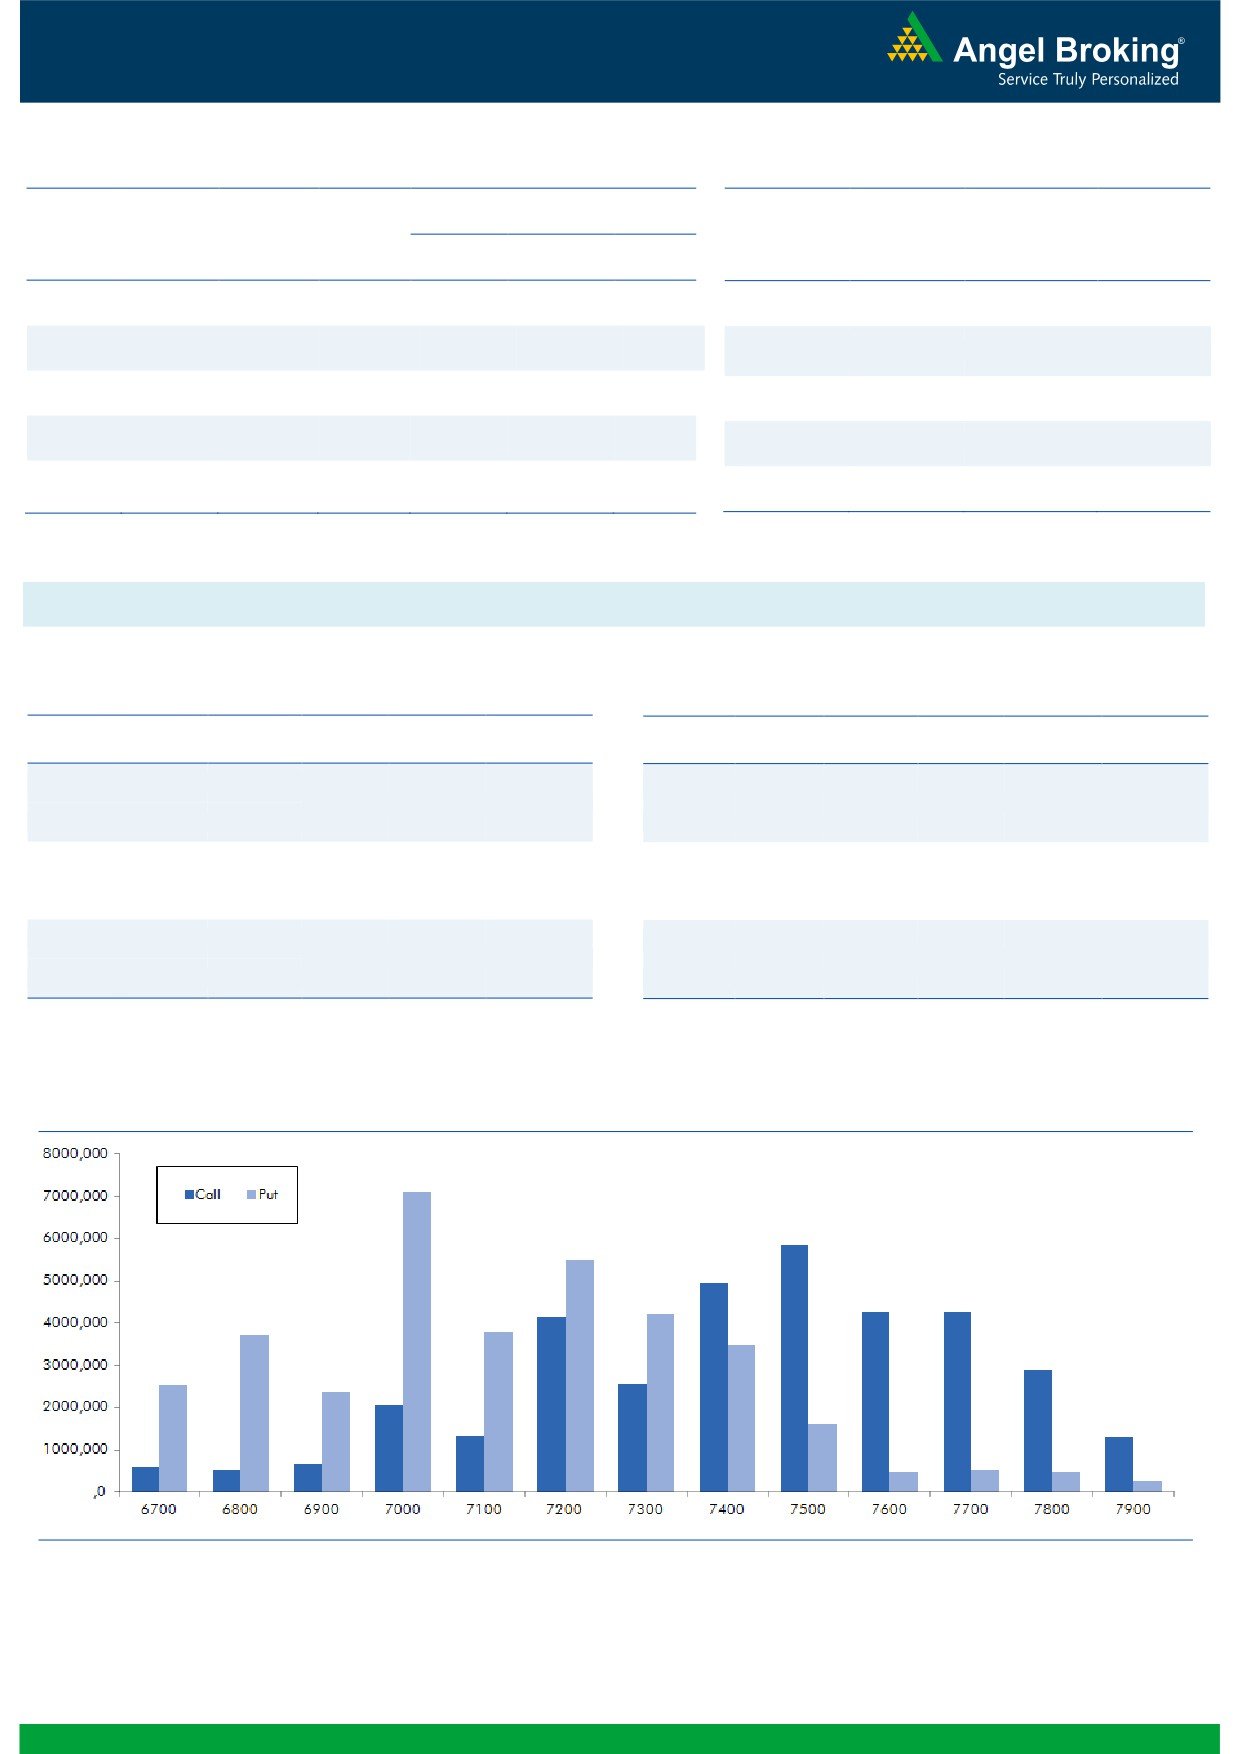
Nifty Vs OI
The Nifty futures open interest has increased by 4.48%
BankNifty futures open interest has decreased by 0.89%
as market closed at 7485.35 levels.
The Nifty March future closed at a discount of 25.00
points against a discount of 26.05 points. The April
series closed at a premium of 2.40 points.
The Implied Volatility of at the money options has
decreased from 15.55% to 15.19%.
The total OI of the market is Rs. 2,12,493/- cr. and the
stock futures OI is Rs. 56,552/- cr.
Few of the liquid counters where we have seen high cost
of carry are UNITECH, GMRINFRA, IDFC, HDIL and
FEDERALBNK.
OI Gainers
Views
OI
PRICE
FIIs continue buying in both cash and F&O segment.
SCRIP
OI
PRICE
CHG. (%)
CHG. (%)
They bought equities to the tune of Rs. 671 crores. While
MINDTREE
1518400
44.39
1486.80
0.31
in Index Futures, they were net buyers of Rs. 147 crores
KSCL
1623750
28.79
389.70
9.40
with good amount of rise in OI, suggesting blend of long
JUSTDIAL
2436000
20.59
691.55
8.18
and short formation.
ACC
1388625
15.65
1235.90
-1.58
In Index Options front, FIIs sold of worth Rs. 246 crores
PETRONET
4965000
14.37
240.25
-4.34
with decent amount of rise in OI. In call options, 7500-
7700 strikes were active and they also added some
OI Losers
build-up. Whereas, in put options, we hardly saw any
OI
PRICE
meaningful activity. Maximum OI in current series is
SCRIP
OI
PRICE
CHG. (%)
CHG. (%)
visible in 7500 call and 7000 put options. Seeing the
HEXAWARE
2202000
-10.85
259.45
1.99
quantum of buying in equities & Index Futures from past
RELINFRA
7064200
-10.40
460.90
0.90
three to four trading sessions, we believe Nifty may
BEML
437000
-9.05
1055.05
1.22
continue to show strength. Trade with a positive bias.
BHEL
29062000
-8.76
107.50
3.81
IDBI
34600000
-8.48
68.15
4.44
Historical Volatility
Put-Call Ratio
SCRIP
HV
SCRIP
PCR-OI
PCR-VOL
KSCL
76.89
NIFTY
1.00
0.88
OFSS
37.46
BANKNIFTY
1.11
0.76
SRF
52.11
SBIN
0.90
0.47
SYNDIBANK
74.01
ICICIBANK
0.94
0.74
JUSTDIAL
144.07
MARUTI
1.11
0.96
Strategy Date
Symbol
Strategy
Status
February 29, 2016
RELIANCE
Ratio Bull Call Spread
Active
2
Technical & Derivatives Report
March 08, 2016
FII Statistics for 04-March 2016
Turnover on 04-March 2016
Open Interest
No. of
Turnover
Change
Detail
Buy
Sell
Net
Instrument
Value
Change
Contracts
( in Cr. )
(%)
Contracts
(in Cr.)
(%)
INDEX
INDEX
1818.40
1670.98
147.42
277359
15048.14
6.41
318830
16212.56
3.57
FUTURES
FUTURES
INDEX
INDEX
29387.59
29633.61
(246.02)
1268446
70402.85
2.44
2936926
159713.85
5.99
OPTIONS
OPTIONS
STOCK
4340.39
4040.20
300.19
1075198
48210.67
(0.77)
STOCK
FUTURES
598287
26541.63
1.73
FUTURES
STOCK
STOCK
2396.16
2393.99
2.17
58622
2613.38
11.67
OPTIONS
307486
13728.27
-2.90
OPTIONS
TOTAL
37942.53
37738.79
203.74
2679625
136275.03
1.70
TOTAL
4161529
216196.32
4.66
Nifty Spot = 7485.35
Lot Size = 75
Bull-Call Spreads
Bear-Put Spreads
Action
Strike
Price
Risk
Reward
BEP
Action
Strike
Price
Risk
Reward
BEP
Buy
7500
104.40
Buy
7400
110.20
40.15
59.85
7540.15
31.95
68.05
7368.05
Sell
7600
64.25
Sell
7300
78.25
Buy
7500
104.40
Buy
7400
110.20
68.20
131.80
7568.20
55.00
145.00
7345.00
Sell
7700
36.20
Sell
7200
55.20
Buy
7600
64.25
Buy
7300
78.25
28.05
71.95
7628.05
23.05
76.95
7276.95
Sell
7700
36.20
Sell
7200
55.20
Note: Above mentioned Bullish or Bearish Spreads in Nifty (March Series) are given as an information and not as a recommendation.
Nifty Put-Call Analysis
3
Technical & Derivatives Report
March 08, 2016
Daily Pivot Levels for Nifty 50 Stocks
Scrips
S2
S1
PIVOT
R1
R2
ACC
1,218
1,229
1,242
1,253
1,266
ADANIPORTS
219
222
225
229
232
AMBUJACEM
198
200
202
204
205
ASIANPAINT
840
853
871
884
903
AXISBANK
406
411
414
420
423
BAJAJ-AUTO
2,250
2,265
2,278
2,293
2,305
BANKBARODA
141
145
148
152
155
BHARTIARTL
321
325
331
335
341
BHEL
100
104
106
110
112
BOSCHLTD
17,014
17,151
17,290
17,427
17,567
BPCL
776
795
807
826
838
CAIRN
124
126
129
131
135
CIPLA
523
530
538
545
553
COALINDIA
309
317
322
330
335
DRREDDY
3,162
3,208
3,245
3,291
3,328
GAIL
327
334
339
346
351
GRASIM
3,418
3,467
3,499
3,547
3,580
HCLTECH
812
823
842
854
873
HDFC
1,093
1,111
1,123
1,141
1,153
HDFCBANK
981
1,001
1,013
1,033
1,045
HEROMOTOCO
2,760
2,798
2,826
2,865
2,893
HINDALCO
75
77
80
82
84
HINDUNILVR
840
845
848
852
855
ICICIBANK
216
218
221
224
227
IDEA
106
107
108
110
111
INDUSINDBK
866
891
906
931
946
INFY
1,146
1,158
1,172
1,184
1,197
ITC
310
313
317
320
324
KOTAKBANK
635
650
660
675
685
LT
1,164
1,179
1,201
1,216
1,238
LUPIN
1,757
1,768
1,782
1,793
1,807
M&M
1,200
1,208
1,219
1,227
1,237
MARUTI
3,474
3,514
3,567
3,607
3,660
NTPC
122
124
126
128
130
ONGC
196
198
201
204
207
PNB
75
79
82
86
89
POWERGRID
135
135
136
136
137
RELIANCE
997
1,002
1,008
1,013
1,020
SBIN
174
181
186
193
197
VEDL
80
84
87
91
94
SUNPHARMA
839
848
861
870
883
TATAMOTORS
334
339
344
349
354
TATAPOWER
58
59
59
60
60
TATASTEEL
281
285
288
292
295
TCS
2,332
2,345
2,362
2,375
2,393
TECHM
442
447
454
459
466
ULTRACEMCO
2,854
2,880
2,922
2,949
2,991
WIPRO
529
533
539
543
550
YESBANK
734
746
758
771
782
ZEEL
388
392
396
400
403
4
Technical & Derivatives Report
March 08, 2016
Research Team Tel: 022 - 39357800
For Technical Queries
For Derivatives Queries
DISCLAIMER
Angel Broking Private Limited (hereinafter referred to as “Angel”) is a registered Member of National Stock Exchange of India Limited,
Bombay Stock Exchange Limited and MCX Stock Exchange Limited. It is also registered as a Depository Participant with CDSL and
Portfolio Manager with SEBI. It also has registration with AMFI as a Mutual Fund Distributor. Angel Broking Private Limited is a
registered entity with SEBI for Research Analyst in terms of SEBI (Research Analyst) Regulations, 2014 vide registration number
INH000000164. Angel or its associates has not been debarred/ suspended by SEBI or any other regulatory authority for accessing
/dealing in securities Market. Angel or its associates including its relatives/analyst do not hold any financial interest/beneficial
ownership of more than 1% in the company covered by Analyst. Angel or its associates/analyst has not received any compensation /
managed or co-managed public offering of securities of the company covered by Analyst during the past twelve months. Angel/analyst
has not served as an officer, director or employee of company covered by Analyst and has not been engaged in market making activity
of the company covered by Analyst.
This document is solely for the personal information of the recipient, and must not be singularly used as the basis of any investment
decision. Nothing in this document should be construed as investment or financial advice. Each recipient of this document should
make such investigations as they deem necessary to arrive at an independent evaluation of an investment in the securities of the
companies referred to in this document (including the merits and risks involved), and should consult their own advisors to determine
the merits and risks of such an investment.
Reports based on technical and derivative analysis center on studying charts of a stock's price movement, outstanding positions and
trading volume, as opposed to focusing on a company's fundamentals and, as such, may not match with a report on a company's
fundamentals.
The information in this document has been printed on the basis of publicly available information, internal data and other reliable
sources believed to be true, but we do not represent that it is accurate or complete and it should not be relied on as such, as this
document is for general guidance only. Angel Broking Pvt. Limited or any of its affiliates/ group companies shall not be in any way
responsible for any loss or damage that may arise to any person from any inadvertent error in the information contained in this report.
Angel Broking Pvt. Limited has not independently verified all the information contained within this document. Accordingly, we cannot
testify, nor make any representation or warranty, express or implied, to the accuracy, contents or data contained within this document.
While Angel Broking Pvt. Limited endeavors to update on a reasonable basis the information discussed in this material, there may be
regulatory, compliance, or other reasons that prevent us from doing so.
This document is being supplied to you solely for your information, and its contents, information or data may not be reproduced,
redistributed or passed on, directly or indirectly.
Neither Angel Broking Pvt. Limited, nor its directors, employees or affiliates shall be liable for any loss or damage that may arise from
or in connection with the use of this information.
Note: Please refer to the important ‘Stock Holding Disclosure' report on the Angel website (Research Section). Also, please refer to the
latest update on respective stocks for the disclosure status in respect of those stocks. Angel Broking Pvt. Limited and its affiliates may
have investment positions in the stocks recommended in this report.
5