Technical & Derivatives Report
February 08, 2016
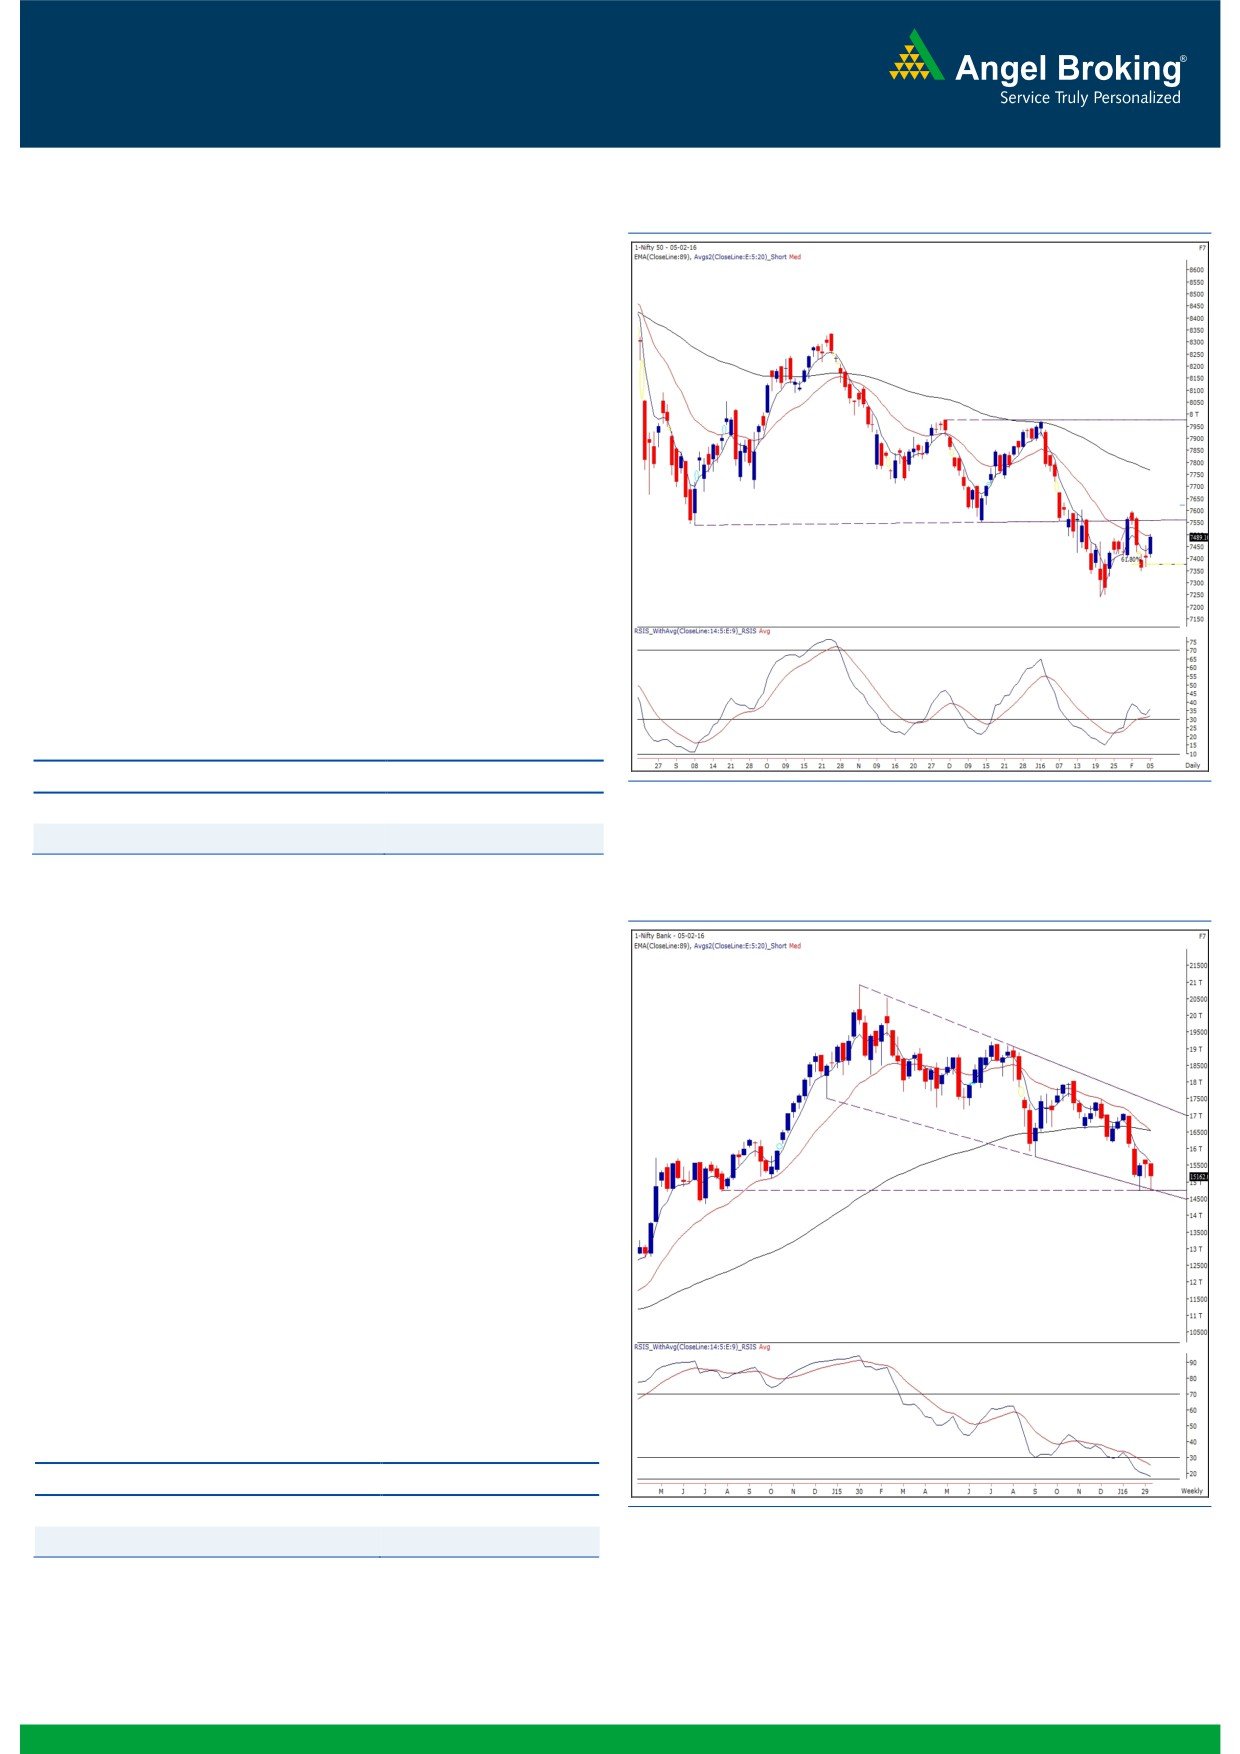
Sensex (24617) / Nifty (7489)
Exhibit 1: Nifty Daily Chart
Despite couple of weak sessions in the first half, we
maintained our stance of avoiding shorting and suggested
investors towards not getting carried away by the pessimism.
This view was mainly based on our few key observations.
Firstly, there was a confirmation of a ‘Dragonfly Doji’ pattern
on the weekly chart. Secondly, we saw 7360 and 7320 as
strong support levels, which are the
61.8% and
78.6%
retracement of the recent up, respectively. The movement in
the Nifty that followed validated our view, given Friday’s
closing. In the forthcoming week, we expect the Nifty to extend
this move first towards 7600.45 and then to test the 7700
mark.
Going by this hypothesis, we may expect Wednesday’s low of
7350.30 to form a probable ‘Higher Bottom’ on the daily
chart. Thus, it should act as an immediate as well as important
support for the index. A sustainable move below this support
may nullify our above mentioned hypothesis.
Key Levels
Support 1 - 7406
Resistance 1 - 7505
Support 2 - 7350
Resistance 2 -
7600
Exhibit 2: Bank Nifty Weekly Chart
Bank Nifty Outlook - (15162)
On Friday, the Nifty Bank index opened with marginal gains
and started moving higher from the initial trades. After a
sharp up move in first couple of hours of trading, the banking
index remained sideways for quite some time. However, we
witnessed a resumption of early morning optimism towards
the fag end to push the Nifty Bank index higher to close with
decent gains of 1.97 percent over its previous close.
At current juncture, the banking index is in process of forming
a ‘Double Bottom’ pattern around the lower end of the ‘Falling
Channel’ on the weekly chart (please refer the exhibit). The
formation of such pattern around the support zone is an
encouraging sign for the bulls. Going forward, 14970 and
14750 levels would now act as important supports for the
Nifty Bank index; while, the immediate resistance for the index
would be seen at 15350 and 15565 levels.
Key Levels
Support 1 - 14970
Resistance 1 - 15350
Support 2 - 14750
Resistance 2 - 15565
1
Technical & Derivatives Report
February 08, 2016
Comments
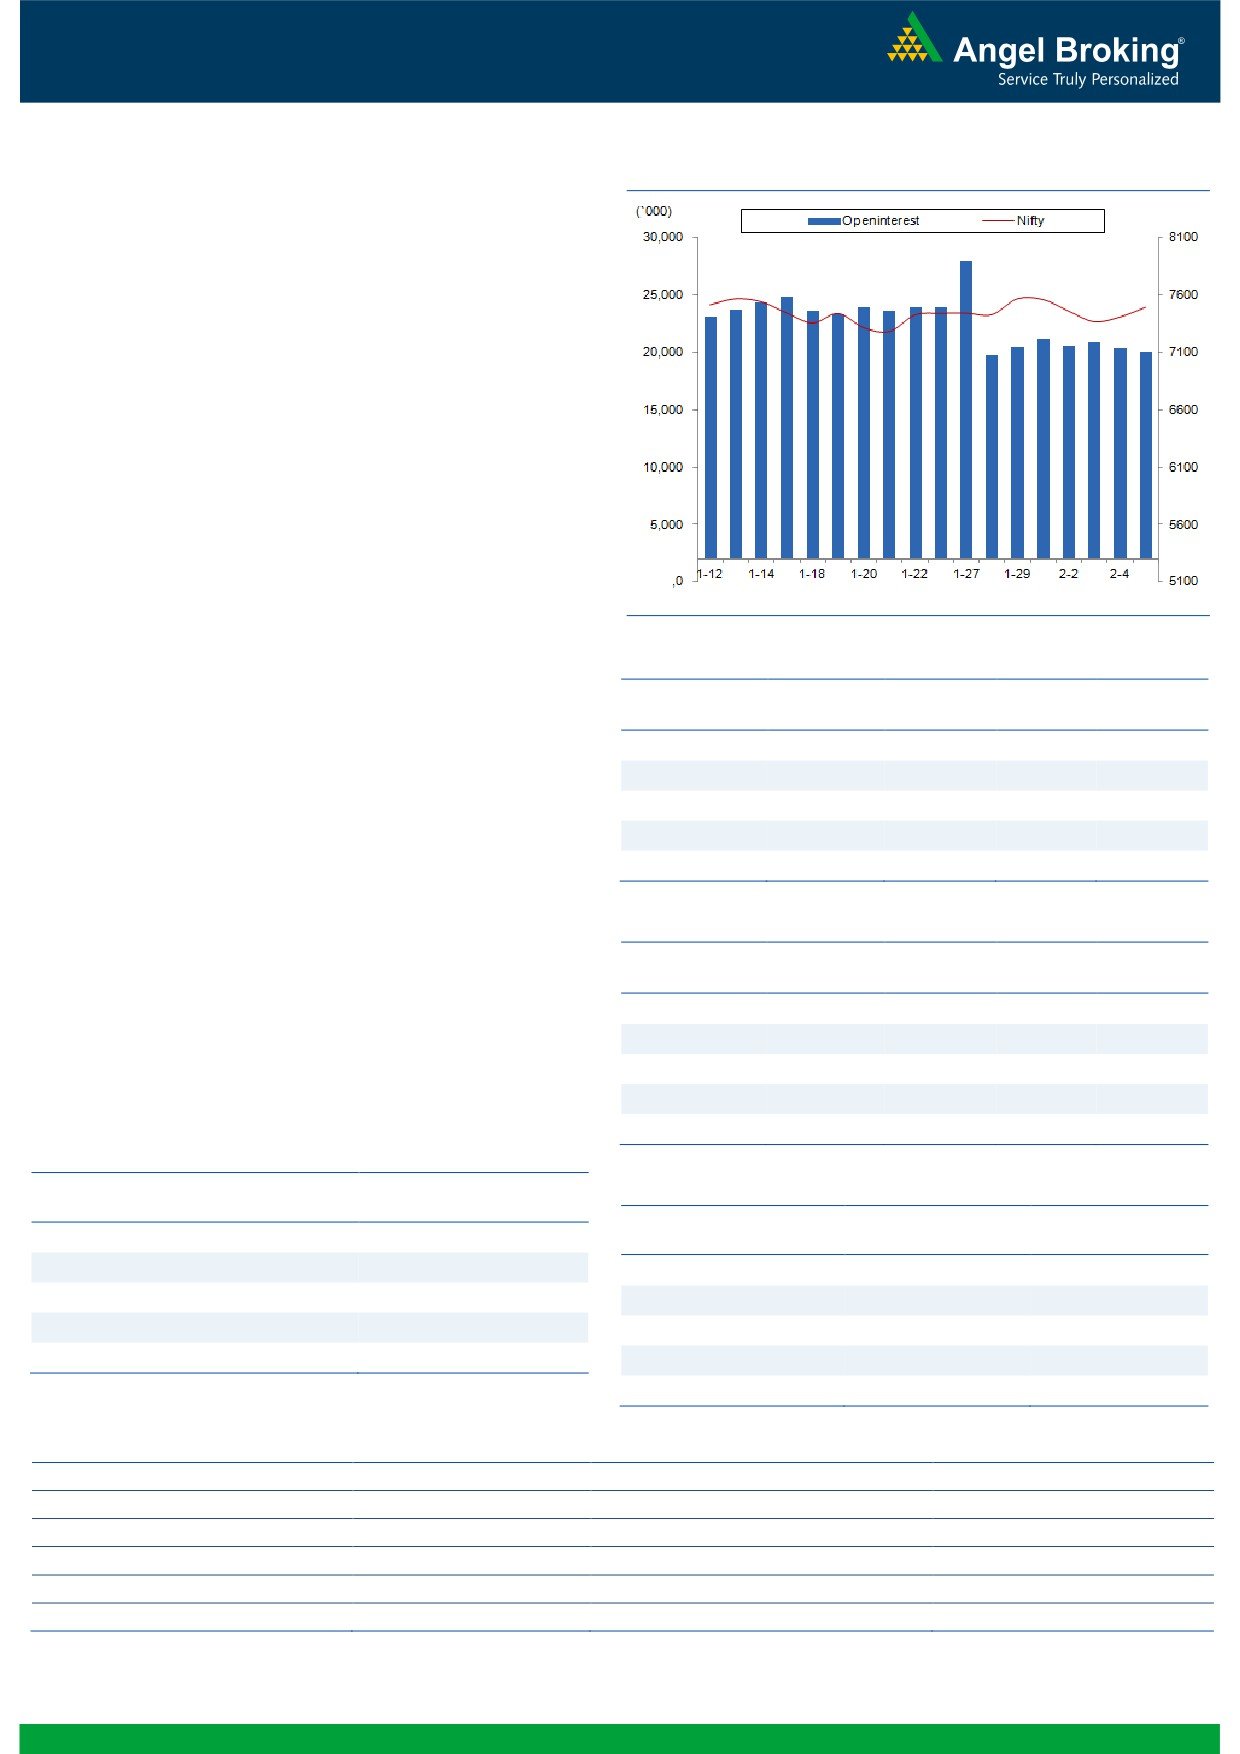
Nifty Vs OI
The Nifty futures open interest has decreased by 1.49%
BankNifty futures open interest has increased by 1.17%
as market closed at 7489.10 levels.
The Nifty February future closed at a premium of 30.10
points against a premium of 18.65 points. The March
series closed at a premium of 48.75 points.
The Implied Volatility of at the money options has
decreased from 16.34% to 16.07%.
The total OI of the market is Rs. 2,08,436/- cr. and the
stock futures OI is Rs. 60,685/- cr.
Few of the liquid counters where we have seen high cost
of carry are UNITECH, JUBLFOOD, GMRINFRA,
SOUTHBANK and NCC.
OI Gainers
Views
OI
PRICE
FIIs were net net sellers in cash market segment to the
SCRIP
OI
PRICE
CHG. (%)
CHG. (%)
tune of Rs. 606 crores. While in Index Futures, they
OIL
903600
15.85
343.20
0.18
bought marginally with good amount of rise in open
MINDTREE
406800
14.14
1499.40
0.84
interest indicating blend of fresh long and short in last
LUPIN
4192800
13.17
1811.45
9.55
trading session.
ARVIND
4547500
11.18
286.00
-1.12
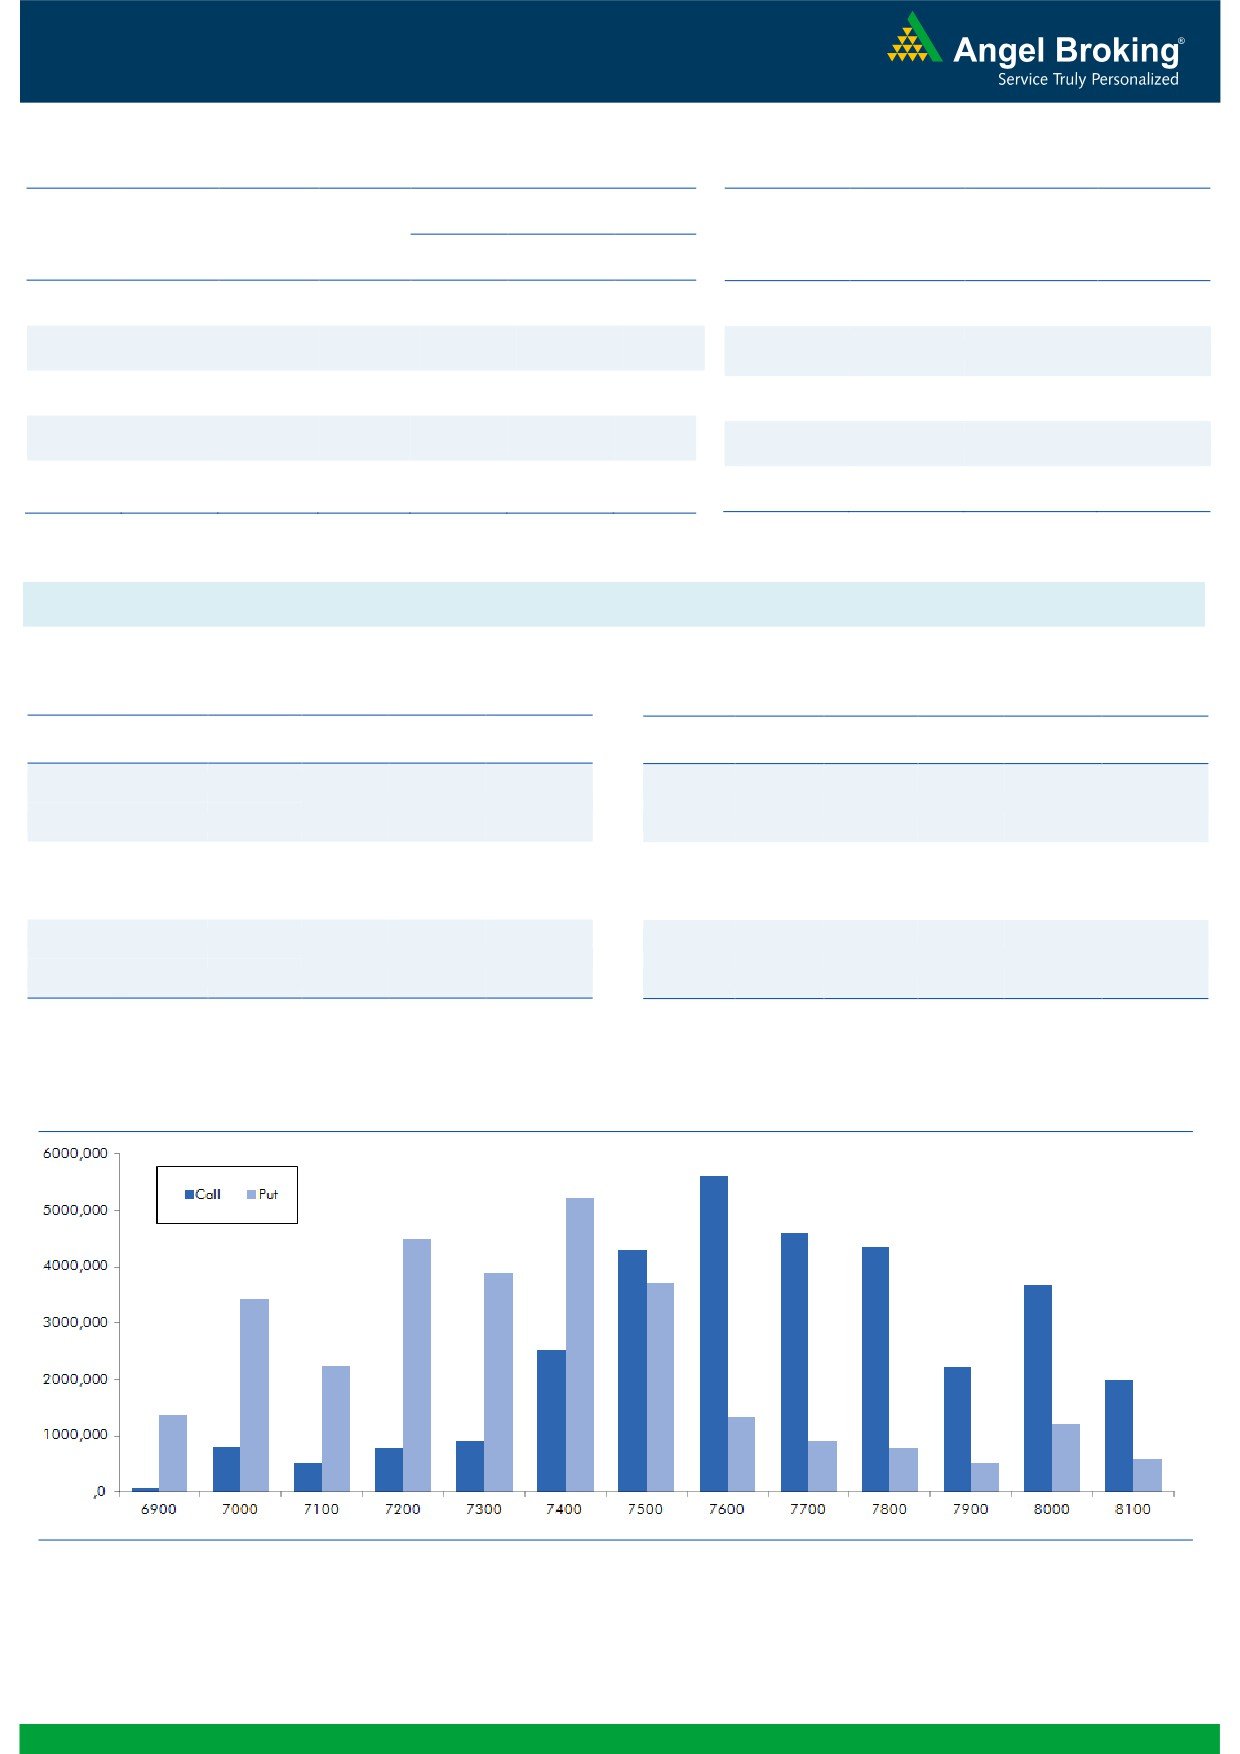
In Index Options front, they were net buyers of Rs. 1404
JETAIRWAYS
5146200
10.11
573.25
8.04
crores with rise in OI. In call options, we hardly saw any
meaningful activity. While in put options, 7400-7500
OI Losers
strikes added decent build-up. Maximum OI in current
OI
PRICE
series is visible in 7600 call and 7400 put options.
SCRIP
OI
PRICE
CHG. (%)
CHG. (%)
Seeing the above data we believe Nifty may trade in a
HEXAWARE
3376000
-10.40
244.25
4.27
range, short strangle can be a good strategy to trade in
AMARAJABAT
769800
-8.88
884.10
3.64
Nifty.
HAVELLS
4846000
-6.70
300.75
2.28
AJANTPHARM
412000
-5.33
1312.70
1.80
SAIL
38277000
-5.26
40.45
7.87
Historical Volatility
Put-Call Ratio
SCRIP
HV
LUPIN
49.74
SCRIP
PCR-OI
PCR-VOL
IDFC
45.41
NIFTY
0.83
0.84
SAIL
69.08
BANKNIFTY
0.84
0.64
CANBK
59.96
SBIN
0.60
0.44
BATAINDIA
45.75
ICICIBANK
0.53
0.39
MARUTI
0.42
0.34
Strategy Date
Symbol
Strategy
Status
February 01, 2016
BHEL
Bull Call Spread
Active
2
Technical & Derivatives Report
February 08, 2016
FII Statistics for 05-February 2016
Turnover on 05-February 2016
Open Interest
No. of
Turnover
Change
Detail
Buy
Sell
Net
Instrument
Value
Change
Contracts
( in Cr. )
(%)
Contracts
(in Cr.)
(%)
INDEX
INDEX
1479.02
1455.39
23.63
217880
11752.83
3.55
303956
15787.75
4.82
FUTURES
FUTURES
INDEX
INDEX
33578.52
32173.55
1404.97
1137167
63033.21
3.59
3087100
170025.82
6.50
OPTIONS
OPTIONS
STOCK
4095.87
4255.11
(159.24)
1129297
50347.30
1.05
STOCK
FUTURES
635699
28459.76
1.05
FUTURES
STOCK
STOCK
3054.12
3021.14
32.98
56665
2513.14
9.58
OPTIONS
380242
17522.59
8.64
OPTIONS
TOTAL
42207.53
40905.19
1302.34
2541009
127646.49
2.57
TOTAL
4406997
231795.92
5.84
Nifty Spot = 7489.10
Lot Size = 75
Bull-Call Spreads
Bear-Put Spreads
Action
Strike
Price
Risk
Reward
BEP
Action
Strike
Price
Risk
Reward
BEP
Buy
7500
119.45
Buy
7500
103.10
47.50
52.50
7547.50
35.80
64.20
7464.20
Sell
7600
71.95
Sell
7400
67.30
Buy
7500
119.45
Buy
7500
103.10
80.45
119.55
7580.45
60.00
140.00
7440.00
Sell
7700
39.00
Sell
7300
43.10
Buy
7600
71.95
Buy
7400
67.30
32.95
67.05
7632.95
24.20
75.80
7375.80
Sell
7700
39.00
Sell
7300
43.10
Note: Above mentioned Bullish or Bearish Spreads in Nifty (Feb. Series) are given as an information and not as a recommendation.
Nifty Put-Call Analysis
3
Technical & Derivatives Report
February 08, 2016
Daily Pivot Levels for Nifty 50 Stocks
Scrips
S2
S1
PIVOT
R1
R2
ACC
1,245
1,258
1,272
1,285
1,299
ADANIPORTS
204
207
213
216
222
AMBUJACEM
191
193
196
199
202
ASIANPAINT
879
889
896
906
913
AXISBANK
376
388
396
408
417
BAJAJ-AUTO
2,274
2,320
2,349
2,396
2,425
BANKBARODA
119
123
126
129
132
BHARTIARTL
299
303
306
310
312
BHEL
127
130
132
135
137
BOSCHLTD
14,796
15,443
16,546
17,193
18,296
BPCL
819
831
839
851
859
CAIRN
118
123
125
130
133
CIPLA
533
552
563
581
592
COALINDIA
308
317
327
336
346
DRREDDY
2,945
3,027
3,076
3,158
3,206
GAIL
329
336
345
352
362
GRASIM
3,403
3,433
3,457
3,487
3,510
HCLTECH
850
860
868
878
887
HDFC
1,162
1,173
1,179
1,190
1,196
HDFCBANK
1,037
1,046
1,055
1,064
1,073
HEROMOTOCO
2,476
2,530
2,560
2,614
2,644
HINDALCO
67
69
71
73
74
HINDUNILVR
818
831
843
857
869
ICICIBANK
201
205
208
212
215
IDEA
99
100
101
102
103
INDUSINDBK
904
908
913
917
921
INFY
1,163
1,169
1,178
1,184
1,193
ITC
320
322
324
326
328
KOTAKBANK
666
679
688
701
710
LT
1,114
1,127
1,139
1,152
1,165
LUPIN
1,527
1,665
1,741
1,879
1,955
M&M
1,184
1,202
1,212
1,230
1,241
MARUTI
3,639
3,681
3,736
3,778
3,832
NTPC
123
124
125
126
128
ONGC
215
218
220
222
224
PNB
89
92
94
97
99
POWERGRID
143
144
146
147
149
RELIANCE
951
961
971
981
992
SBIN
159
164
167
171
174
VEDL
65
70
72
76
79
SUNPHARMA
828
843
851
866
875
TATAMOTORS
322
330
334
342
347
TATAPOWER
59
60
60
61
61
TATASTEEL
207
220
229
243
252
TCS
2,391
2,407
2,423
2,439
2,455
TECHM
465
470
473
478
481
ULTRACEMCO
2,756
2,799
2,825
2,868
2,893
WIPRO
549
554
560
564
570
YESBANK
751
764
772
785
793
ZEEL
386
398
404
416
422
4
Technical & Derivatives Report
February 08, 2016
Research Team Tel: 022 - 39357800
For Technical Queries
For Derivatives Queries
DISCLAIMER
Angel Broking Private Limited (hereinafter referred to as “Angel”) is a registered Member of National Stock Exchange of India Limited,
Bombay Stock Exchange Limited and MCX Stock Exchange Limited. It is also registered as a Depository Participant with CDSL and
Portfolio Manager with SEBI. It also has registration with AMFI as a Mutual Fund Distributor. Angel Broking Private Limited is a
registered entity with SEBI for Research Analyst in terms of SEBI (Research Analyst) Regulations, 2014 vide registration number
INH000000164. Angel or its associates has not been debarred/ suspended by SEBI or any other regulatory authority for accessing
/dealing in securities Market. Angel or its associates including its relatives/analyst do not hold any financial interest/beneficial
ownership of more than 1% in the company covered by Analyst. Angel or its associates/analyst has not received any compensation /
managed or co-managed public offering of securities of the company covered by Analyst during the past twelve months. Angel/analyst
has not served as an officer, director or employee of company covered by Analyst and has not been engaged in market making activity
of the company covered by Analyst.
This document is solely for the personal information of the recipient, and must not be singularly used as the basis of any investment
decision. Nothing in this document should be construed as investment or financial advice. Each recipient of this document should
make such investigations as they deem necessary to arrive at an independent evaluation of an investment in the securities of the
companies referred to in this document (including the merits and risks involved), and should consult their own advisors to determine
the merits and risks of such an investment.
Reports based on technical and derivative analysis center on studying charts of a stock's price movement, outstanding positions and
trading volume, as opposed to focusing on a company's fundamentals and, as such, may not match with a report on a company's
fundamentals.
The information in this document has been printed on the basis of publicly available information, internal data and other reliable
sources believed to be true, but we do not represent that it is accurate or complete and it should not be relied on as such, as this
document is for general guidance only. Angel Broking Pvt. Limited or any of its affiliates/ group companies shall not be in any way
responsible for any loss or damage that may arise to any person from any inadvertent error in the information contained in this report.
Angel Broking Pvt. Limited has not independently verified all the information contained within this document. Accordingly, we cannot
testify, nor make any representation or warranty, express or implied, to the accuracy, contents or data contained within this document.
While Angel Broking Pvt. Limited endeavors to update on a reasonable basis the information discussed in this material, there may be
regulatory, compliance, or other reasons that prevent us from doing so.
This document is being supplied to you solely for your information, and its contents, information or data may not be reproduced,
redistributed or passed on, directly or indirectly.
Neither Angel Broking Pvt. Limited, nor its directors, employees or affiliates shall be liable for any loss or damage that may arise from
or in connection with the use of this information.
Note: Please refer to the important ‘Stock Holding Disclosure' report on the Angel website (Research Section). Also, please refer to the
latest update on respective stocks for the disclosure status in respect of those stocks. Angel Broking Pvt. Limited and its affiliates may
have investment positions in the stocks recommended in this report.
5