Technical & Derivatives Report
December 07, 2015
Sensex (25638) / Nifty (7782)
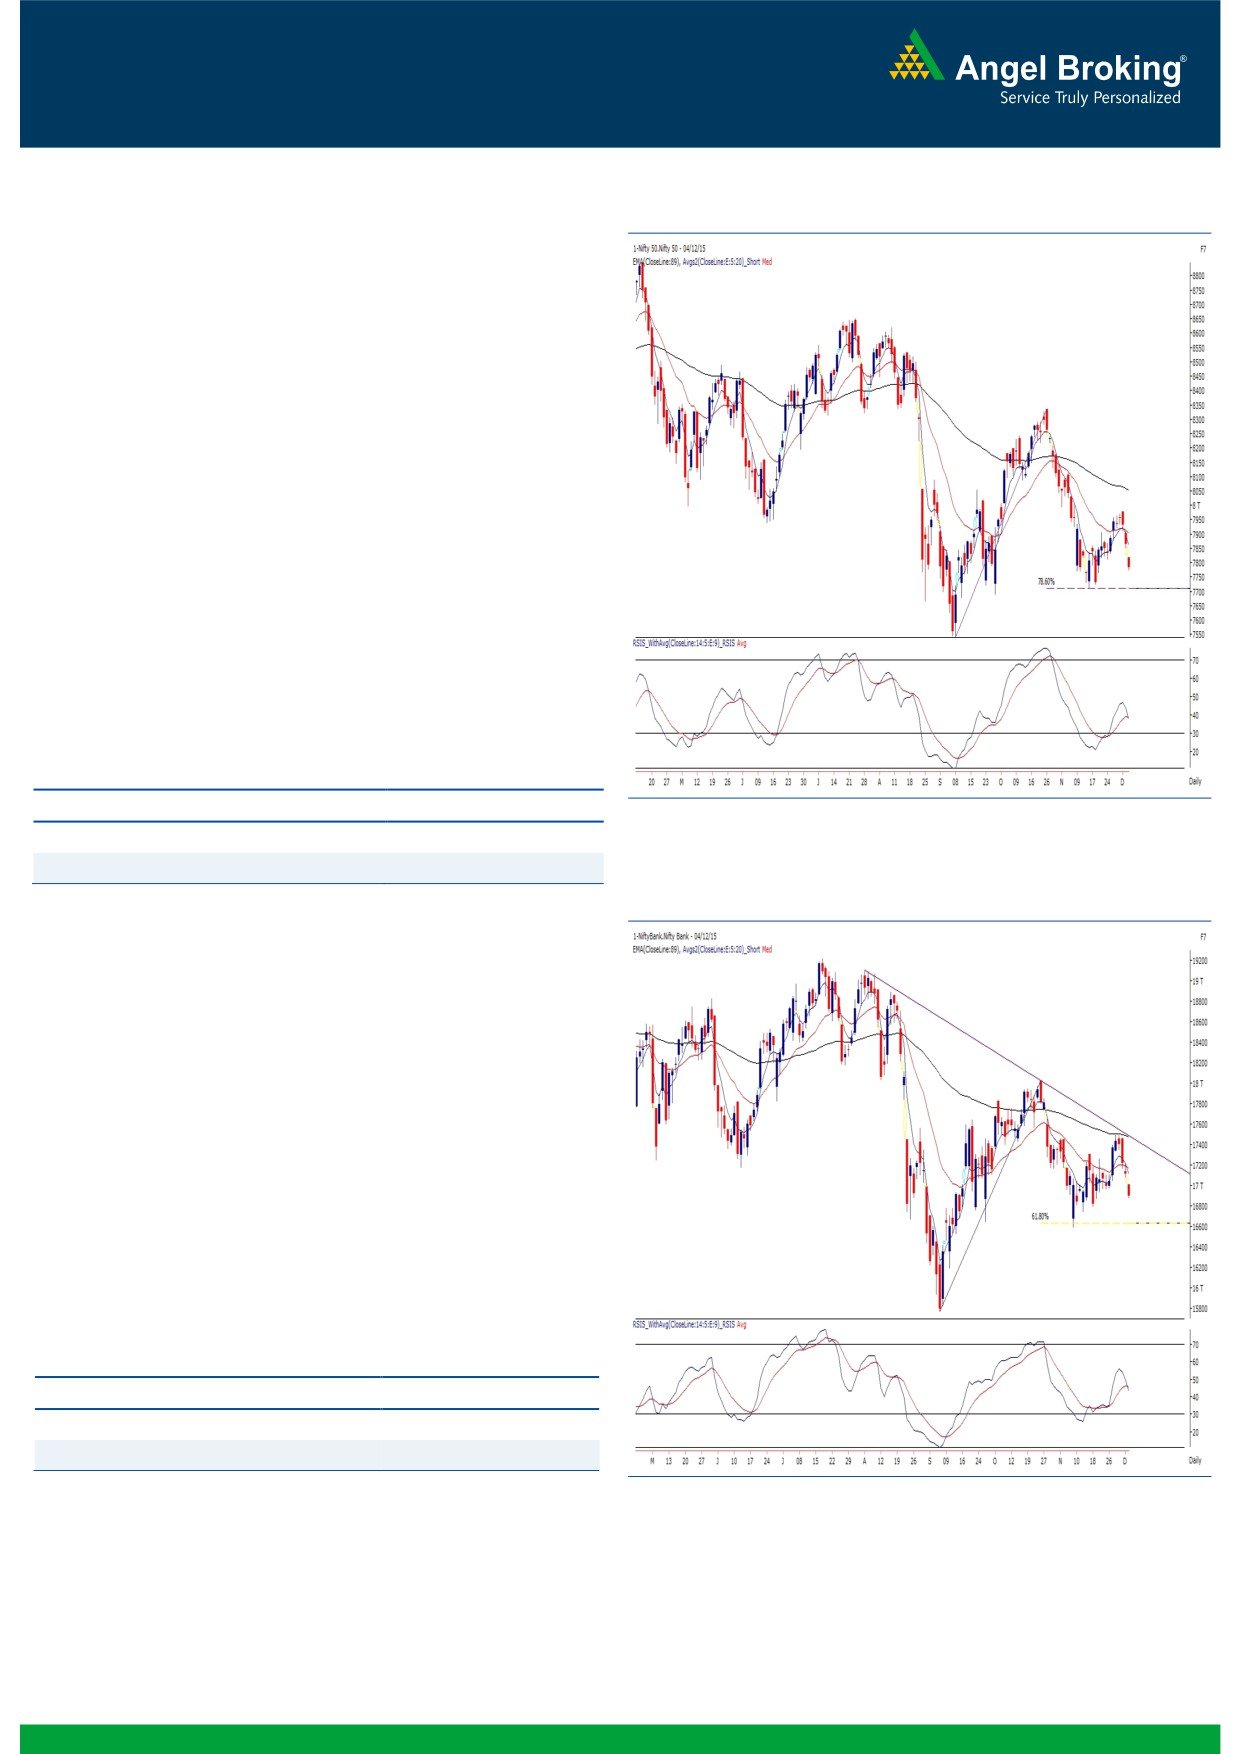
Exhibit 1: Nifty Daily Chart
The concluded week was an eventful one for our market. On
the domestic front, the RBI kept its interest rates unchanged, in
line with the street’s expectation. On the global front,
European markets plunged after the ECB president Mr Mario
Draghi failed to deliver the widely expected major stimulus
packages. These developments cumulatively influenced our
domestic equity market. Honestly speaking, considering last
week’s price movement, we were not expecting the Nifty to
sneak below the 7875 mark. Unfortunately it happened; but
still, we are of the opinion that as long as the Nifty holds the
7700 mark, the bulls have little to worry about. In case of a
less probable breakdown below this level, the ‘Inverted
Hammer Pattern’ confirmed in the previous week would get
negated and in this scenario, an immediate correction towards
7600 cannot be ruled out. Our analysis suggests a range of
7970 to 7700 for the Nifty in the near term. Traders are
advised to stay light on positions as the market is lacking a
clear direction.
Key Levels
Support 1 - 7750
Resistance 1 - 7845
Support 2 - 7700
Resistance 2 - 7900
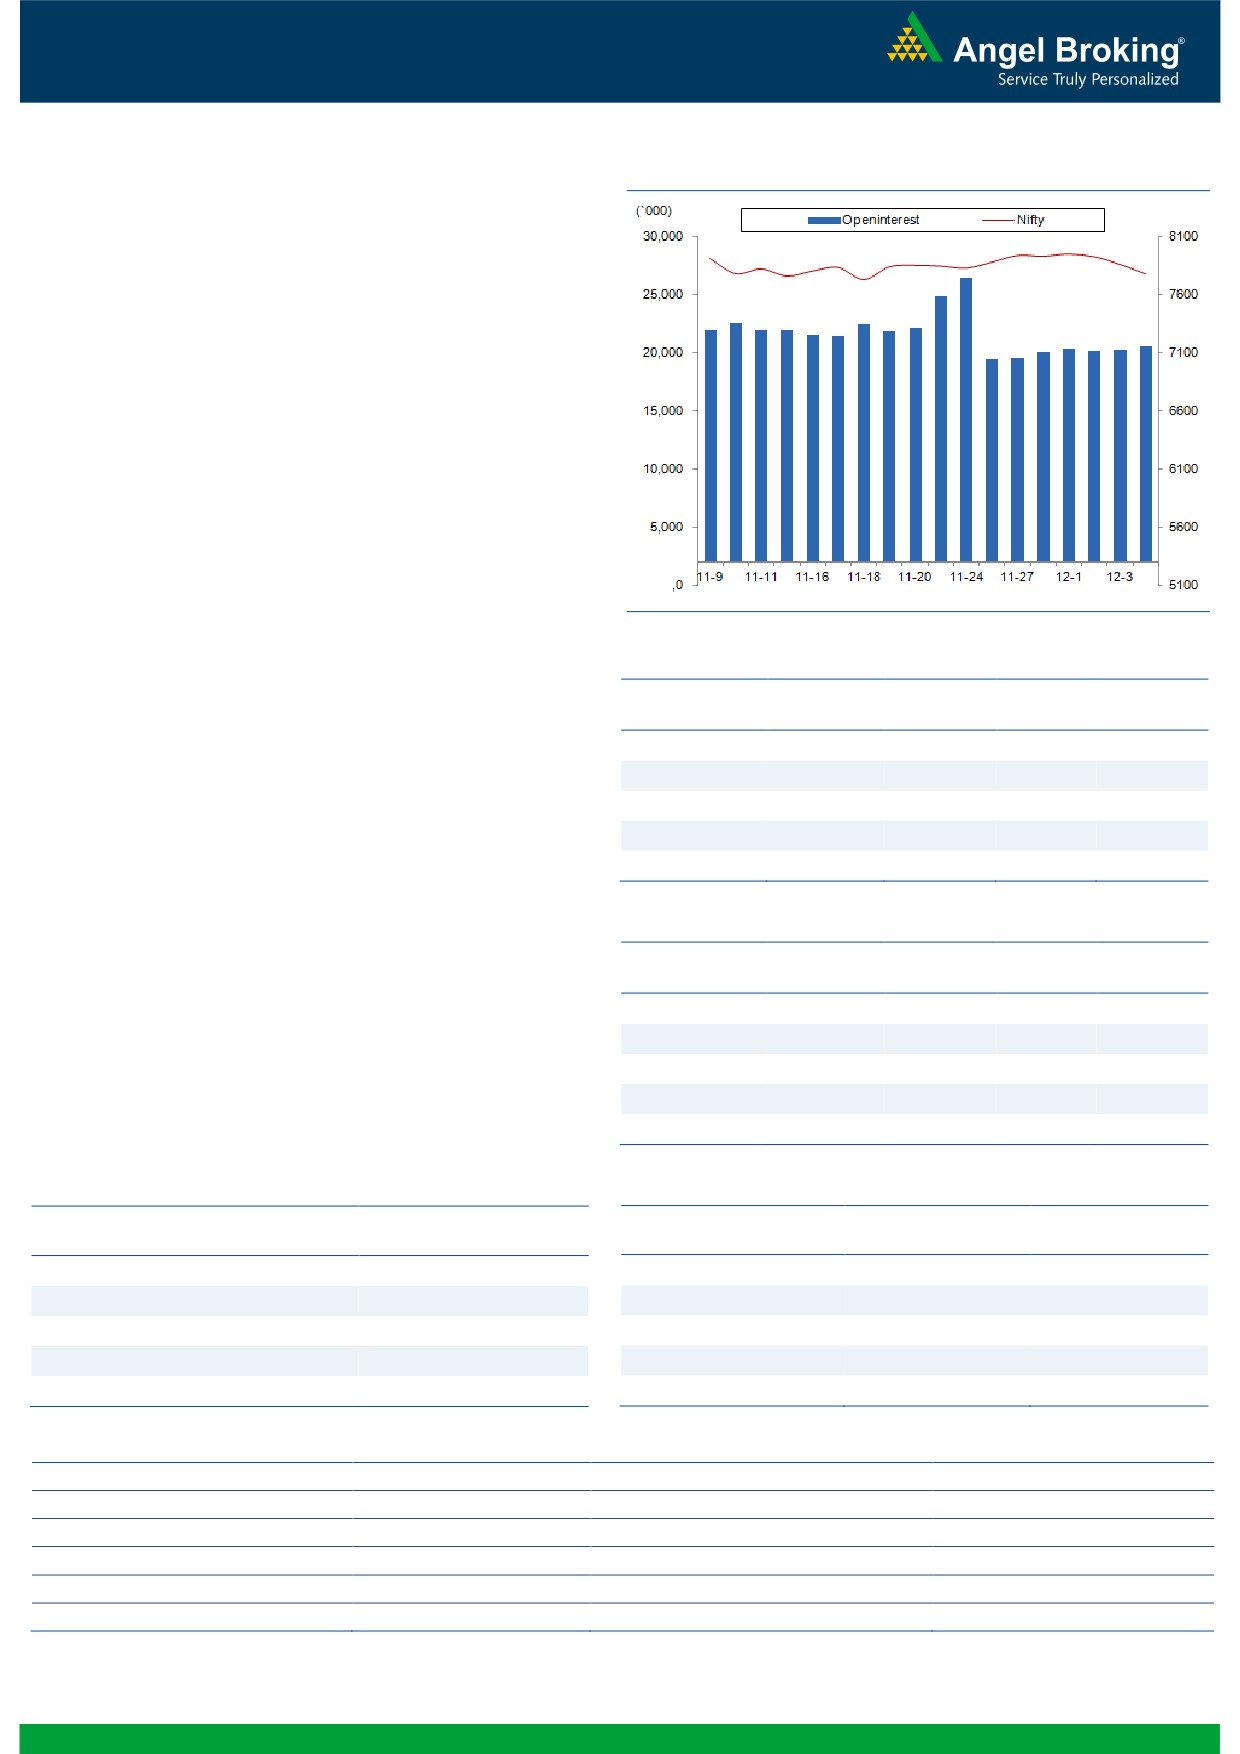
Exhibit 2: Bank Nifty Daily Chart
Bank Nifty Outlook - (16897)
In-line with the benchmark indices, the Bank Nifty too opened
with the downside gap of around 100 points on Friday. The
selling pressure which started with the first tick has continued
throughout the session. Eventually, the Bank Nifty ended the
session with the loss of 1.24 percent over its previous session.
While, in weekly chart, the banking index has seen a deep cut
of 2.73 percent and closed below the low of the previous
week. The ’89 EMA’ in the weekly chart, which is placed at
16660 levels, would now act as the support for the Bank Nifty
and we may see the correction towards that levels in the
coming session. On the flipside, immediate resistance for the
banking index is placed at 17080 - 17220 levels.
Key Levels
Support 1 - 16720
Resistance 1 - 17080
Support 2 - 16600
Resistance 2 - 17220
1
Technical & Derivatives Report
December 07, 2015
Comments
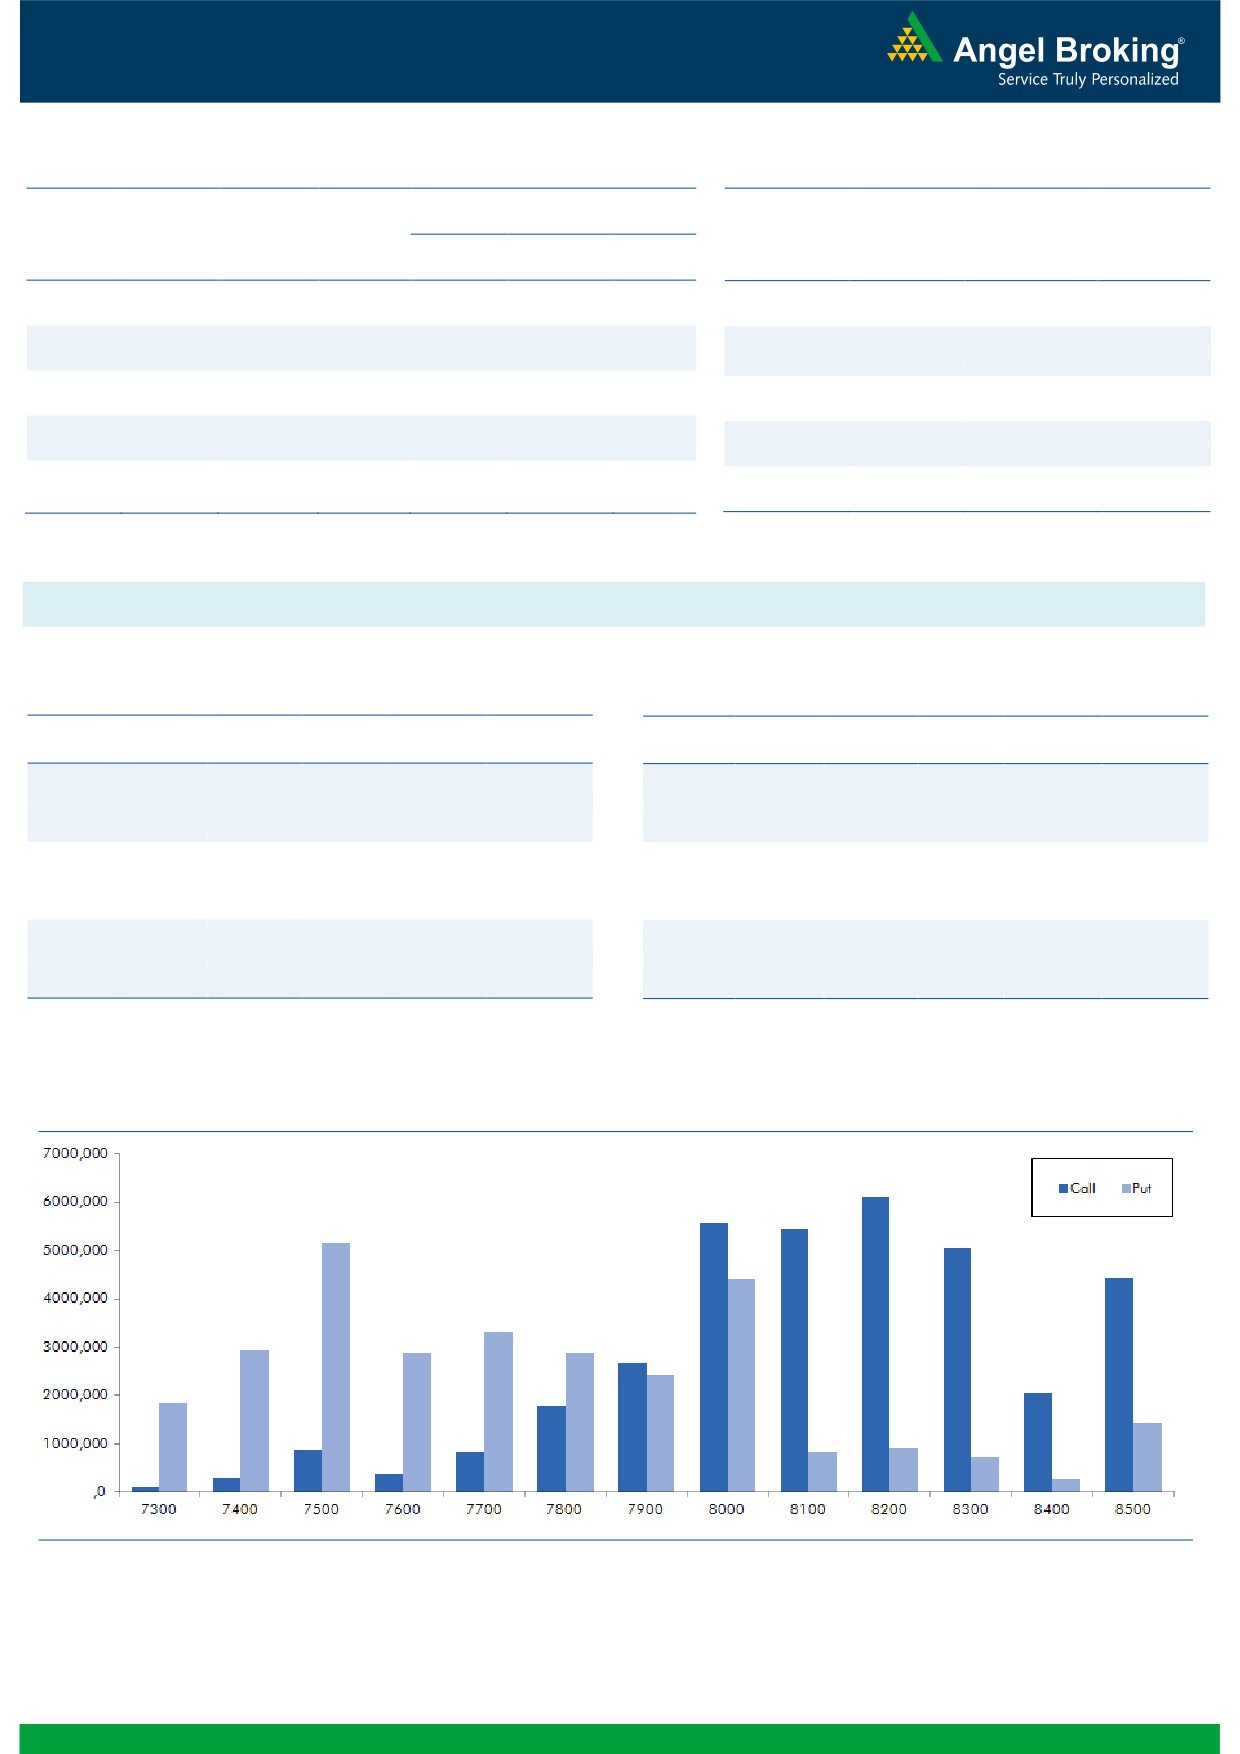
Nifty Vs OI
The Nifty futures open interest has increased by 1.27%
BankNifty futures open interest has increased by 8.69%
as market closed at 7781.90 levels.
The Nifty December future closed at a premium of 38.60
points against a premium of 26.65 points. The January
series closed at a premium of 74.35 points.
The Implied Volatility of at the money options has
remained unchanged at 14.57%.
The total OI of the market is Rs. 2,08,293/- cr. and the
stock futures OI is Rs. 63,989/- cr.
Few of the liquid counters where we have seen high cost
of carry are MCLEODRUSS, GMRINFRA, NCC,
JPASSOCIAT, and NHPC.
Views
OI Gainers
OI
PRICE
FIIs were net sellers in both cash market segment and
SCRIP
OI
PRICE
CHG. (%)
CHG. (%)
Index Futures on Friday. They sold equities to the tune of
KSCL
1362750
10.86
397.70
-4.15
Rs. 1746 and Index Futures worth Rs. 966 crores with
CADILAHC
4986000
10.36
396.00
-2.31
some fall in open interest, indicating blend of long
BHARATFORG
4208000
10.04
842.75
-2.89
unwinding and short formation in last trading session.
MOTHERSUMI
10705500
9.46
279.85
-1.69
In Index Options front, FIIs bought of worth Rs. 375
CAIRN
9495000
8.95
139.85
2.19
crores with rise in OI. In Nifty options, we hardly saw any
strikes adding meaningful OI in both call and put
OI Losers
options. 7800 call and 7500 put options were most
OI
PRICE
active on Friday. Maximum buildup is seen in 8200 call
SCRIP
OI
PRICE
CHG. (%)
CHG. (%)
and 7500 put options. We believe Nifty may trade in a
MCLEODRUSS
2054800
-22.04
180.05
0.78
range of 7700-7750 on the lower side and 8050-8100
GMRINFRA
241410000
-5.50
15.60
-14.29
on the higher side. Traders are advised to take positions
M&MFIN
10982000
-4.44
242.05
-1.37
accordingly.
M&M
3353600
-4.43
1323.20
-2.17
HINDZINC
2163200
-4.38
147.80
2.60
Historical Volatility
Put-Call Ratio
SCRIP
HV
SCRIP
PCR-OI
PCR-VOL
GMRINFRA
102.76
NIFTY
0.79
0.70
POWERGRID
23.20
BANKNIFTY
1.12
0.74
ZEEL
36.27
RELIANCE
0.51
0.55
SUNPHARMA
40.67
LT
0.57
0.48
TATAPOWER
23.16
SBIN
0.51
0.43
Strategy Date
Symbol
Strategy
Status
November 30, 2015
LT
Long Put
Active
2
Technical & Derivatives Report
December 07, 2015
FII Statistics for 04-December 2015
Turnover on 04-December 2015
Open Interest
No. of
Turnover
Change
Detail
Buy
Sell
Net
Instrument
Value
Change
Contracts
( in Cr. )
(%)
Contracts
(in Cr.)
(%)
INDEX
INDEX
1147.41
2113.14
(965.73)
267045
15295.62
(1.65)
202084
11270.05
-3.63
FUTURES
FUTURES
INDEX
INDEX
14294.00
13919.50
374.50
1117789
64719.16
2.37
1785552
104923.45
6.35
OPTIONS
OPTIONS
STOCK
2826.51
3151.05
(324.54)
994227
49433.73
0.72
STOCK
FUTURES
441662
22806.41
-0.45
FUTURES
STOCK
STOCK
1584.71
1536.73
47.98
46604
2300.55
11.24
OPTIONS
223155
12078.71
18.35
OPTIONS
TOTAL
19852.64
20720.42
(867.79)
2425665
131749.06
1.39
TOTAL
2652453
151078.62
5.30
Nifty Spot = 7781.90
Lot Size = 25
Bull-Call Spreads
Bear-Put Spreads
Action
Strike
Price
Risk
Reward
BEP
Action
Strike
Price
Risk
Reward
BEP
Buy
7800
134.75
Buy
7800
116.20
48.35
51.65
7848.35
37.45
62.55
7762.55
Sell
7900
86.40
Sell
7700
78.75
Buy
7800
134.75
Buy
7800
116.20
82.45
117.55
7882.45
63.95
136.05
7736.05
Sell
8000
52.30
Sell
7600
52.25
Buy
7900
86.40
Buy
7700
78.75
34.10
65.90
7934.10
26.50
73.50
7673.50
Sell
8000
52.30
Sell
7600
52.25
Note: Above mentioned Bullish or Bearish Spreads in Nifty (Dec. Series) are given as an information and not as a recommendation.
Nifty Put-Call Analysis
3
Technical & Derivatives Report
December 07, 2015
Daily Pivot Levels for Nifty 50 Stocks
Scrips
S2
S1
PIVOT
R1
R2
ACC
1,326
1,331
1,337
1,341
1,347
ADANIPORTS
253
254
256
257
259
AMBUJACEM
193
194
196
197
199
ASIANPAINT
823
829
835
841
847
AXISBANK
453
457
460
464
467
BAJAJ-AUTO
2,438
2,455
2,472
2,490
2,507
BANKBARODA
163
165
167
169
172
BHARTIARTL
315
318
320
323
326
BHEL
164
166
168
170
173
BOSCHLTD
18,189
18,283
18,413
18,506
18,636
BPCL
895
901
910
916
925
CAIRN
133
136
139
142
145
CIPLA
637
641
648
653
660
COALINDIA
329
332
335
339
342
DRREDDY
3,161
3,178
3,197
3,215
3,234
GAIL
346
351
356
362
367
GRASIM
3,677
3,698
3,727
3,748
3,777
HCLTECH
820
828
839
847
858
HDFC
1,155
1,163
1,178
1,186
1,201
HDFCBANK
1,045
1,052
1,063
1,070
1,080
HEROMOTOCO
2,587
2,603
2,618
2,634
2,650
HINDALCO
77
78
79
80
81
HINDUNILVR
795
805
815
825
834
ICICIBANK
259
260
262
263
265
IDEA
136
137
138
140
141
INDUSINDBK
931
937
941
947
951
INFY
1,027
1,038
1,051
1,063
1,076
ITC
331
333
338
340
344
KOTAKBANK
653
659
667
673
681
LT
1,330
1,335
1,343
1,348
1,356
LUPIN
1,773
1,789
1,812
1,828
1,852
M&M
1,293
1,304
1,324
1,335
1,355
MARUTI
4,550
4,575
4,605
4,630
4,659
NTPC
128
129
131
133
135
ONGC
223
225
228
230
233
PNB
133
134
134
135
136
POWERGRID
128
130
132
133
135
RELIANCE
953
959
968
974
982
SBIN
236
239
240
243
245
VEDL
89
90
92
93
94
SUNPHARMA
698
727
750
779
803
TATAMOTORS
391
395
403
408
416
TATAPOWER
63
63
65
65
67
TATASTEEL
233
237
241
244
248
TCS
2,306
2,317
2,332
2,343
2,358
TECHM
528
532
538
543
549
ULTRACEMCO
2,802
2,835
2,863
2,895
2,923
WIPRO
558
564
568
574
578
YESBANK
731
735
743
748
756
ZEEL
385
391
399
404
413
4
Technical & Derivatives Report
December 07, 2015
Research Team Tel: 022 - 39357800
For Technical Queries
For Derivatives Queries
DISCLAIMER
Angel Broking Private Limited (hereinafter referred to as “Angel”) is a registered Member of National Stock Exchange of India Limited,
Bombay Stock Exchange Limited and MCX Stock Exchange Limited. It is also registered as a Depository Participant with CDSL and
Portfolio Manager with SEBI. It also has registration with AMFI as a Mutual Fund Distributor. Angel Broking Private Limited is a
registered entity with SEBI for Research Analyst in terms of SEBI (Research Analyst) Regulations, 2014 vide registration number
INH000000164. Angel or its associates has not been debarred/ suspended by SEBI or any other regulatory authority for accessing
/dealing in securities Market. Angel or its associates including its relatives/analyst do not hold any financial interest/beneficial
ownership of more than 1% in the company covered by Analyst. Angel or its associates/analyst has not received any compensation /
managed or co-managed public offering of securities of the company covered by Analyst during the past twelve months. Angel/analyst
has not served as an officer, director or employee of company covered by Analyst and has not been engaged in market making activity
of the company covered by Analyst.
This document is solely for the personal information of the recipient, and must not be singularly used as the basis of any investment
decision. Nothing in this document should be construed as investment or financial advice. Each recipient of this document should
make such investigations as they deem necessary to arrive at an independent evaluation of an investment in the securities of the
companies referred to in this document (including the merits and risks involved), and should consult their own advisors to determine
the merits and risks of such an investment.
Reports based on technical and derivative analysis center on studying charts of a stock's price movement, outstanding positions and
trading volume, as opposed to focusing on a company's fundamentals and, as such, may not match with a report on a company's
fundamentals.
The information in this document has been printed on the basis of publicly available information, internal data and other reliable
sources believed to be true, but we do not represent that it is accurate or complete and it should not be relied on as such, as this
document is for general guidance only. Angel Broking Pvt. Limited or any of its affiliates/ group companies shall not be in any way
responsible for any loss or damage that may arise to any person from any inadvertent error in the information contained in this report.
Angel Broking Pvt. Limited has not independently verified all the information contained within this document. Accordingly, we cannot
testify, nor make any representation or warranty, express or implied, to the accuracy, contents or data contained within this document.
While Angel Broking Pvt. Limited endeavors to update on a reasonable basis the information discussed in this material, there may be
regulatory, compliance, or other reasons that prevent us from doing so.
This document is being supplied to you solely for your information, and its contents, information or data may not be reproduced,
redistributed or passed on, directly or indirectly.
Neither Angel Broking Pvt. Limited, nor its directors, employees or affiliates shall be liable for any loss or damage that may arise from
or in connection with the use of this information.
Note: Please refer to the important ‘Stock Holding Disclosure' report on the Angel website (Research Section). Also, please refer to the
latest update on respective stocks for the disclosure status in respect of those stocks. Angel Broking Pvt. Limited and its affiliates may
have investment positions in the stocks recommended in this report.
5