Technical & Derivatives Report
November 07, 2016
Sensex (27274) / Nifty (8434)
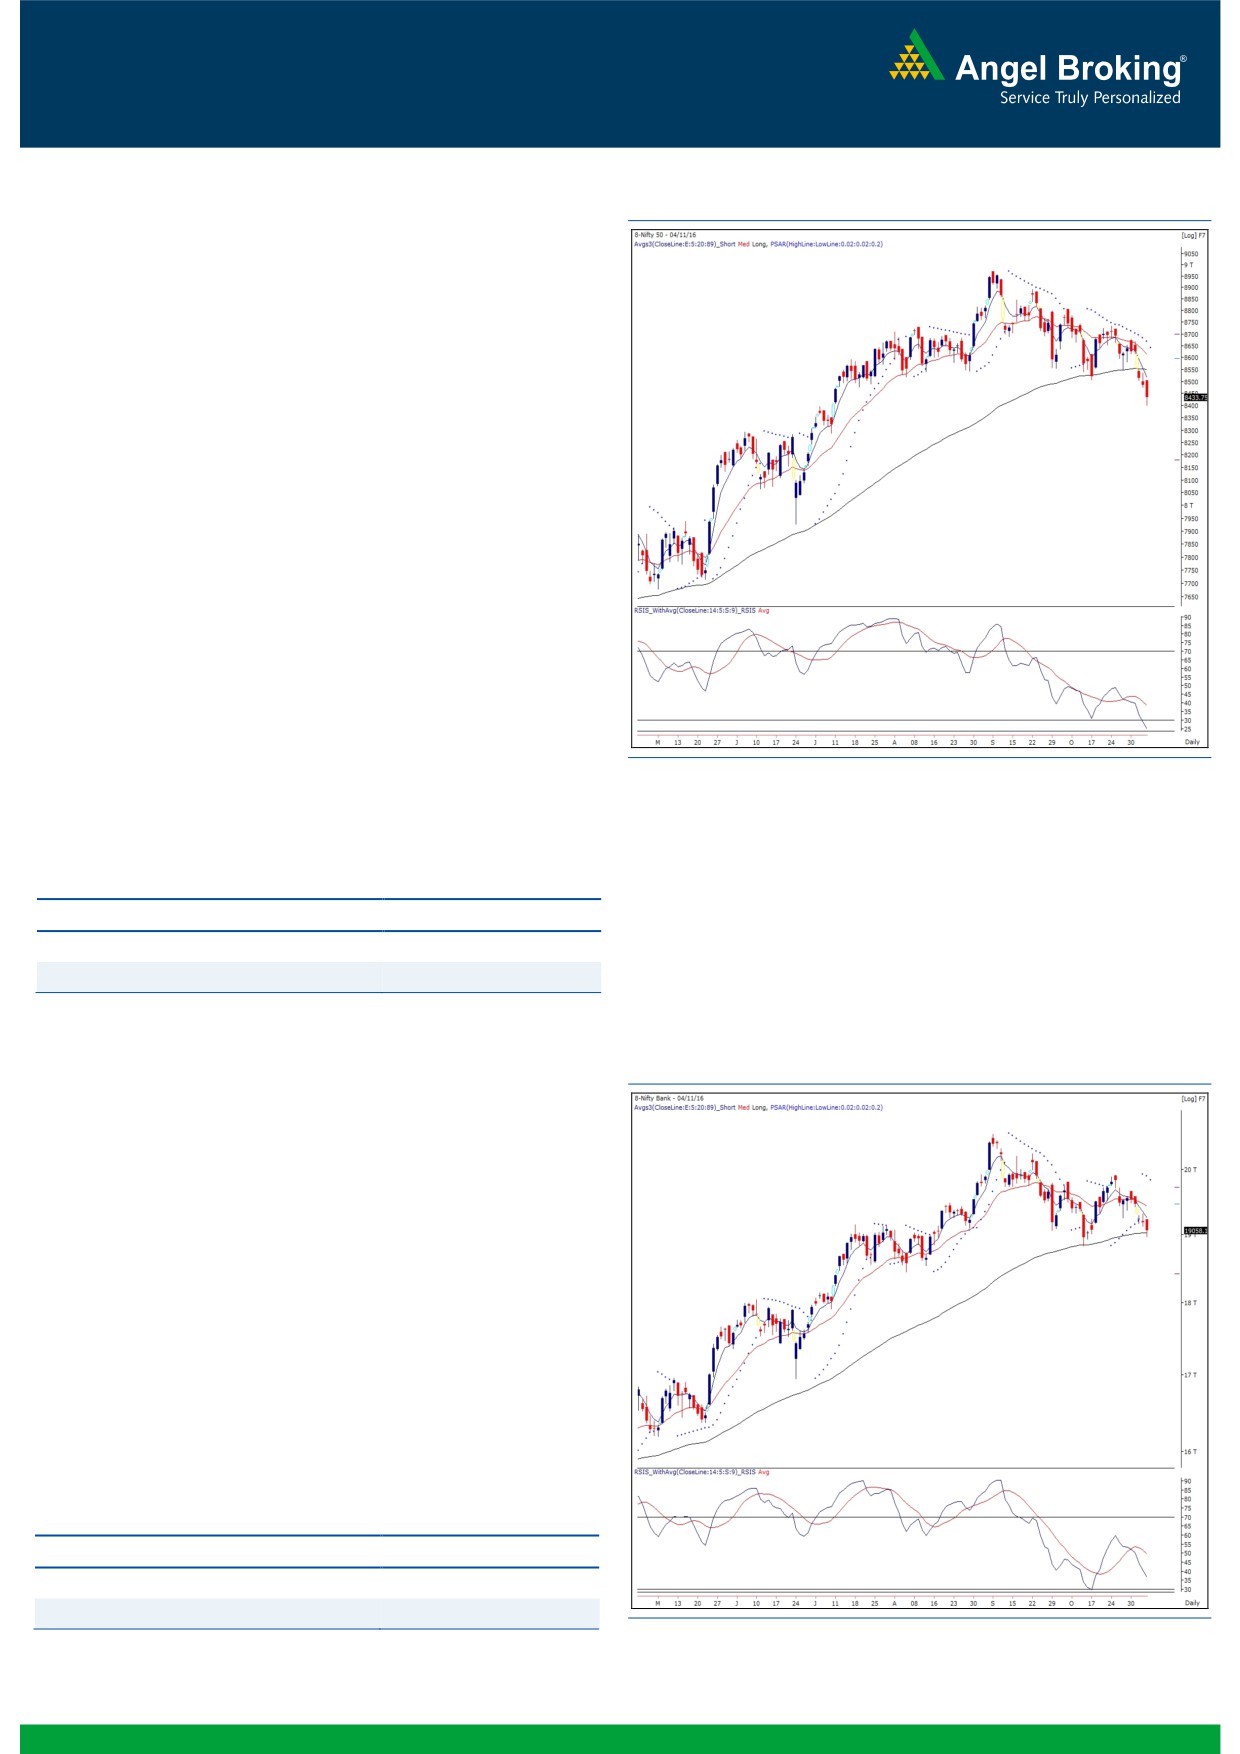
Exhibit 1: Nifty Daily Chart
The Nifty continued the bearish momentum on Friday too and
ended the session with loss of 0.60 percent over its previous
close.
Technically speaking, although, the index managed to hold the
lower end of the ‘Falling Wedge/ Channel’ pattern, we would
give more weightage to the break of 8500. When such an
important level is violated, we rarely see index immediately taking
a u-turn. The daily chart exhibits a breakdown from ‘Head and
Shoulder’ neckline level (8500), which coincides with the daily ’89
EMA’ as well. On one time frame higher degree (weekly) chart,
the Nifty has closed below the ’20 EMA’ along with the ‘RSI-
Smoothened’ slipping below the 70 mark for the first time in last
five months. All these observations provide credence to our
advised cautious stance and hence, we expect the index to remain
under pressure for some more time. On the downside, a
continuation of this move towards 8287 - 8162 cannot be ruled
out. Short term traders are advised not to create positions against
the ongoing momentum as 8550 - 8600 level would now act as
a strong resistance for the index. We reiterate that this corrective
move was essential for the market and can be construed as a
healthy development in order to start fresh the upward leg of the
rally with a long term perspective.
Key Levels
Support 1 - 8380
Resistance 1 - 8490
Support 2 - 8350
Resistance 2 - 8550
Exhibit 2: Nifty Bank Daily Chart
Nifty Bank Outlook - (19058)
During last week, the Nifty Bank index traded with negative bias
along with the broader market and ended the week with loss of
2.38 percent over its previous week's close.
On Friday, the Nifty Bank index has closed in the vicinity of
support range of 19000-19100 which coincides with the '89
DEMA'. However, there are no signs of reversal on the charts and
the '5 DEMA' has given negative crossover to the '20 DEMA'
during last week. Due to this bearish setup and the corrective
move in seen the broader market, there is higher probability of
the index sneaking below the mentioned support zone. Thus, we
continue to advise traders to remain cautious and avoid bottom
fishing. The near term supports for the Nifty bank index are
placed around 18825 and 18425 whereas resistances are seen
around 19227 and 19400.
Key Levels
Support 1 - 18825
Resistance 1 - 1927
Support 2 - 18425
Resistance 2 - 19400
1
Technical & Derivatives Report
November 07, 2016
Comments
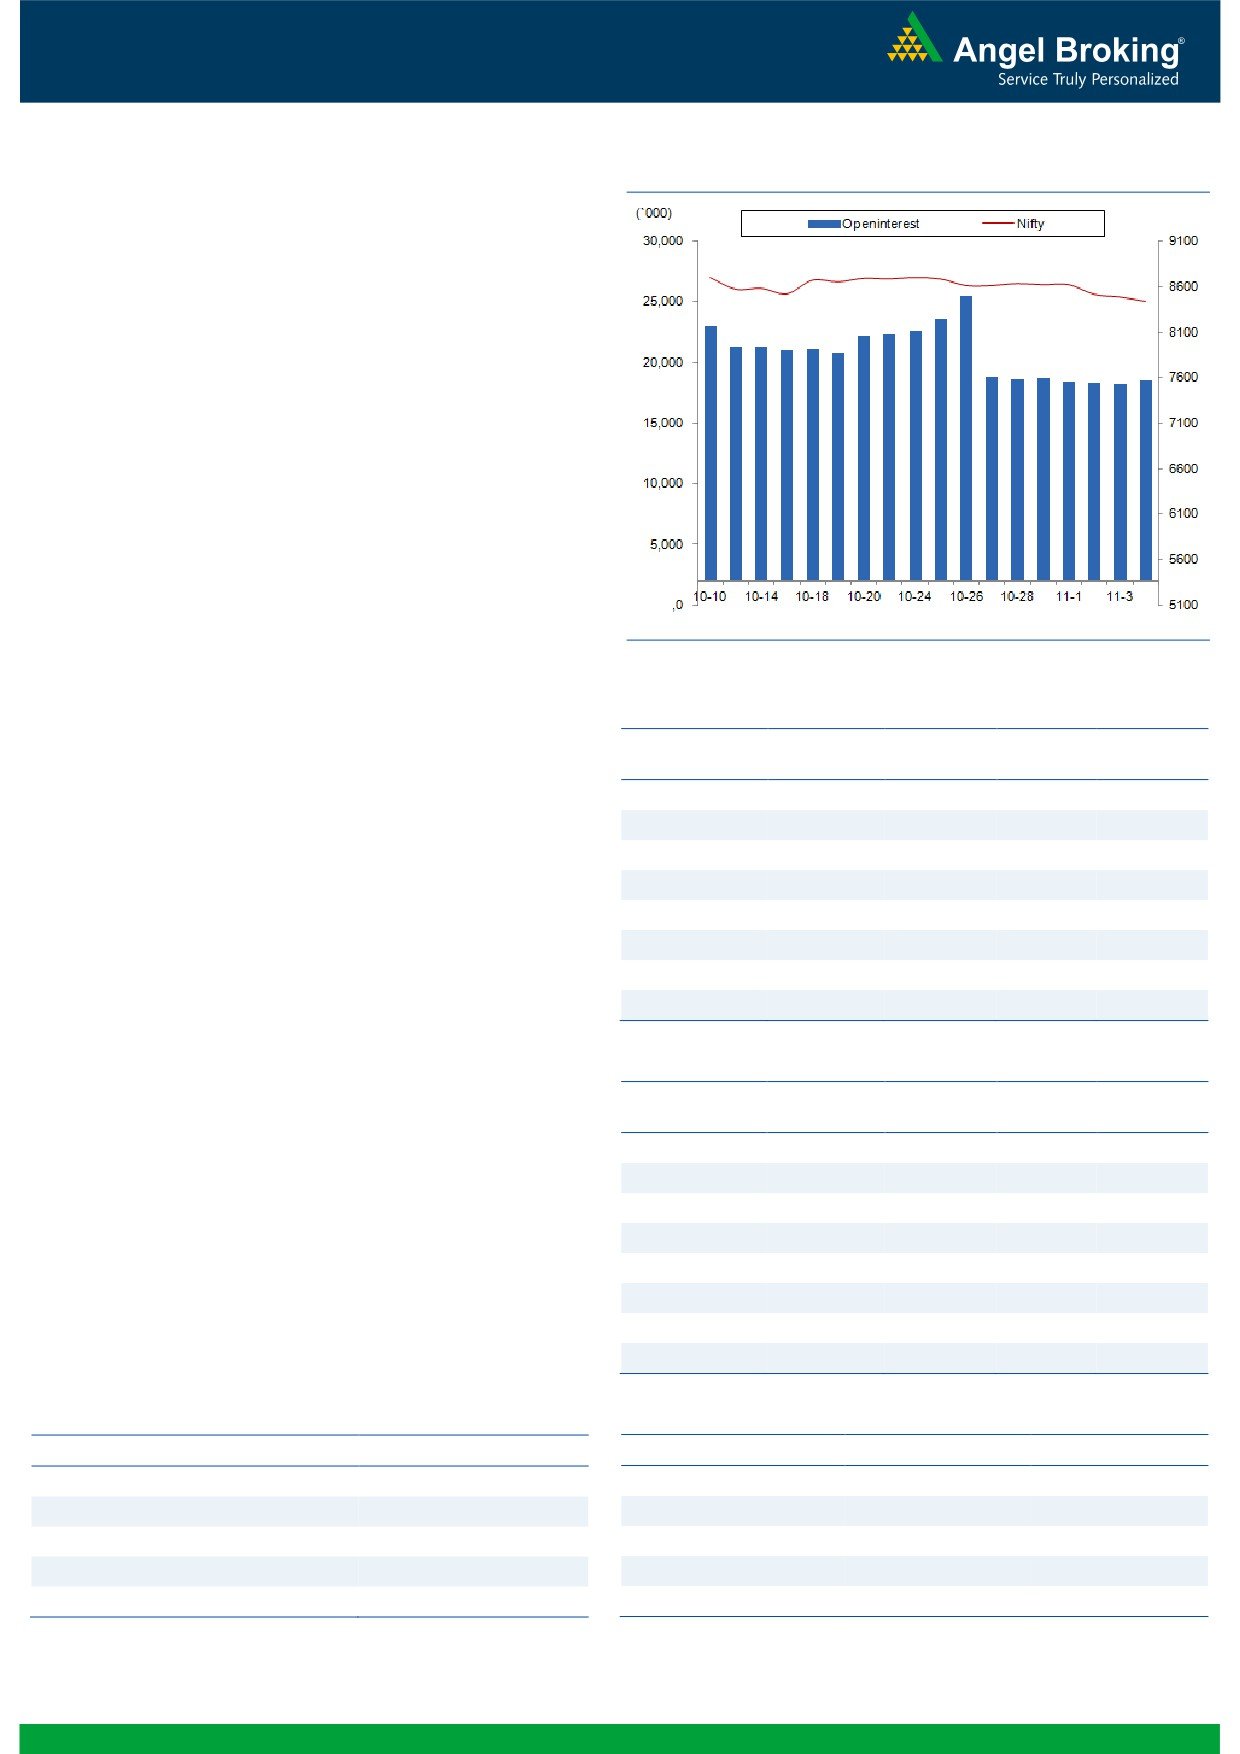
Nifty Vs OI
The Nifty futures open interest has increased by 1.82%
BankNifty futures open interest has increased by 2.35%
as market closed at 8433.75 levels.
The Nifty November future closed with a premium of
24.45 against the premium of 32.95 points in last
trading session. The December series closed at a
premium of 76.15 points.
The Implied Volatility of at the money options has
increased from 15.65% to 16.33%. At the same time, the
PCR-OI of Nifty has decreased from 0.93 to 0.92 levels.
The total OI of the market is Rs. 2,40,907/- cr. and the
stock futures OI is Rs. 74,401/- cr.
Few of the liquid counters where we have seen high cost
of carry are SINTEX, BOSCHLTD, APOLLOTYRE,
ADANIPOWER and IBREALEST.
Views
OI Gainers
On Friday, FIIs were net seller in both equity cash and
OI
PRICE
SCRIP
OI
PRICE
CHG. (%)
CHG. (%)
index future segment. They sold equities worth Rs. 343
AMARAJABAT
638400
16.79
1009.45
-1.39
crores. While, in index futures, they were net seller to the
DRREDDY
1795400
14.52
3082.55
-5.69
tune of Rs. 968 crores with marginal change in open
UNIONBANK
14964000
12.14
133.55
-2.23
interest, indicating blend of long unwindingaand freshng.com
LICHSGFIN
10096900
11.19
535.00
-3.23
short formation in last trading session.
ICIL
886200
10.47
756.30
-0.51
On Index Options front, FIIs sold of worth Rs. 189 crores
COALINDIA
13205600
9.27
317.05
-3.21
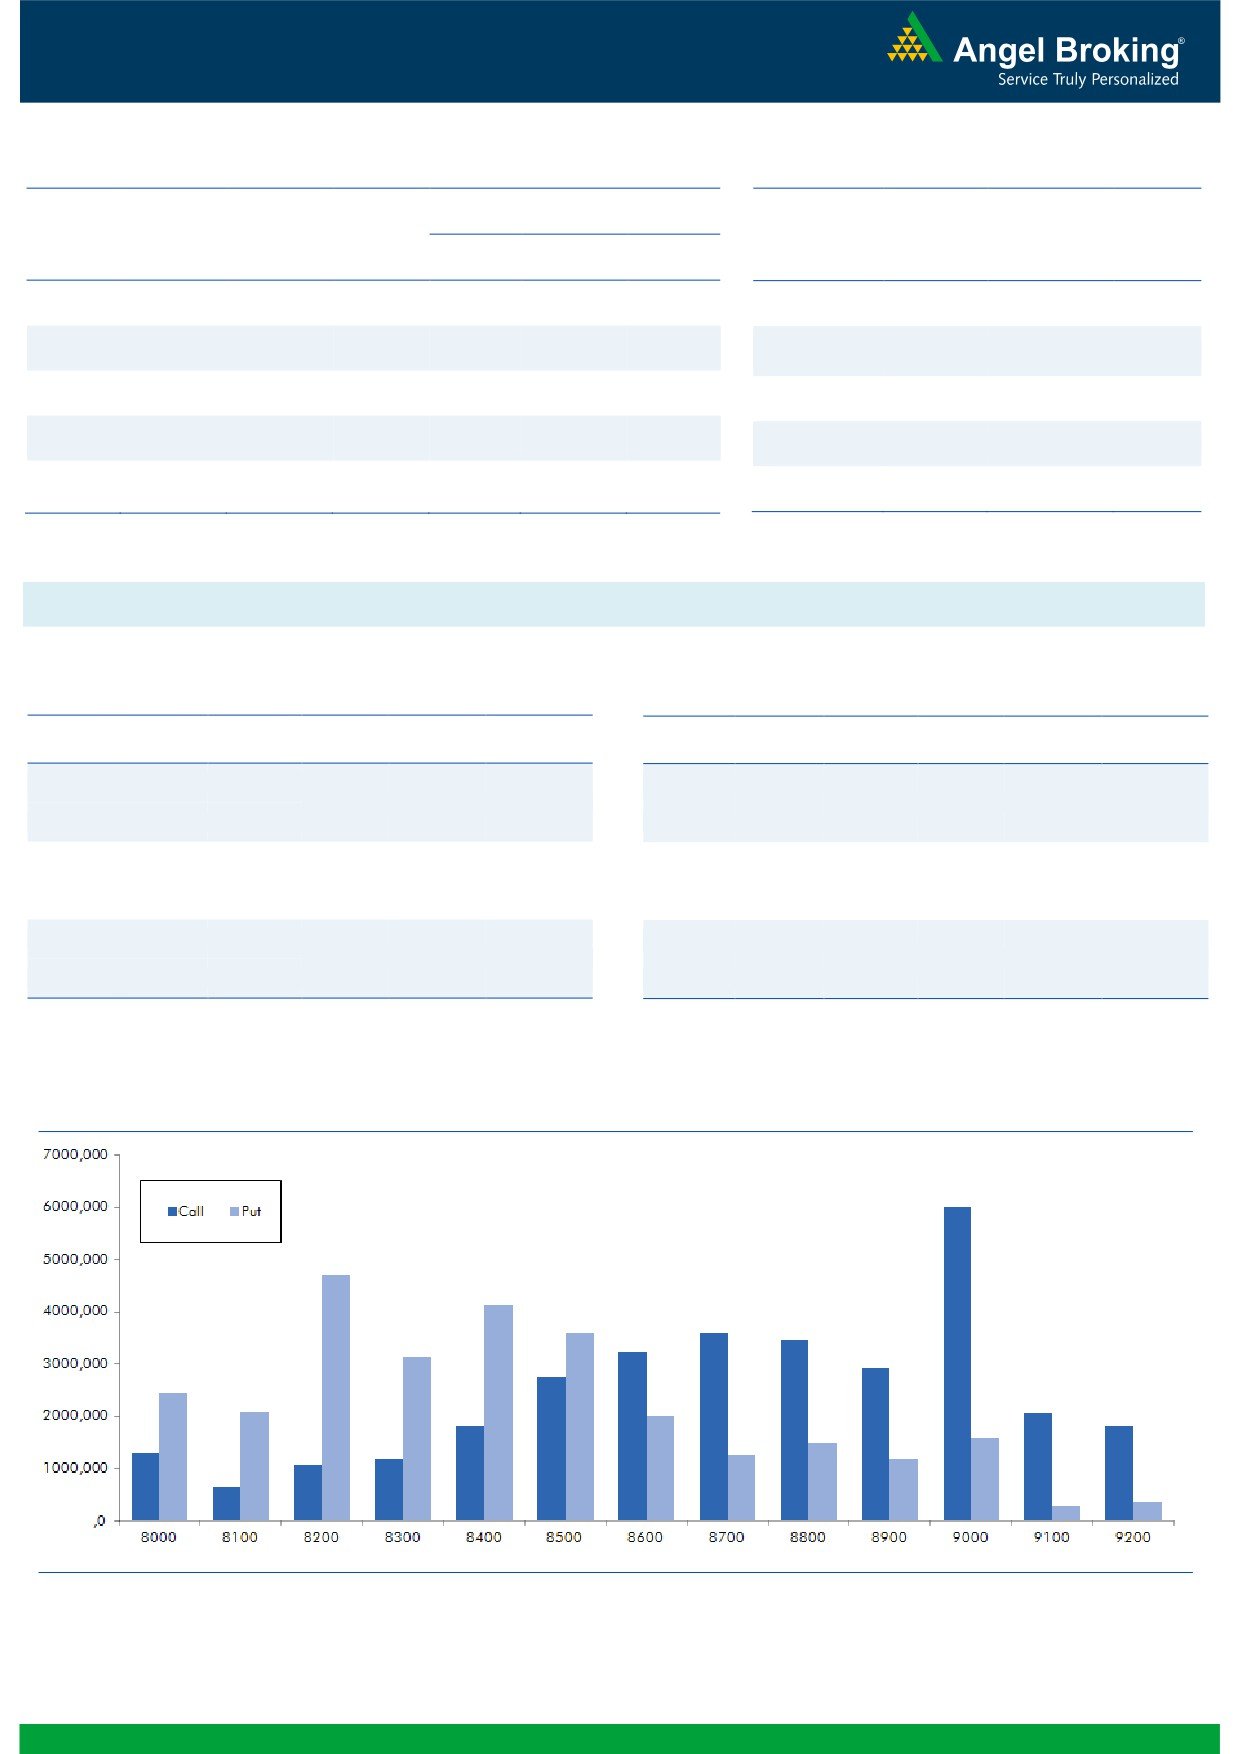
with good amount of rise in OI. In call options, some
SUNPHARMA
31089500
8.21
654.25
-7.43
build-up was seen in 8400-8700 strikes. On the other
PCJEWELLER
792000
5.81
475.55
-2.15
hand, in put options, 8100 and 8200 strikes were active
and they also added good amount of positions.
Maximum OI in November series is placed at 9000 call
OI Losers
and of put options has been shifted to 8200 strike price.
OI
PRICE
SCRIP
OI
PRICE
CHG. (%)
CHG. (%)
Last week, we are witnessing good amount of long
AMBUJACEM
11770000
-11.55
242.10
-0.47
unwinding and fresh short formation in Index Futures by
INFRATEL
3196200
-10.08
364.90
-4.69
stronger hands. They have also been countinously buying
ARVIND
6152000
-9.64
400.65
-1.80
put options and writing out the money call options since
VEDL
46469000
-7.33
212.00
-2.28
past few days. Looking at the above data, we believe
STAR
1789000
-7.31
1066.90
-4.94
market may continue to remain under pressure. Thus,
COLPAL
726600
-7.07
984.30
3.19
traders can buy 8400 put options to trade in Nifty.
CROMPGREAV
8568000
-7.03
76.55
-0.39
INDUSINDBK
3453600
-7.01
1219.70
-1.29
Historical Volatility
Put-Call Ratio
SCRIP
HV
SCRIP
PCR-OI
PCR-VOL
SUNPHARMA
43.80
NIFTY
0.92
1.00
DRREDDY
37.39
BANKNIFTY
1.14
0.93
ITC
26.53
RELIANCE
0.47
0.55
HCLTECH
30.94
SBIN
0.52
0.52
COALINDIA
26.08
AXISBANK
0.44
0.48
2
Technical & Derivatives Report
November 07, 2016
FII Statistics for November 04, 2016
Turnover on November 04, 2016
Open Interest
No. of
Turnover
Change
Detail
Buy
Sell
Net
Instrument
Value
Change
Contracts
( in Cr. )
(%)
Contracts
(in Cr.)
(%)
INDEX
INDEX
2145.14
3113.59
(968.45)
205965
13575.97
0.34
251881
17013.11
24.87
FUTURES
FUTURES
INDEX
INDEX
40237.11
40425.90
(188.79)
970646
62621.62
8.40
2959366
202061.40
-55.08
OPTIONS
OPTIONS
STOCK
7250.11
7850.41
(600.30)
888035
55414.64
1.07
STOCK
FUTURES
645310
42487.13
17.08
FUTURES
STOCK
STOCK
5946.83
5963.06
(16.23)
81865
5387.56
21.65
OPTIONS
400092
27713.64
33.07
OPTIONS
TOTAL
55579.20
57352.97
(1773.77)
2146511
136999.79
4.88
TOTAL
4256649
289275.27
-44.43
Nifty Spot = 8433.75
Lot Size = 75
Bull-Call Spreads
Bear-Put Spreads
Action
Strike
Price
Risk
Reward
BEP
Action
Strike
Price
Risk
Reward
BEP
Buy
8500
105.30
Buy
8400
104.25
41.25
58.75
8541.25
31.25
68.75
8368.75
Sell
8600
64.05
Sell
8300
73.00
Buy
8500
105.30
Buy
8400
104.25
70.05
129.95
8570.05
53.15
146.85
8346.85
Sell
8700
35.25
Sell
8200
51.10
Buy
8600
64.05
Buy
8300
73.00
28.80
71.20
8628.80
21.90
78.10
8278.10
Sell
8700
35.25
Sell
8200
51.10
Note: Above mentioned Bullish or Bearish Spreads in Nifty (November Series) are given as an information and not as a recommendation.
Nifty Put-Call Analysis
3
Technical & Derivatives Report
November 07, 2016
Daily Pivot Levels for Nifty Constituents
Scrips
S2
S1
PIVOT
R1
R2
ACC
1,445
1,467
1,497
1,520
1,549
ADANIPORTS
280
284
288
292
296
AMBUJACEM
234
237
242
245
249
ASIANPAINT
1,025
1,034
1,044
1,054
1,064
AUROPHARMA
673
701
735
762
796
AXISBANK
468
473
480
485
491
BAJAJ-AUTO
2,779
2,797
2,823
2,841
2,868
BANKBARODA
136
140
144
147
152
BHEL
131
133
136
138
141
BPCL
624
634
642
651
659
BHARTIARTL
301
304
307
310
314
INFRATEL
345
355
368
378
392
BOSCH
20,566
21,038
21,394
21,867
22,223
CIPLA
522
533
549
561
577
COALINDIA
304
310
318
325
333
DRREDDY
3,004
3,042
3,105
3,143
3,206
EICHERMOT
23,180
23,555
24,150
24,525
25,120
GAIL
415
419
426
431
437
GRASIM
863
882
904
923
945
HCLTECH
750
772
786
808
822
HDFCBANK
1,235
1,239
1,246
1,250
1,257
HDFC
1,360
1,373
1,391
1,404
1,421
HEROMOTOCO
3,178
3,233
3,306
3,361
3,434
HINDALCO
149
154
160
164
170
HINDUNILVR
828
838
852
862
876
ICICIBANK
262
266
269
273
276
IDEA
70
71
73
74
76
INDUSINDBK
1,193
1,206
1,220
1,233
1,247
INFY
952
962
970
980
989
ITC
241
245
251
255
260
KOTAKBANK
779
789
801
811
822
LT
1,380
1,400
1,417
1,437
1,455
LUPIN
1,350
1,385
1,429
1,464
1,508
M&M
1,324
1,348
1,370
1,394
1,416
MARUTI
5,599
5,652
5,720
5,773
5,842
NTPC
151
152
154
155
157
ONGC
262
266
269
273
276
POWERGRID
169
171
174
176
178
RELIANCE
984
995
1,011
1,022
1,038
SBIN
236
240
244
247
251
SUNPHARMA
627
639
660
672
692
TCS
2,278
2,304
2,320
2,346
2,362
TATAMTRDVR
319
327
333
341
347
TATAMOTORS
495
504
510
519
525
TATAPOWER
72
73
75
77
79
TATASTEEL
394
398
403
408
412
TECHM
406
418
427
438
447
ULTRACEMCO
3,757
3,806
3,867
3,916
3,978
WIPRO
441
447
450
456
460
YESBANK
1,152
1,174
1,195
1,217
1,238
ZEEL
495
501
505
511
515
4
Technical & Derivatives Report
November 07, 2016
Research Team Tel: 022 - 39357800
For Technical Queries
For Derivatives Queries
DISCLAIMER
Angel Broking Private Limited (hereinafter referred to as “Angel”) is a registered Member of National Stock Exchange of India Limited,
Bombay Stock Exchange Limited and Metropolitan Stock Exchange Limited. It is also registered as a Depository Participant with CDSL
and Portfolio Manager with SEBI. It also has registration with AMFI as a Mutual Fund Distributor. Angel Broking Private Limited is a
registered entity with SEBI for Research Analyst in terms of SEBI (Research Analyst) Regulations, 2014 vide registration number
INH000000164. Angel or its associates has not been debarred/ suspended by SEBI or any other regulatory authority for accessing
/dealing in securities Market. Angel or its associates/analyst has not received any compensation / managed or co-managed public
offering of securities of the company covered by Analyst during the past twelve months.
This document is solely for the personal information of the recipient, and must not be singularly used as the basis of any investment
decision. Nothing in this document should be construed as investment or financial advice. Each recipient of this document should
make such investigations as they deem necessary to arrive at an independent evaluation of an investment in the securities of the
companies referred to in this document (including the merits and risks involved), and should consult their own advisors to determine
the merits and risks of such an investment.
Reports based on technical and derivative analysis center on studying charts of a stock's price movement, outstanding positions and
trading volume, as opposed to focusing on a company's fundamentals and, as such, may not match with a report on a company's
fundamentals. Investors are advised to refer the Fundamental and Technical Research Reports available on our website to evaluate the
contrary view, if any.
The information in this document has been printed on the basis of publicly available information, internal data and other reliable
sources believed to be true, but we do not represent that it is accurate or complete and it should not be relied on as such, as this
document is for general guidance only. Angel Broking Pvt. Limited or any of its affiliates/ group companies shall not be in any way
responsible for any loss or damage that may arise to any person from any inadvertent error in the information contained in this report.
Angel Broking Pvt. Limited has not independently verified all the information contained within this document. Accordingly, we cannot
testify, nor make any representation or warranty, express or implied, to the accuracy, contents or data contained within this document.
While Angel Broking Pvt. Limited endeavors to update on a reasonable basis the information discussed in this material, there may be
regulatory, compliance, or other reasons that prevent us from doing so.
This document is being supplied to you solely for your information, and its contents, information or data may not be reproduced,
redistributed or passed on, directly or indirectly.
Neither Angel Broking Pvt. Limited, nor its directors, employees or affiliates shall be liable for any loss or damage that may arise from
or in connection with the use of this information.
5