Technical & Derivatives Report
October 07, 2016
Sensex (28106) / Nifty (8710)
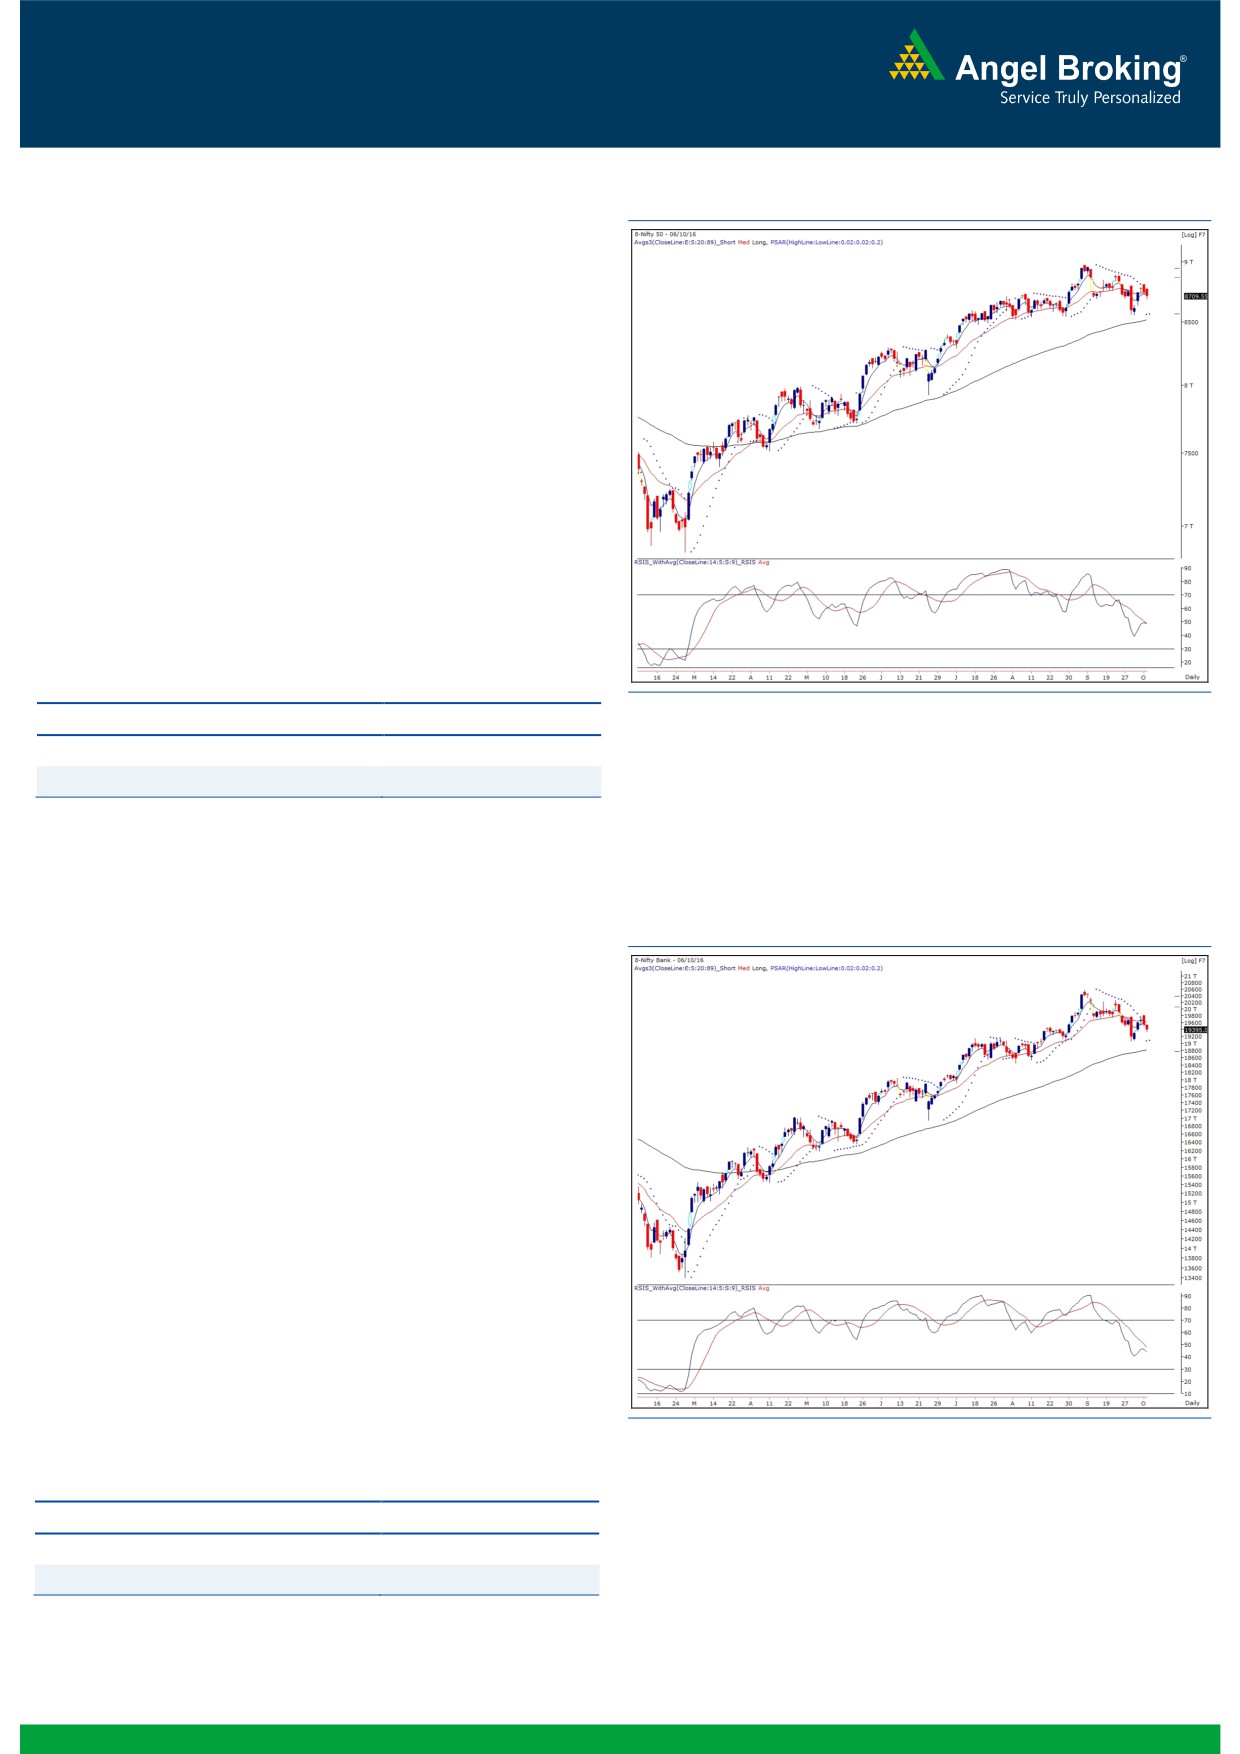
Exhibit 1: Nifty Daily Chart
Yesterday's session opened on a subdued note owing to quiet
global cues. Subsequently, we witnessed a positive trade within a
narrow range for the major part of the day. However, a sharp sell
off in the concluding hours led to a decent corrective move
towards the 8700 mark.
As mentioned in earlier reports, 8780 - 8820 acting as a stiff
hurdle and a failure to surpass this level resulted into a sharp
decline towards the fag end of the session. Going ahead, we
maintain our cautious stance on the market and expect the index
to remain under pressure as long as the said resistance zone of
8780 - 8820 in not violated convincingly. For the coming session,
8680 would be seen as immediate support. A move below this
may drag the index lower to test 8620 - 8580 levels. On the
flipside, intraday support is seen at 8740 - 8760 levels.
Key Levels
Support 1 - 8680
Resistance 1 - 8740
Support 2 - 8620
Resistance 2 - 8760
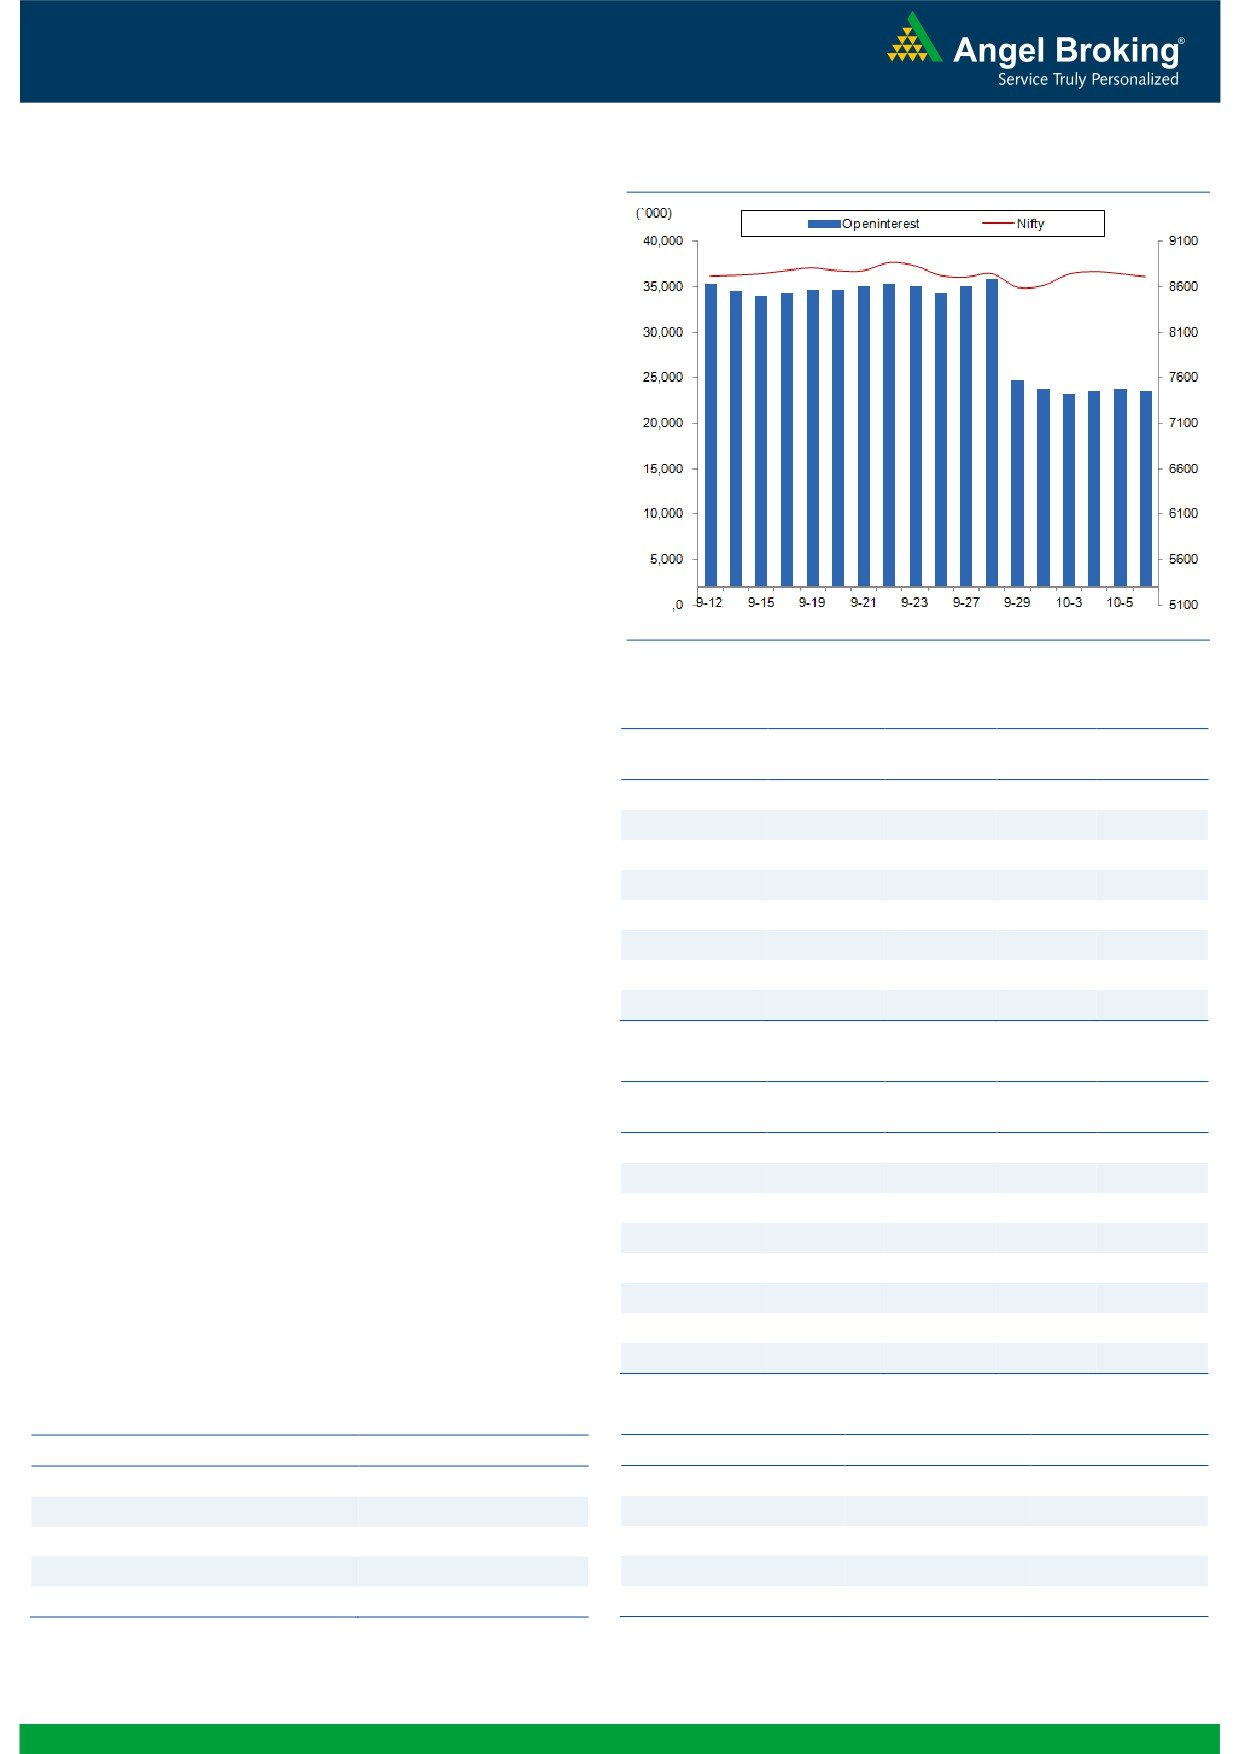
Exhibit 2: Nifty Bank Daily Chart
Nifty Bank Outlook - (19395)
The Nifty Bank index traded in an narrow range till noon
yesterday. However, during the last hour of trade, the indices as
well as the individual stocks corrected and the index ended the
session with loss of 0.73 percent.
In our yesterday's report we had mentioned about the gap
resistance of 19794-19861 and till the index is trading below the
range, the short term trend is negative. We continue with our
cautious stance on the Nifty Bank index as it was unable to cross
the resistance during the pullback move. There is higher
probability of the index retesting the recent low around 19060
and also, the Nifty PSU Bank index has formed an 'Evening Star'
pattern, which is a bearish pattern. Hence, traders are advised
not to create longs untill the resistance is crossed or any reversal
signs are seen. The intraday support for the index are placed
around 19220 and 19020 whereas resistances are seen in range
of 19570-19615.
Key Levels
Support 1 - 19220
Resistance 1 - 19570
Support 2 - 19020
Resistance 2 - 19615
1
Technical & Derivatives Report
October 07, 2016
Comments
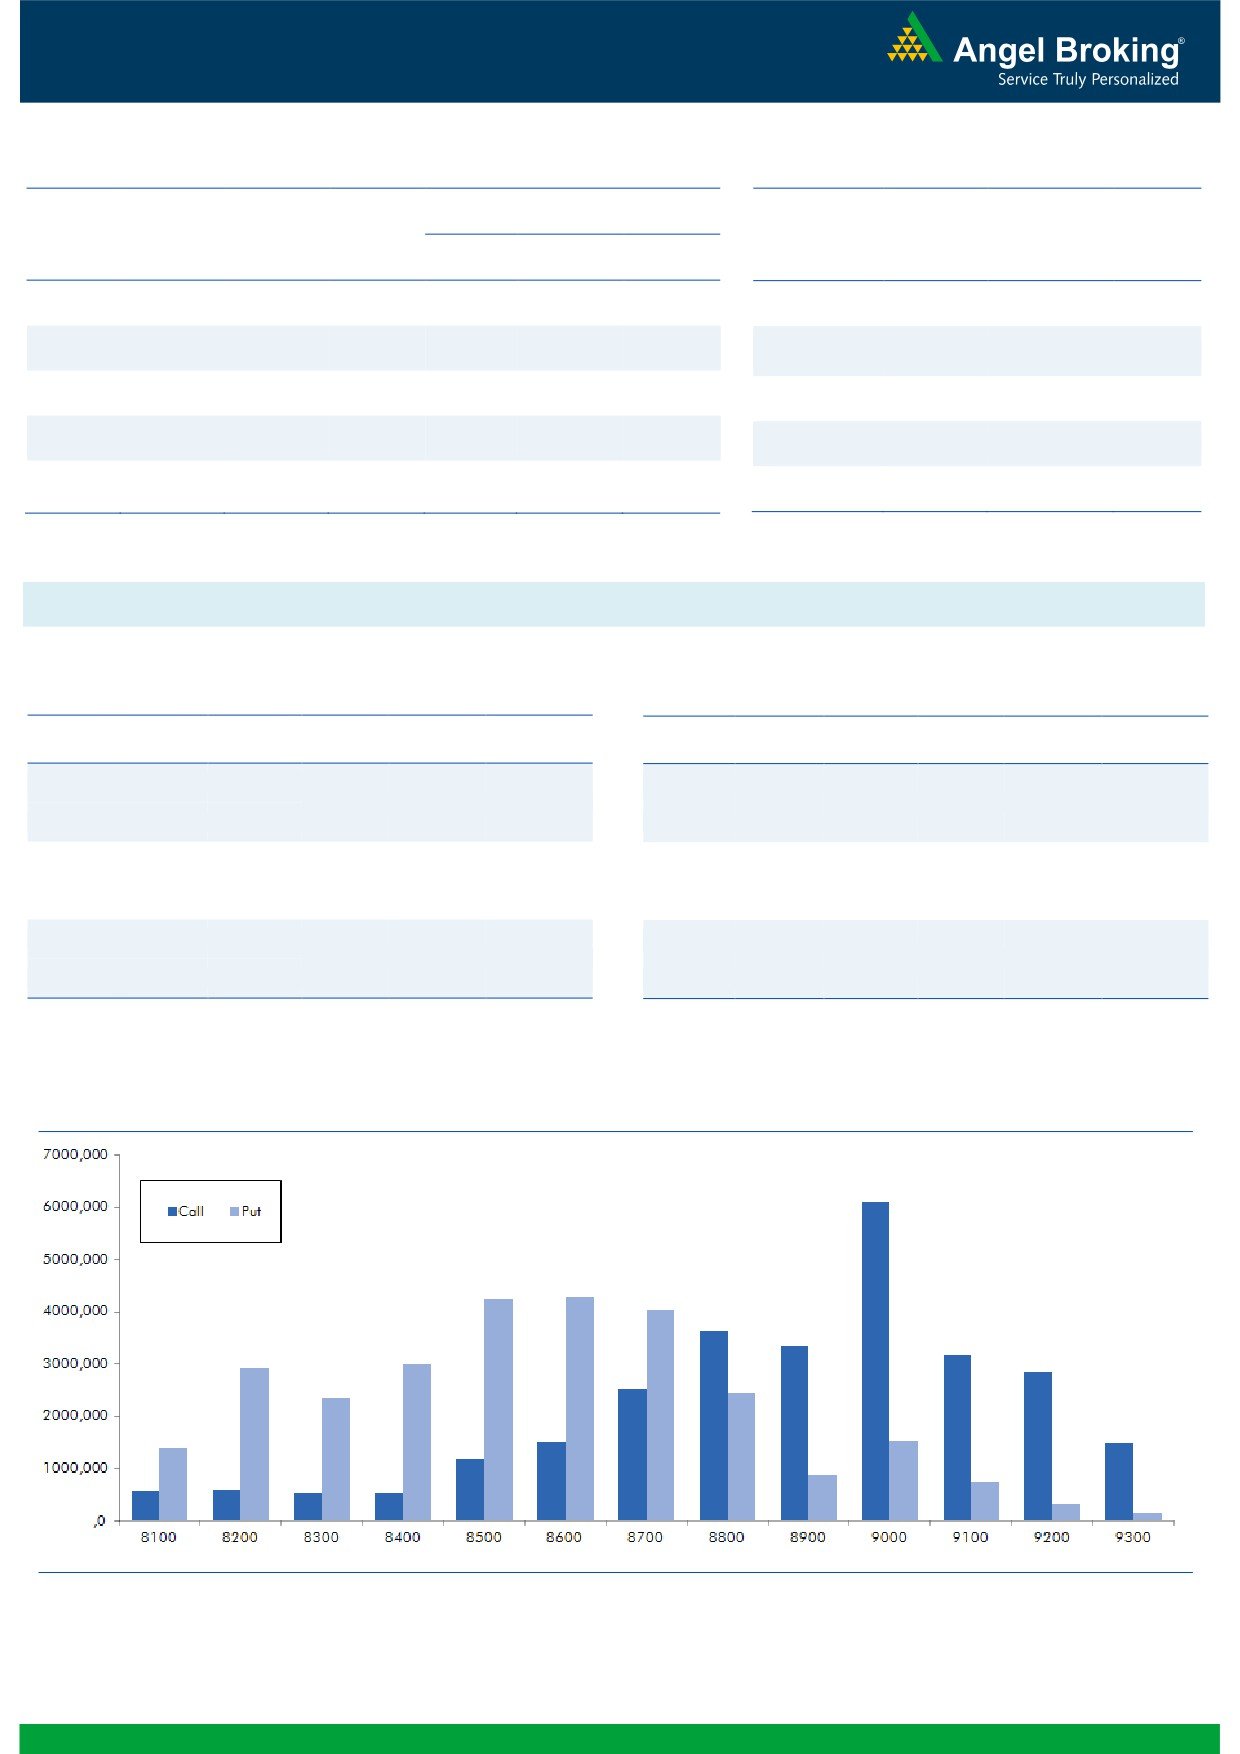
Nifty Vs OI
The Nifty futures open interest has decreased by 0.75%
BankNifty futures open interest has increased by 5.10%
as market closed at 8709.55 levels.
The Nifty October future closed with a premium of 21.80
against the premium of 31.40 points in last trading
session. The November series closed at a premium of
62.40 points.
The Implied Volatility of at the money options has
increased from 12.92% to 13.23%. At the same time, the
PCR-OI of Nifty remained unchanged at 0.97.
The total OI of the market is Rs. 2,69,719/- cr. and the
stock futures OI is Rs. 78,197/- cr.
Few of the liquid counters where we have seen high cost
of carry are JPASSOCIAT, NHPC, IFCI, AXISBANK and
IDFCBANK.
Views
OI Gainers
FIIs were net buyers in both cash market segment and
OI
PRICE
SCRIP
OI
PRICE
index futures. They bought equities of worth Rs. 354
CHG. (%)
CHG. (%)
crores. While, in index future, they were marginal buyers
TORNTPHARM
308800
45.94
1647.20
-1.55
with rise in OI, indicating blend of some long and short
TORNTPOWER
852000
21.37
182.00
-1.19
formation in last trading session.
IDFCBANK
16960000
18.70
74.00
-3.58
www.angelbroking.com
On Index Options front, FIIs bought to the tune of
OIL
1275000
14.50
414.20
0.28
Rs. 406 crores with rise in OI. We hardly saw any
ALBK
16810000
9.30
78.40
-3.27
meaningful open interest additions in both call and put
BOSCHLTD
109250
8.54
23214.35
1.18
options. However, 8800 call was comparatively active
BANKBARODA
43967000
6.91
165.35
-2.88
and it also added some fresh positions. Highest OI in
AJANTPHARM
486000
6.86
1976.80
-1.89
October series is placed at 9000 call and 8600 put
option.
OI Losers
From last three trading sessions, FIIs are net buyers in
OI
PRICE
SCRIP
OI
PRICE
Index Futures but the quantum of buying figure is
CHG. (%)
CHG. (%)
marginal. Most of the heavy weigth counters except
IGL
1608200
-13.54
860.35
3.41
RELIANCE, which showed strength didn’t add longs
KSCL
2679000
-9.71
418.40
1.22
yesterday. In fact, we are witnessing fresh short formation
SRF
463500
-8.31
1901.40
-1.85
in INFY, ITC, AXISBANK, SUNPHARMA and M&M. Thus,
JINDALSTEL
54810000
-8.06
79.30
-5.54
we would suggest traders to avoid forming longs; 8800-
NMDC
13452000
-8.00
116.30
3.79
8850 is an immediate wall of resistance for Nifty and
TATASTEEL
21486000
-7.44
390.45
-0.40
traders can buy 8700 put options to trade in Index for
APOLLOTYRE
10200000
-6.75
228.50
-0.98
near term.
HINDUNILVR
7527000
-6.09
884.90
1.00
Historical Volatility
Put-Call Ratio
SCRIP
HV
SCRIP
PCR-OI
PCR-VOL
IOC
40.34
NIFTY
0.97
1.06
HINDPETRO
37.65
BANKNIFTY
0.62
0.78
IGL
41.61
RELIANCE
0.62
0.55
BPCL
35.27
AXISBANK
0.35
0.52
JINDALSTEL
66.23
ICICIBANK
0.48
0.50
2
Technical & Derivatives Report
October 07, 2016
FII Statistics for 06, October 2016
Turnover on 06, October 2016
Open Interest
No. of
Turnover
Change
Detail
Buy
Sell
Net
Instrument
Value
Change
Contracts
( in Cr. )
(%)
Contracts
(in Cr.)
(%)
INDEX
INDEX
1205.39
1173.44
31.94
277479
18564.88
1.15
230561
16244.18
14.47
FUTURES
FUTURES
INDEX
INDEX
38773.36
38366.92
406.44
932761
61988.66
0.75
6156026
462530.74
52.77
OPTIONS
OPTIONS
STOCK
6938.07
6864.11
73.96
857238
57166.37
0.26
STOCK
FUTURES
613046
46462.40
8.14
FUTURES
STOCK
STOCK
4983.73
5010.47
(26.73)
71168
4893.33
18.08
OPTIONS
342971
26122.00
18.09
OPTIONS
TOTAL
51900.55
51414.94
485.61
2138646
142613.24
1.10
TOTAL
7342604
551359.31
44.32
Nifty Spot = 8709.55
Lot Size = 75
Bull-Call Spreads
Bear-Put Spreads
Action
Strike
Price
Risk
Reward
BEP
Action
Strike
Price
Risk
Reward
BEP
Buy
8800
73.70
Buy
8700
96.65
35.95
64.05
8835.95
32.45
67.55
8667.55
Sell
8900
37.75
Sell
8600
64.20
Buy
8800
73.70
Buy
8700
96.65
56.45
143.55
8856.45
54.10
145.90
8645.90
Sell
9000
17.25
Sell
8500
42.55
Buy
8900
37.75
Buy
8600
64.20
20.50
79.50
8920.50
21.65
78.35
8578.35
Sell
9000
17.25
Sell
8500
42.55
Note: Above mentioned Bullish or Bearish Spreads in Nifty (October Series) are given as an information and not as a recommendation.
Nifty Put-Call Analysis
3
Technical & Derivatives Report
October 07, 2016
Daily Pivot Levels for Nifty Constituents
Scrips
S2
S1
PIVOT
R1
R2
ACC
1,600
1,615
1,634
1,649
1,668
ADANIPORTS
258
262
265
268
271
AMBUJACEM
245
249
254
258
262
ASIANPAINT
1,191
1,200
1,211
1,221
1,232
AUROPHARMA
824
841
868
884
911
AXISBANK
519
525
530
536
541
BAJAJ-AUTO
2,777
2,800
2,834
2,858
2,892
BANKBARODA
160
162
166
168
172
BHEL
133
135
137
139
142
BPCL
637
654
669
686
700
BHARTIARTL
316
319
322
325
328
INFRATEL
375
378
382
385
388
BOSCH
22,347
22,723
23,136
23,512
23,925
CIPLA
564
572
584
591
604
COALINDIA
314
316
320
322
325
DRREDDY
3,026
3,051
3,086
3,111
3,146
EICHERMOT
25,825
26,033
26,269
26,477
26,713
GAIL
392
403
411
423
431
GRASIM
975
992
1,005
1,023
1,036
HCLTECH
786
794
805
813
825
HDFCBANK
1,269
1,275
1,286
1,292
1,302
HDFC
1,410
1,418
1,426
1,434
1,442
HEROMOTOCO
3,419
3,447
3,484
3,512
3,550
HINDALCO
153
156
159
161
164
HINDUNILVR
869
877
882
890
895
ICICIBANK
245
248
253
256
260
IDEA
79
79
80
81
81
INDUSINDBK
1,192
1,207
1,221
1,236
1,250
INFY
1,014
1,021
1,033
1,040
1,052
ITC
232
235
238
241
245
KOTAKBANK
771
777
784
790
796
LT
1,435
1,445
1,456
1,466
1,477
LUPIN
1,465
1,476
1,490
1,501
1,515
M&M
1,340
1,356
1,382
1,399
1,425
MARUTI
5,673
5,692
5,719
5,737
5,764
NTPC
145
147
150
152
156
ONGC
262
266
270
273
277
POWERGRID
174
176
179
181
184
RELIANCE
1,075
1,093
1,110
1,127
1,144
SBIN
252
254
258
261
265
SUNPHARMA
740
746
757
763
773
TCS
2,358
2,374
2,388
2,403
2,418
TATAMTRDVR
343
348
356
361
369
TATAMOTORS
540
546
555
561
570
TATAPOWER
76
78
79
81
82
TATASTEEL
381
386
391
395
400
TECHM
413
417
423
427
432
ULTRACEMCO
3,885
3,923
3,983
4,021
4,081
WIPRO
475
477
479
480
482
YESBANK
1,205
1,243
1,269
1,306
1,332
ZEEL
541
548
559
566
577
4
Technical & Derivatives Report
October 07, 2016
Research Team Tel: 022 - 39357800
For Technical Queries
For Derivatives Queries
DISCLAIMER
Angel Broking Private Limited (hereinafter referred to as “Angel”) is a registered Member of National Stock Exchange of India Limited,
Bombay Stock Exchange Limited and Metropolitan Stock Exchange Limited. It is also registered as a Depository Participant with CDSL
and Portfolio Manager with SEBI. It also has registration with AMFI as a Mutual Fund Distributor. Angel Broking Private Limited is a
registered entity with SEBI for Research Analyst in terms of SEBI (Research Analyst) Regulations, 2014 vide registration number
INH000000164. Angel or its associates has not been debarred/ suspended by SEBI or any other regulatory authority for accessing
/dealing in securities Market. Angel or its associates/analyst has not received any compensation / managed or co-managed public
offering of securities of the company covered by Analyst during the past twelve months.
This document is solely for the personal information of the recipient, and must not be singularly used as the basis of any investment
decision. Nothing in this document should be construed as investment or financial advice. Each recipient of this document should
make such investigations as they deem necessary to arrive at an independent evaluation of an investment in the securities of the
companies referred to in this document (including the merits and risks involved), and should consult their own advisors to determine
the merits and risks of such an investment.
Reports based on technical and derivative analysis center on studying charts of a stock's price movement, outstanding positions and
trading volume, as opposed to focusing on a company's fundamentals and, as such, may not match with a report on a company's
fundamentals. Investors are advised to refer the Fundamental and Technical Research Reports available on our website to evaluate the
contrary view, if any.
The information in this document has been printed on the basis of publicly available information, internal data and other reliable
sources believed to be true, but we do not represent that it is accurate or complete and it should not be relied on as such, as this
document is for general guidance only. Angel Broking Pvt. Limited or any of its affiliates/ group companies shall not be in any way
responsible for any loss or damage that may arise to any person from any inadvertent error in the information contained in this report.
Angel Broking Pvt. Limited has not independently verified all the information contained within this document. Accordingly, we cannot
testify, nor make any representation or warranty, express or implied, to the accuracy, contents or data contained within this document.
While Angel Broking Pvt. Limited endeavors to update on a reasonable basis the information discussed in this material, there may be
regulatory, compliance, or other reasons that prevent us from doing so.
This document is being supplied to you solely for your information, and its contents, information or data may not be reproduced,
redistributed or passed on, directly or indirectly.
Neither Angel Broking Pvt. Limited, nor its directors, employees or affiliates shall be liable for any loss or damage that may arise from
or in connection with the use of this information.
5