Technical & Derivatives Report
September 07, 2016
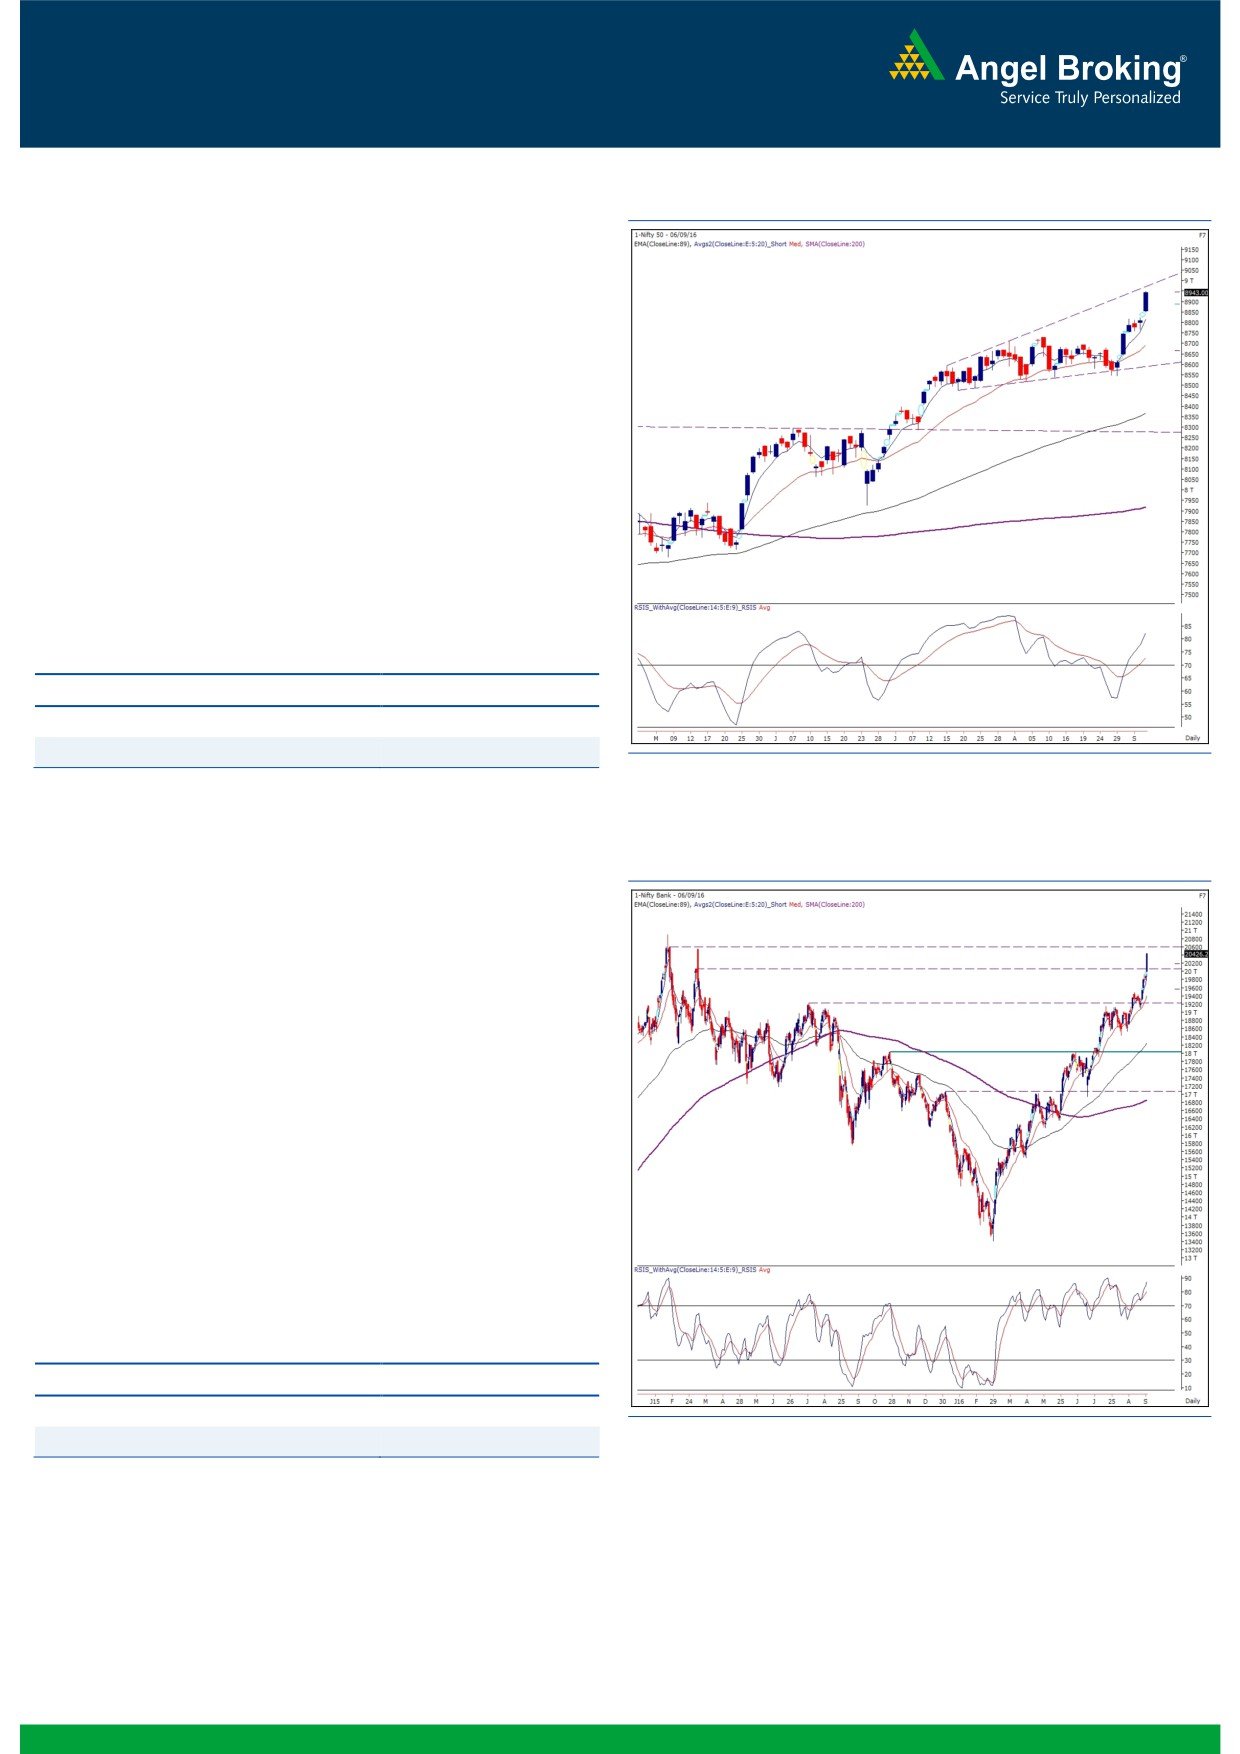
Sensex (28978) / Nifty (8943)
Exhibit 1: Nifty Daily Chart
Last week, we saw the index posting a new 52-week high tad
above the 8800 mark. This was followed by a gap up opening on
Tuesday in-line with global cues. As a result, the Nifty first met
with our target of 8850 and then continued its strong upward bias
throughout the session to post highest single day gains in last two
months.
What we witnessed yesterday is a perfect example of cheer
optimism in the market. As a result, the index closed well above
the 8900 mark. Now, despite this strong move, we would advise
traders to keep booking profits and follow a stock centric
approach. For the coming session, the immediate resistance is
seen at 8980 - 9000 levels; whereas, 8880 - 8840 would act as
a support zone.
Key Levels
Support 1 - 8880
Resistance 1 - 8980
Support 2 - 8840
Resistance 2 - 9000
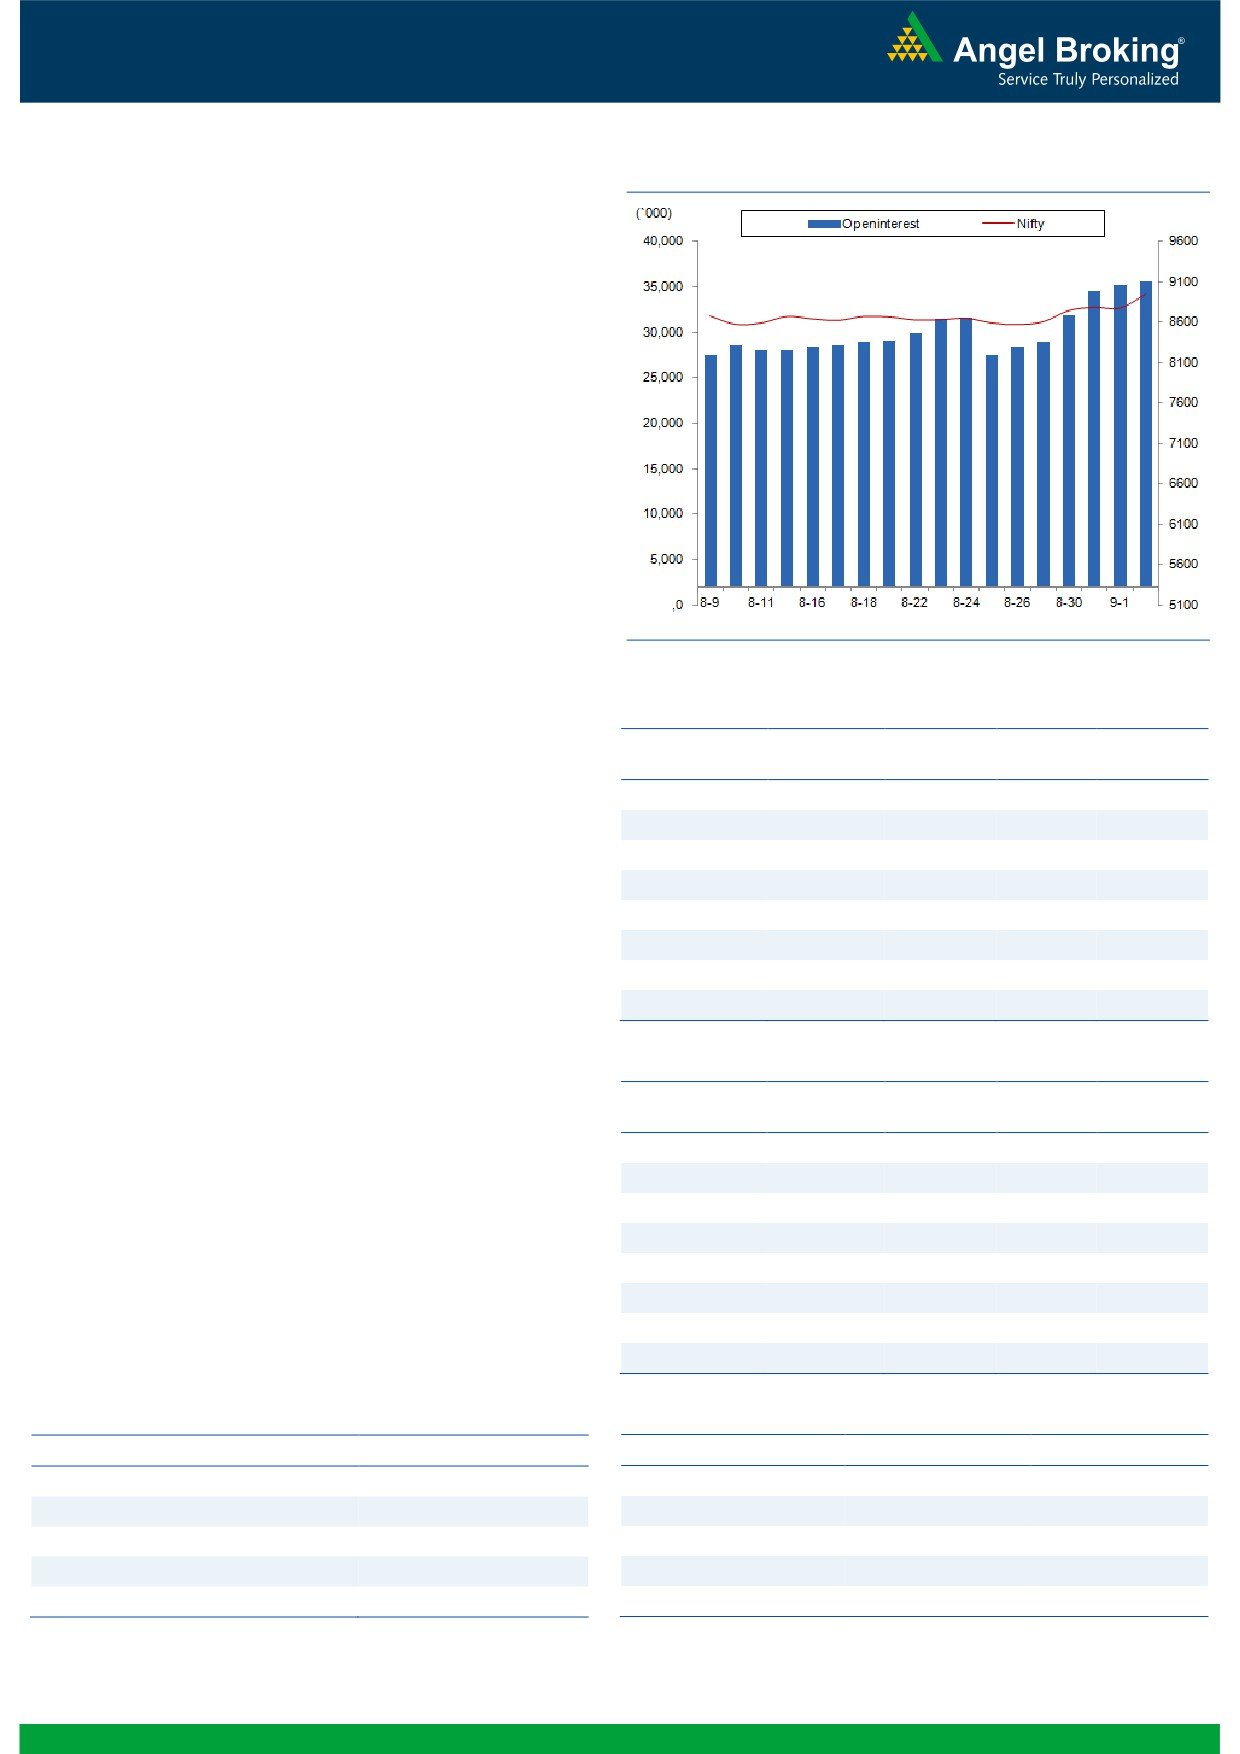
Nifty Bank Outlook - (20426)
Exhibit 2: Nifty Bank Daily Chart
The Nifty Bank index started the week with a gap up opening and
continued its positive momentum throughout the session, gaining
another 2.73%.
Yesterday's follow up buying post a gap up opening was clearly a
sign of continuation of the trend. The upmove was quite on
expected lines as the sectoral heavyweights have been showing
continued strength. Although, the pace at which it swiftly move
higher yesterday was remarkable and a bit surprising. Going
ahead, we continue to maintain our positive stance on the index
and we reiterate our advice that unless any reversal signs seen,
traders should focus on stock specific moves and trade in
direction of the broader uptrend. The intraday support for the
index are placed around 20200 and 20089 and the resistances
are seen around 20541 and 20907.
Key Levels
Support 1 - 20200
Resistance 1 - 20541
Support 2 - 20089
Resistance 2 - 20907
1
Technical & Derivatives Report
September 07, 2016
Comments
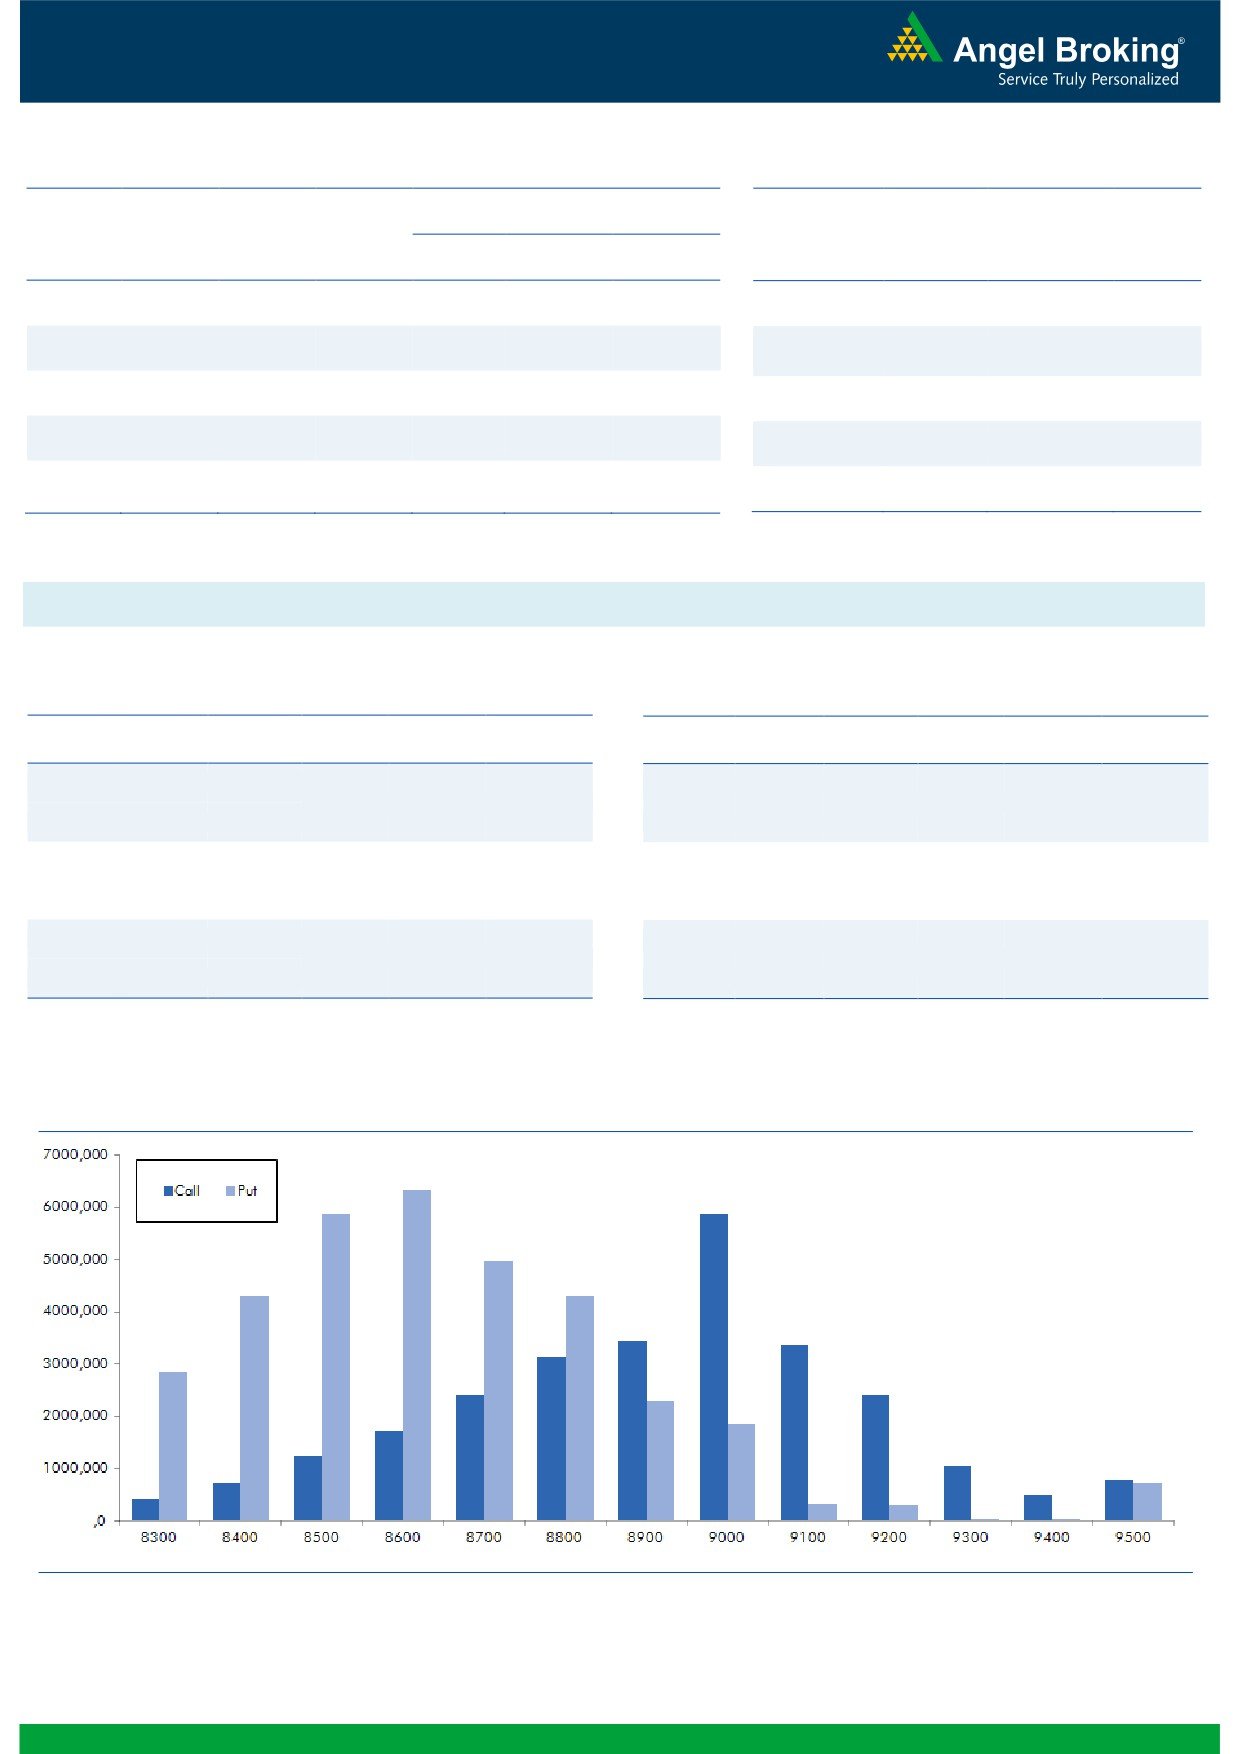
Nifty Vs OI
The Nifty futures open interest has increased by 2.51%
BankNifty futures open interest has increased by 2.32%
as market closed at 8943.00 levels.
The Nifty September future closed with a premium of
18.20 points against a premium of 30.50 points in
previous session. The October series closed at a
premium of 58.25 points.
The Implied Volatility of at the money options has
decreased from 11.03% to 10.89%. At the same time,
the PCR-OI of Nifty has increased from 1.13 to 1.19.
The total OI of the market is Rs. 2,90,418/- cr. and the
stock futures OI is Rs. 83,862/- cr.
Few of the liquid counters where we have seen high cost
of carry are ADANIPOWER, JPASSOCIAT, IBREALEST,
ADANIENT and UBL.
Views
OI Gainers
OI
PRICE
Yesterday, FIIs were net buyers in both equity cash and
SCRIP
OI
PRICE
CHG. (%)
CHG. (%)
index future segment. They bought equities to the tune of
MINDTREE
2768000
36.22
521.00
-5.69
Rs. 1439 crores. While, they were net buyers in index
PETRONET
4677000
18.38
356.10
0.76
future worth Rs. 331 crores with rise in OI, indicating
CAIRN
11469500
15.59
204.05
0.59
formation of fresh longs in last trading session.ngelbroking.com
JUBLFOOD
2139000
13.44
1074.20
-9.46
On Index Options front, FIIs were net buyers of Rs. 818
AMARAJABAT
760800
11.62
1034.20
4.14
crores with rise in OI. In call options, 9200 and 9100
IBULHSGFIN
6959200
6.42
839.65
0.64
strikes added some fresh positions. While, huge
CENTURYTEX
7439300
5.29
769.05
2.77
unwinding was seen in 8900 strike, followed by some
COALINDIA
12552800
5.14
330.05
-1.00
unwinding in 8800 and 8700 strikes. On the other
hand, in put options, 8900 - 8700 strikes added huge
positions; followed by unwinding in 8600 strike. Highest
OI Losers
OI
PRICE
OI in September series is placed at 9000 call and 8600
SCRIP
OI
PRICE
CHG. (%)
CHG. (%)
put option.
CEATLTD
2082500
-29.52
969.35
1.38
Yesterday, FIIs has bought significantly in cash segment.
JUSTDIAL
3742400
-9.85
502.55
5.07
We were quite vocal from last few days that the overall
APOLLOHOSP
402400
-9.61
1408.75
2.26
derivative data is very positive and we may see 8950 -
KSCL
3816000
-8.49
341.75
3.81
9000 levels in near term. Although we reached to the
GODREJCP
423600
-8.47
1626.70
3.33
mentioned zone, we are not seeing any sign of reversal
ACC
1453200
-8.16
1703.10
1.35
as of now. Thus, we advise traders to trade with positive
TORNTPHARM
272800
-7.96
1638.65
1.16
bias and focus more on stock specific moves.
NTPC
23384000
-6.39
162.20
1.98
Historical Volatility
Put-Call Ratio
SCRIP
HV
SCRIP
PCR-OI
PCR-VOL
JUBLFOOD
59.38
NIFTY
1.19
1.24
AXISBANK
35.62
BANKNIFTY
1.54
0.95
JSWSTEEL
31.17
RELIANCE
0.40
0.40
TATAMOTORS
47.40
TATAMOTORS
1.52
0.72
TATAMTRDVR
45.01
SBIN
0.92
0.47
2
Technical & Derivatives Report
September 07, 2016
FII Statistics for 06, September 2016
Turnover on 06, September 2016
Open Interest
No. of
Turnover
Change
Detail
Buy
Sell
Net
Instrument
Value
Contracts
( in Cr. )
(%)
Contracts
Change (%)
(in Cr.)
INDEX
INDEX
2430.66
2099.34
331.33
452263
30977.26
3.14
205774
15069.78
34.64
FUTURES
FUTURES
INDEX
INDEX
36169.27
35351.26
818.00
1096587
75235.22
4.32
3368003
249742.72
75.06
OPTIONS
OPTIONS
STOCK
6941.96
5768.13
1173.83
874284
59522.24
(0.16)
STOCK
FUTURES
546421
39248.97
9.73
FUTURES
STOCK
STOCK
4852.31
4881.01
(28.70)
89199
6355.11
9.01
OPTIONS
318439
23208.56
18.79
OPTIONS
TOTAL
50394.21
48099.75
2294.46
2512333
172089.83
2.66
TOTAL
4438637
327270.04
56.47
Nifty Spot = 8943.00
Lot Size = 75
Bull-Call Spreads
Bear-Put Spreads
Action
Strike
Price
Risk
Reward
BEP
Action
Strike
Price
Risk
Reward
BEP
Buy
9000
78.60
Buy
8900
76.00
37.35
62.65
9037.35
28.70
71.30
8871.30
Sell
9100
41.25
Sell
8800
47.30
Buy
9000
78.60
Buy
8900
76.00
59.40
140.60
9059.40
46.40
153.60
8853.60
Sell
9200
19.20
Sell
8700
29.60
Buy
9100
41.25
Buy
8800
47.30
22.05
77.95
9122.05
17.70
82.30
8782.30
Sell
9200
19.20
Sell
8700
29.60
Note: Above mentioned Bullish or Bearish Spreads in Nifty (September Series) are given as an information and not as a recommendation.
Nifty Put-Call Analysis
3
Technical & Derivatives Report
September 07, 2016
Daily Pivot Levels for Nifty Constituents
Scrips
S2
S1
PIVOT
R1
R2
ACC
1,659
1,679
1,694
1,714
1,728
ADANIPORTS
266
268
270
272
274
AMBUJACEM
274
276
277
279
281
ASIANPAINT
1,153
1,179
1,196
1,222
1,240
AUROPHARMA
766
772
779
785
793
AXISBANK
590
613
625
648
661
BAJAJ-AUTO
2,965
2,985
3,010
3,030
3,056
BANKBARODA
166
168
169
171
173
BHEL
136
137
138
139
140
BPCL
585
592
596
603
607
BHARTIARTL
309
315
319
325
329
INFRATEL
335
341
345
351
355
BOSCH
23,888
24,174
24,337
24,623
24,786
CIPLA
570
574
580
585
591
COALINDIA
321
325
329
333
338
DRREDDY
3,102
3,117
3,131
3,147
3,161
EICHERMOT
22,722
22,835
22,940
23,053
23,158
GAIL
389
396
401
408
413
GRASIM
4,576
4,639
4,694
4,757
4,813
HCLTECH
769
777
783
791
796
HDFCBANK
1,284
1,292
1,298
1,306
1,312
HDFC
1,434
1,446
1,454
1,466
1,474
HEROMOTOCO
3,558
3,587
3,618
3,646
3,678
HINDALCO
156
157
158
160
161
HINDUNILVR
916
927
933
944
951
ICICIBANK
259
266
270
277
281
IDEA
81
83
84
86
87
INDUSINDBK
1,182
1,205
1,219
1,241
1,255
INFY
1,030
1,037
1,043
1,051
1,056
ITC
258
261
263
265
268
KOTAKBANK
811
815
818
822
825
LT
1,494
1,505
1,515
1,526
1,536
LUPIN
1,506
1,521
1,530
1,545
1,554
M&M
1,472
1,481
1,488
1,497
1,504
MARUTI
5,151
5,235
5,285
5,369
5,419
NTPC
159
161
163
165
166
ONGC
236
237
239
241
243
POWERGRID
182
184
186
188
190
RELIANCE
1,010
1,015
1,020
1,025
1,030
SBIN
254
257
259
262
265
SUNPHARMA
773
778
783
788
794
TCS
2,455
2,469
2,495
2,509
2,535
TATAMTRDVR
346
360
368
382
390
TATAMOTORS
543
566
579
603
616
TATAPOWER
77
78
79
79
80
TATASTEEL
370
378
382
390
395
TECHM
462
471
476
485
490
ULTRACEMCO
4,027
4,051
4,078
4,102
4,129
WIPRO
477
480
483
486
488
YESBANK
1,368
1,404
1,427
1,463
1,486
ZEEL
528
533
536
541
544
4
Technical & Derivatives Report
September 07, 2016
Research Team Tel: 022 - 39357800
For Technical Queries
For Derivatives Queries
DISCLAIMER
Angel Broking Private Limited (hereinafter referred to as “Angel”) is a registered Member of National Stock Exchange of India Limited,
Bombay Stock Exchange Limited and Metropolitan Stock Exchange Limited. It is also registered as a Depository Participant with CDSL
and Portfolio Manager with SEBI. It also has registration with AMFI as a Mutual Fund Distributor. Angel Broking Private Limited is a
registered entity with SEBI for Research Analyst in terms of SEBI (Research Analyst) Regulations, 2014 vide registration number
INH000000164. Angel or its associates has not been debarred/ suspended by SEBI or any other regulatory authority for accessing
/dealing in securities Market. Angel or its associates/analyst has not received any compensation / managed or co-managed public
offering of securities of the company covered by Analyst during the past twelve months.
This document is solely for the personal information of the recipient, and must not be singularly used as the basis of any investment
decision. Nothing in this document should be construed as investment or financial advice. Each recipient of this document should
make such investigations as they deem necessary to arrive at an independent evaluation of an investment in the securities of the
companies referred to in this document (including the merits and risks involved), and should consult their own advisors to determine
the merits and risks of such an investment.
Reports based on technical and derivative analysis center on studying charts of a stock's price movement, outstanding positions and
trading volume, as opposed to focusing on a company's fundamentals and, as such, may not match with a report on a company's
fundamentals. Investors are advised to refer the Fundamental and Technical Research Reports available on our website to evaluate the
contrary view, if any.
The information in this document has been printed on the basis of publicly available information, internal data and other reliable
sources believed to be true, but we do not represent that it is accurate or complete and it should not be relied on as such, as this
document is for general guidance only. Angel Broking Pvt. Limited or any of its affiliates/ group companies shall not be in any way
responsible for any loss or damage that may arise to any person from any inadvertent error in the information contained in this report.
Angel Broking Pvt. Limited has not independently verified all the information contained within this document. Accordingly, we cannot
testify, nor make any representation or warranty, express or implied, to the accuracy, contents or data contained within this document.
While Angel Broking Pvt. Limited endeavors to update on a reasonable basis the information discussed in this material, there may be
regulatory, compliance, or other reasons that prevent us from doing so.
This document is being supplied to you solely for your information, and its contents, information or data may not be reproduced,
redistributed or passed on, directly or indirectly.
Neither Angel Broking Pvt. Limited, nor its directors, employees or affiliates shall be liable for any loss or damage that may arise from
or in connection with the use of this information.
5