Technical & Derivatives Report
June 07, 2016
Sensex (26777) / Nifty (8201)
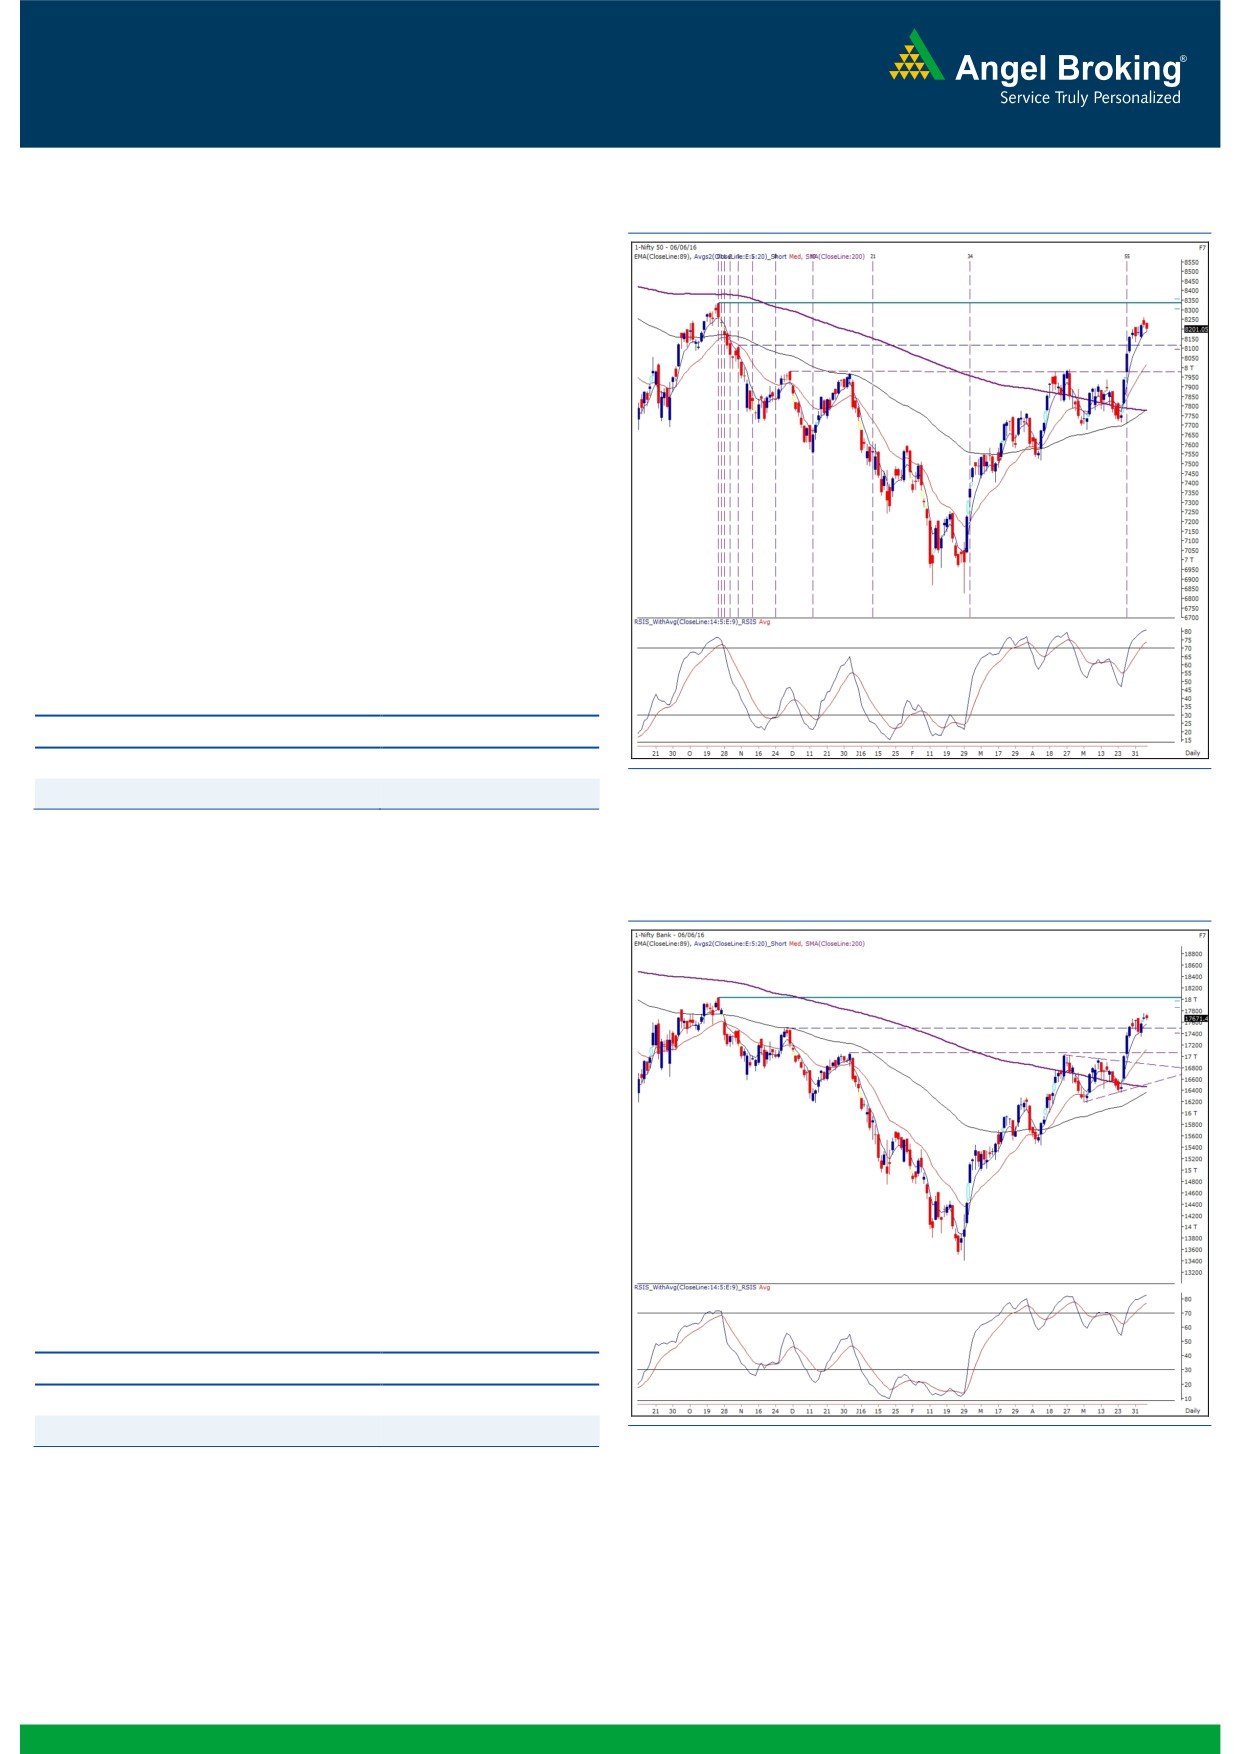
Exhibit 1: Nifty Daily Chart
Trading for the week began on a flat note citing to muted action
across the globe. Subsequently, we witnessed Nifty correcting a
bit throughout the day. However, the overall range was small and
hence, due to minor recovery the Nifty managed to close tad
above the 8200 mark.
If we look at the daily chart, it can be clearly seen that the Nifty
rebounded a bit after posting an intraday low at the '5 days EMA'.
As mentioned in the previous report, short term traders shouldn't
be expecting any profit booking until Nifty manages to hold the '5
days EMA' on a closing basis. On the downside, 8175 - 8134
levels would be seen as important support levels; whereas, we
continue to see the index gradually moving towards the next
swing high of 8336. Today's session is likely trade with a higher
volatility on account of RBI Monetary policy and thus, traders
should position themselves accordingly.
Key Levels
Support 1 - 8175
Resistance 1 - 8250
Support 2 - 8134
Resistance 2 - 8336
Exhibit 2: Nifty Bank Daily Chart
Nifty Bank Outlook - (17671)
It was a day of inactivity as the index traded in a range of merely
109 points during the entire trading session. Hence, the chart
structure remains unchanged. The small candles in last two
trading sessions indicate that the participants are waiting for
some trigger for further directional movement. As RBI's Second Bi-
monthly Monetary Policy for 2016-17 is scheduled today, there
could be some intraday volatility seen in the index. However, the
broader trend continues to be positive as there are no reversal
indications so far on charts. Traders are hence advised against
going short on the market and continue with the long positions in
the index. The intraday support for the index is placed around
17596 and 17350; whereas, resistances are seen around 17780
and 18030 levels.
Key Levels
Support 1 - 17596
Resistance 1 - 17780
Support 2 - 17350
Resistance 2 - 18030
1
Technical & Derivatives Report
June 07, 2016
Comments
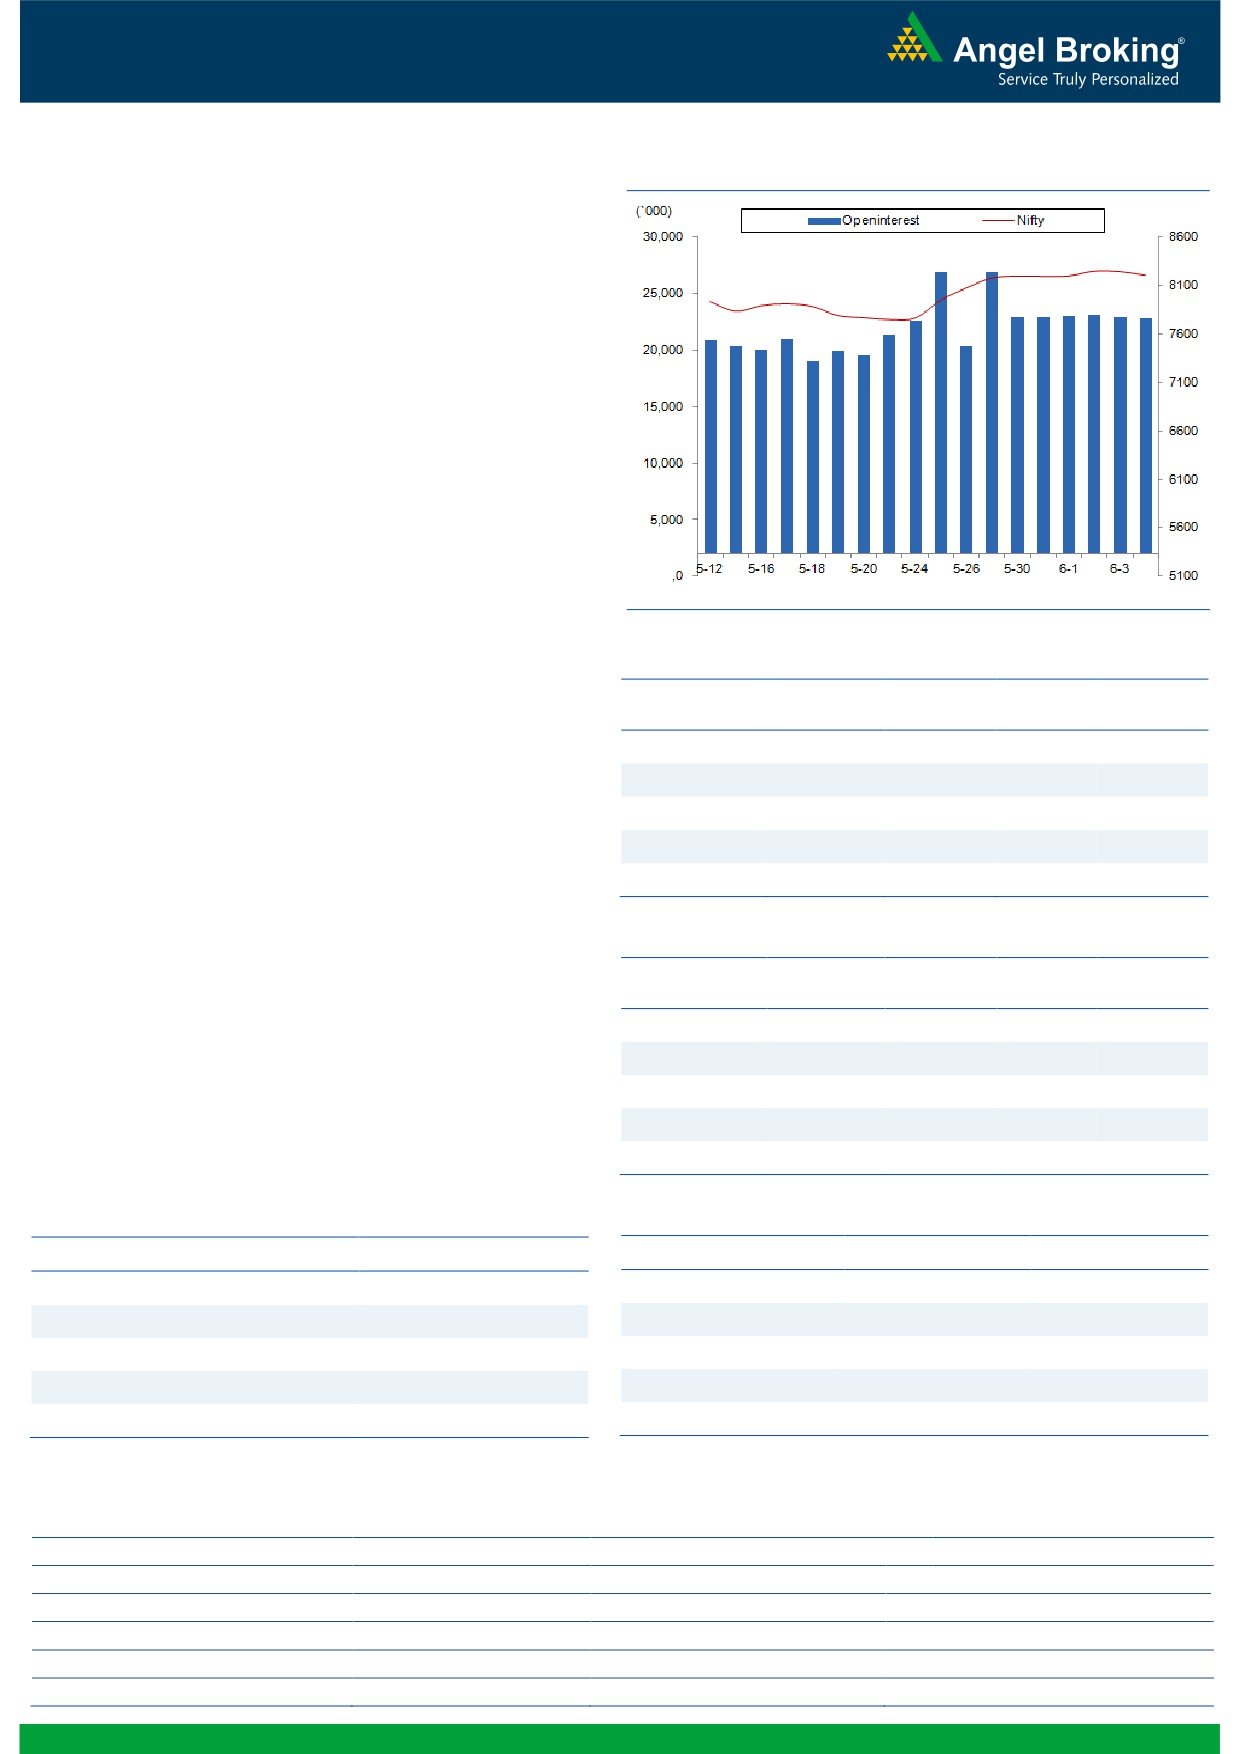
Nifty Vs OI
The Nifty futures open interest has decreased by 0.77%
BankNifty futures open interest has decreased by 3.02%
as market closed at 8201.05 levels.
The Nifty June future closed with a premium of 28.75
points against a premium of 18.10 points in previous
session. The July series closed at a premium of 54.50
points.
The Implied Volatility of at the money options has
increased from 13.10% to 13.86%.
The total OI of the market is Rs. 2,22,384/- cr. and the
stock futures OI is Rs. 65,295/- cr.
Few of the liquid counters where we have seen high cost
of carry are UNITECH, GMRINFRA, JPASSOCIAT,
JISLJALEQS and NCC.
OI Gainers
Views
OI
PRICE
SCRIP
OI
PRICE
CHG. (%)
CHG. (%)
FIIs activity in cash market segment remained subdued.
BIOCON
3485900
10.77
731.30
3.23
In Index Futures, they were net buyers to the tune of Rs.
KTKBANK
14856000
9.33
135.90
7.39
Rs.517 crores with rise in open interest, suggesting fresh
HINDALCO
39978000
7.99
107.55
1.41
long formation in last trading session.
On Index Options front, FIIs sold marginally with some
SUNPHARMA
20385000
7.42
729.20
-1.69
rise in OI. We hardly saw any relevant build-upoorng.com
GODREJIND
1366100
7.15
363.85
1.39
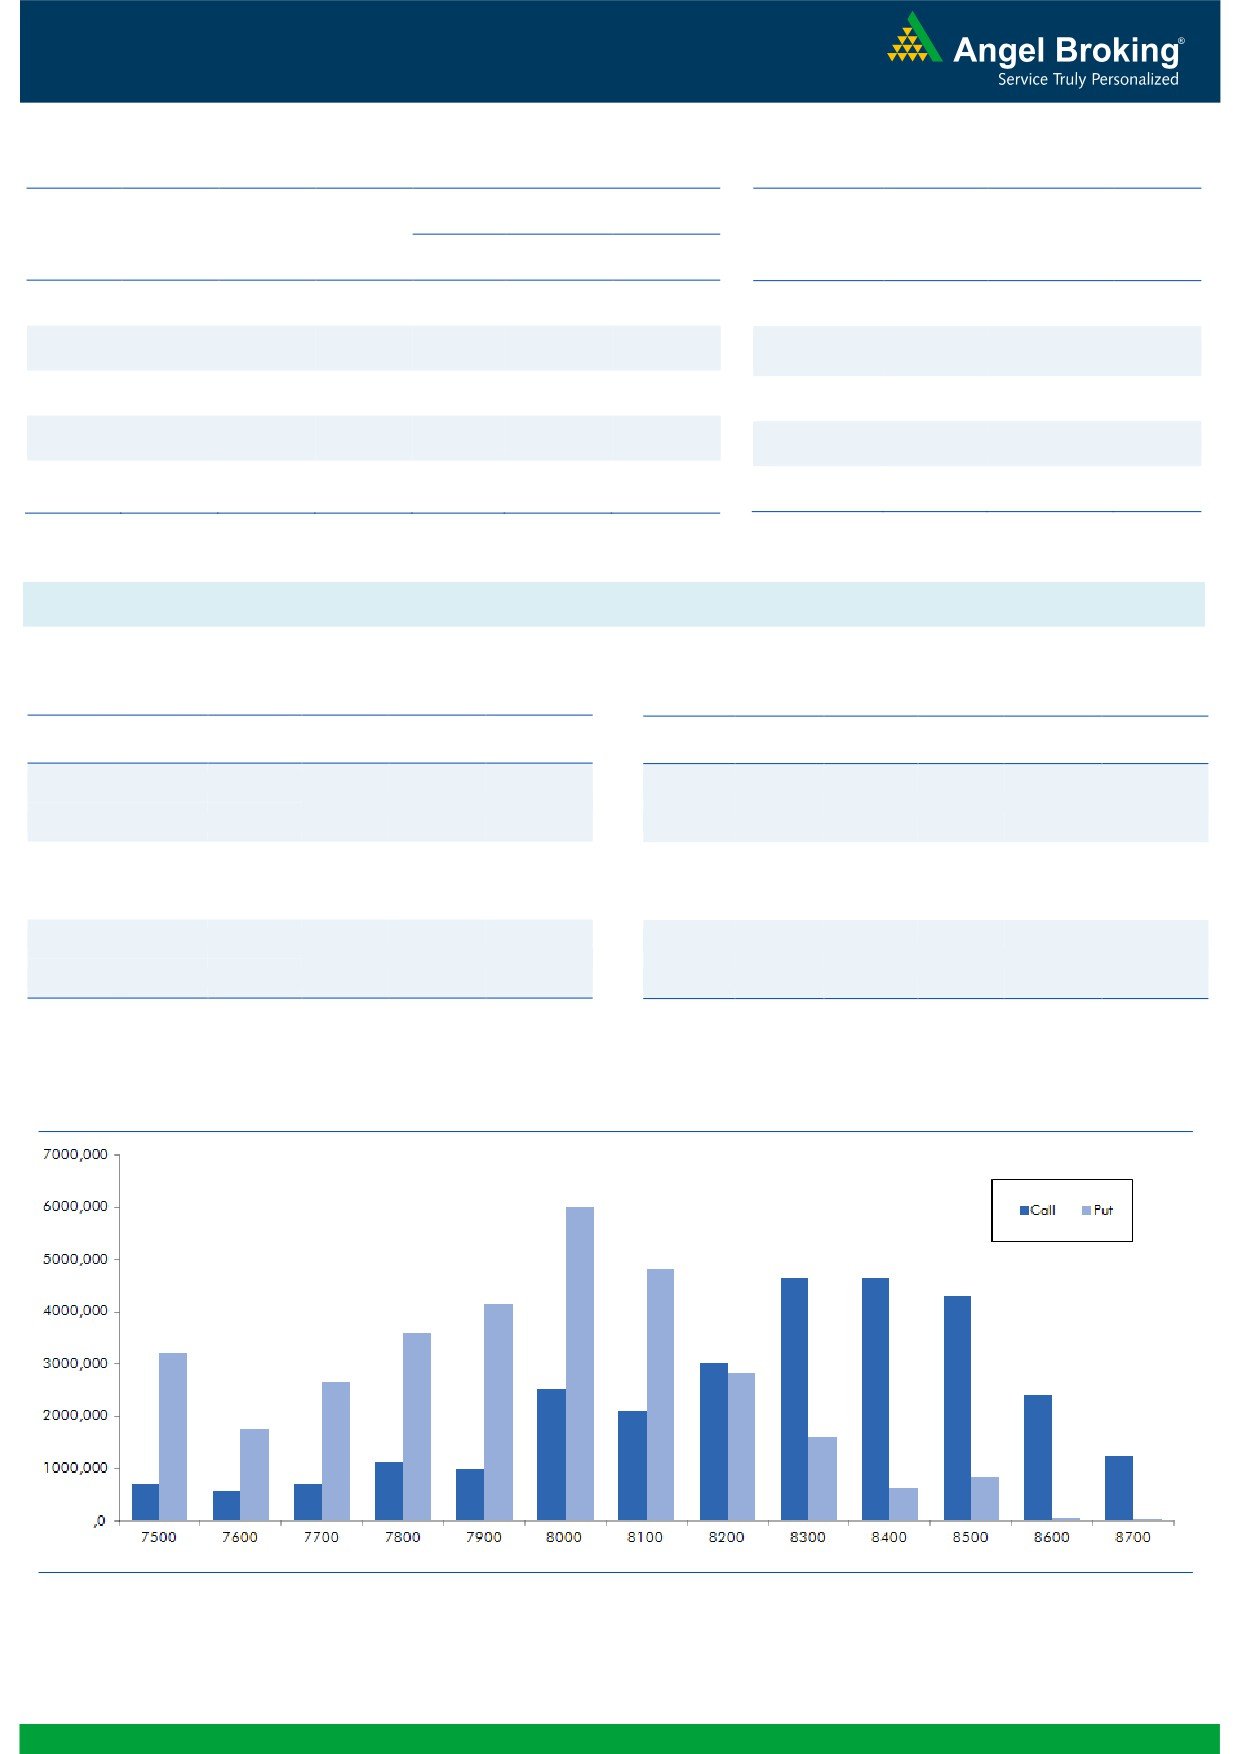
unwinding in Nifty options yesterday. Maximum open
intrest in current series is visible in 8400 call and 8000
OI Losers
put options. Large cap counters that added fresh longs in
OI
PRICE
SCRIP
OI
PRICE
yesterday’s trading session and can be traded with a
CHG. (%)
CHG. (%)
positive bias are HINDALCO, M&M, YESBANK and SBIN.
GODREJCP
414400
-9.12
1530.10
-2.90
While heavy weights that added shorts are SUNPHARMA,
UBL
3020100
-5.82
730.35
-0.24
LUPIN and COALINDIA.
TATASTEEL
23142000
-5.23
340.10
0.15
HINDUNILVR
5070000
-4.64
876.00
-0.46
MARUTI
2089450
-4.46
4161.00
-1.65
Historical Volatility
Put-Call Ratio
SCRIP
HV
SCRIP
PCR-OI
PCR-VOL
PTC
41.06
NIFTY
1.06
1.07
KTKBANK
53.54
BANKNIFTY
1.01
1.01
FEDERALBNK
41.67
SBIN
0.77
0.63
GLENMARK
32.87
SUNPHARMA
0.39
0.34
SOUTHBANK
29.64
RELIANCE
0.73
0.42
Strategy Date
Symbol
Strategy
Status
May 30, 2016
TCS
Ratio Bull Call Spread
Active
June 06, 2016
NIFTY
Long Call
Active
2
Technical & Derivatives Report
June 07, 2016
FII Statistics for 06-June 2016
Turnover on 06-June 2016
Open Interest
No. of
Turnover
Change
Detail
Buy
Sell
Net
Instrument
Value
Contracts
( in Cr. )
(%)
Contracts
Change (%)
(in Cr.)
INDEX
INDEX
1357.17
840.58
516.59
294294
17828.92
0.98
1,67,258
9673.85
-15.39
FUTURES
FUTURES
INDEX
INDEX
8633.95
8729.58
(95.63)
948879
57862.49
0.80
13,04,741
77596.42
-19.79
OPTIONS
OPTIONS
STOCK
3811.85
4448.73
(636.88)
1068751
52595.51
0.29
STOCK
FUTURES
4,33,757
22429.28
-20.65
FUTURES
STOCK
STOCK
2090.57
2079.39
11.18
80950
4156.33
3.99
OPTIONS
2,31,247
12110.86
-19.05
OPTIONS
TOTAL
15893.55
16098.28
(204.74)
2392874
132443.25
0.70
TOTAL
21,37,003
121810.42
-19.55
Nifty Spot = 8201.05
Lot Size = 75
Bull-Call Spreads
Bear-Put Spreads
Action
Strike
Price
Risk
Reward
BEP
Action
Strike
Price
Risk
Reward
BEP
Buy
8200
132.25
Buy
8200
104.05
50.50
49.50
8250.50
34.30
65.70
8165.70
Sell
8300
81.75
Sell
8100
69.75
Buy
8200
132.25
Buy
8200
104.05
86.80
113.20
8286.80
57.95
142.05
8142.05
Sell
8400
45.45
Sell
8000
46.10
Buy
8300
81.75
Buy
8100
69.75
36.30
63.70
8336.30
23.65
76.35
8076.35
Sell
8400
45.45
Sell
8000
46.10
Note: Above mentioned Bullish or Bearish Spreads in Nifty (June Series) are given as an information and not as a recommendation.
Nifty Put-Call Analysis
3
Technical & Derivatives Report
June 07, 2016
Daily Pivot Levels for Nifty Constituents
Scrips
S2
S1
PIVOT
R1
R2
ACC
1,525
1,530
1,537
1,542
1,550
ADANIPORTS
193
198
201
207
210
AMBUJACEM
226
227
230
231
233
ASIANPAINT
1,009
1,018
1,025
1,034
1,041
AUROPHARMA
764
772
783
791
802
AXISBANK
521
527
536
542
551
BAJAJ-AUTO
2,602
2,616
2,633
2,647
2,664
BANKBARODA
139
141
143
145
147
BHEL
116
117
118
119
121
BPCL
979
986
998
1,006
1,017
BHARTIARTL
340
344
352
356
364
INFRATEL
369
372
379
382
388
BOSCH
21,989
22,090
22,215
22,317
22,442
CIPLA
462
464
468
470
474
COALINDIA
302
304
306
308
311
DRREDDY
3,106
3,129
3,149
3,171
3,192
EICHERMOT
18,620
18,807
18,936
19,124
19,253
GAIL
364
369
373
379
383
GRASIM
4,279
4,299
4,321
4,341
4,364
HCLTECH
710
717
723
730
736
HDFCBANK
1,162
1,167
1,175
1,179
1,187
HDFC
1,238
1,245
1,255
1,262
1,272
HEROMOTOCO
3,060
3,087
3,120
3,147
3,180
HINDALCO
103
105
106
108
110
HINDUNILVR
865
872
882
889
899
ICICIBANK
240
242
244
246
248
IDEA
103
105
106
107
108
INDUSINDBK
1,108
1,115
1,122
1,129
1,137
INFY
1,252
1,260
1,268
1,275
1,284
ITC
349
352
355
358
360
KOTAKBANK
755
760
768
773
780
LT
1,455
1,462
1,468
1,474
1,480
LUPIN
1,382
1,401
1,433
1,451
1,484
M&M
1,347
1,358
1,372
1,384
1,398
MARUTI
4,060
4,101
4,159
4,200
4,258
NTPC
145
146
147
148
149
ONGC
208
210
211
213
215
POWERGRID
147
148
150
150
152
RELIANCE
946
951
957
961
967
SBIN
194
196
200
202
205
SUNPHARMA
704
714
732
742
760
TCS
2,582
2,597
2,618
2,633
2,654
TATAMTRDVR
306
312
317
323
328
TATAMOTORS
444
452
459
467
473
TATAPOWER
72
73
74
75
76
TATASTEEL
328
333
337
342
345
TECHM
524
532
542
550
560
ULTRACEMCO
3,166
3,197
3,220
3,251
3,275
WIPRO
528
532
537
540
545
YESBANK
1,035
1,050
1,059
1,074
1,084
ZEEL
448
451
454
457
460
4
Technical & Derivatives Report
June 07, 2016
Research Team Tel: 022 - 39357800
For Technical Queries
For Derivatives Queries
DISCLAIMER
Angel Broking Private Limited (hereinafter referred to as “Angel”) is a registered Member of National Stock Exchange of India Limited,
Bombay Stock Exchange Limited and MCX Stock Exchange Limited. It is also registered as a Depository Participant with CDSL and
Portfolio Manager with SEBI. It also has registration with AMFI as a Mutual Fund Distributor. Angel Broking Private Limited is a
registered entity with SEBI for Research Analyst in terms of SEBI (Research Analyst) Regulations, 2014 vide registration number
INH000000164. Angel or its associates has not been debarred/ suspended by SEBI or any other regulatory authority for accessing
/dealing in securities Market. Angel or its associates including its relatives/analyst do not hold any financial interest/beneficial
ownership of more than 1% in the company covered by Analyst. Angel or its associates/analyst has not received any compensation /
managed or co-managed public offering of securities of the company covered by Analyst during the past twelve months. Angel/analyst
has not served as an officer, director or employee of company covered by Analyst and has not been engaged in market making activity
of the company covered by Analyst.
This document is solely for the personal information of the recipient, and must not be singularly used as the basis of any investment
decision. Nothing in this document should be construed as investment or financial advice. Each recipient of this document should
make such investigations as they deem necessary to arrive at an independent evaluation of an investment in the securities of the
companies referred to in this document (including the merits and risks involved), and should consult their own advisors to determine
the merits and risks of such an investment.
Reports based on technical and derivative analysis center on studying charts of a stock's price movement, outstanding positions and
trading volume, as opposed to focusing on a company's fundamentals and, as such, may not match with a report on a company's
fundamentals.
The information in this document has been printed on the basis of publicly available information, internal data and other reliable
sources believed to be true, but we do not represent that it is accurate or complete and it should not be relied on as such, as this
document is for general guidance only. Angel Broking Pvt. Limited or any of its affiliates/ group companies shall not be in any way
responsible for any loss or damage that may arise to any person from any inadvertent error in the information contained in this report.
Angel Broking Pvt. Limited has not independently verified all the information contained within this document. Accordingly, we cannot
testify, nor make any representation or warranty, express or implied, to the accuracy, contents or data contained within this document.
While Angel Broking Pvt. Limited endeavors to update on a reasonable basis the information discussed in this material, there may be
regulatory, compliance, or other reasons that prevent us from doing so.
This document is being supplied to you solely for your information, and its contents, information or data may not be reproduced,
redistributed or passed on, directly or indirectly.
Neither Angel Broking Pvt. Limited, nor its directors, employees or affiliates shall be liable for any loss or damage that may arise from
or in connection with the use of this information.
Note: Please refer to the important ‘Stock Holding Disclosure' report on the Angel website (Research Section). Also, please refer to the
latest update on respective stocks for the disclosure status in respect of those stocks. Angel Broking Pvt. Limited and its affiliates may
have investment positions in the stocks recommended in this report.
5