Technical & Derivatives Report
April 07, 2016
Sensex (24901) / Nifty (7614)
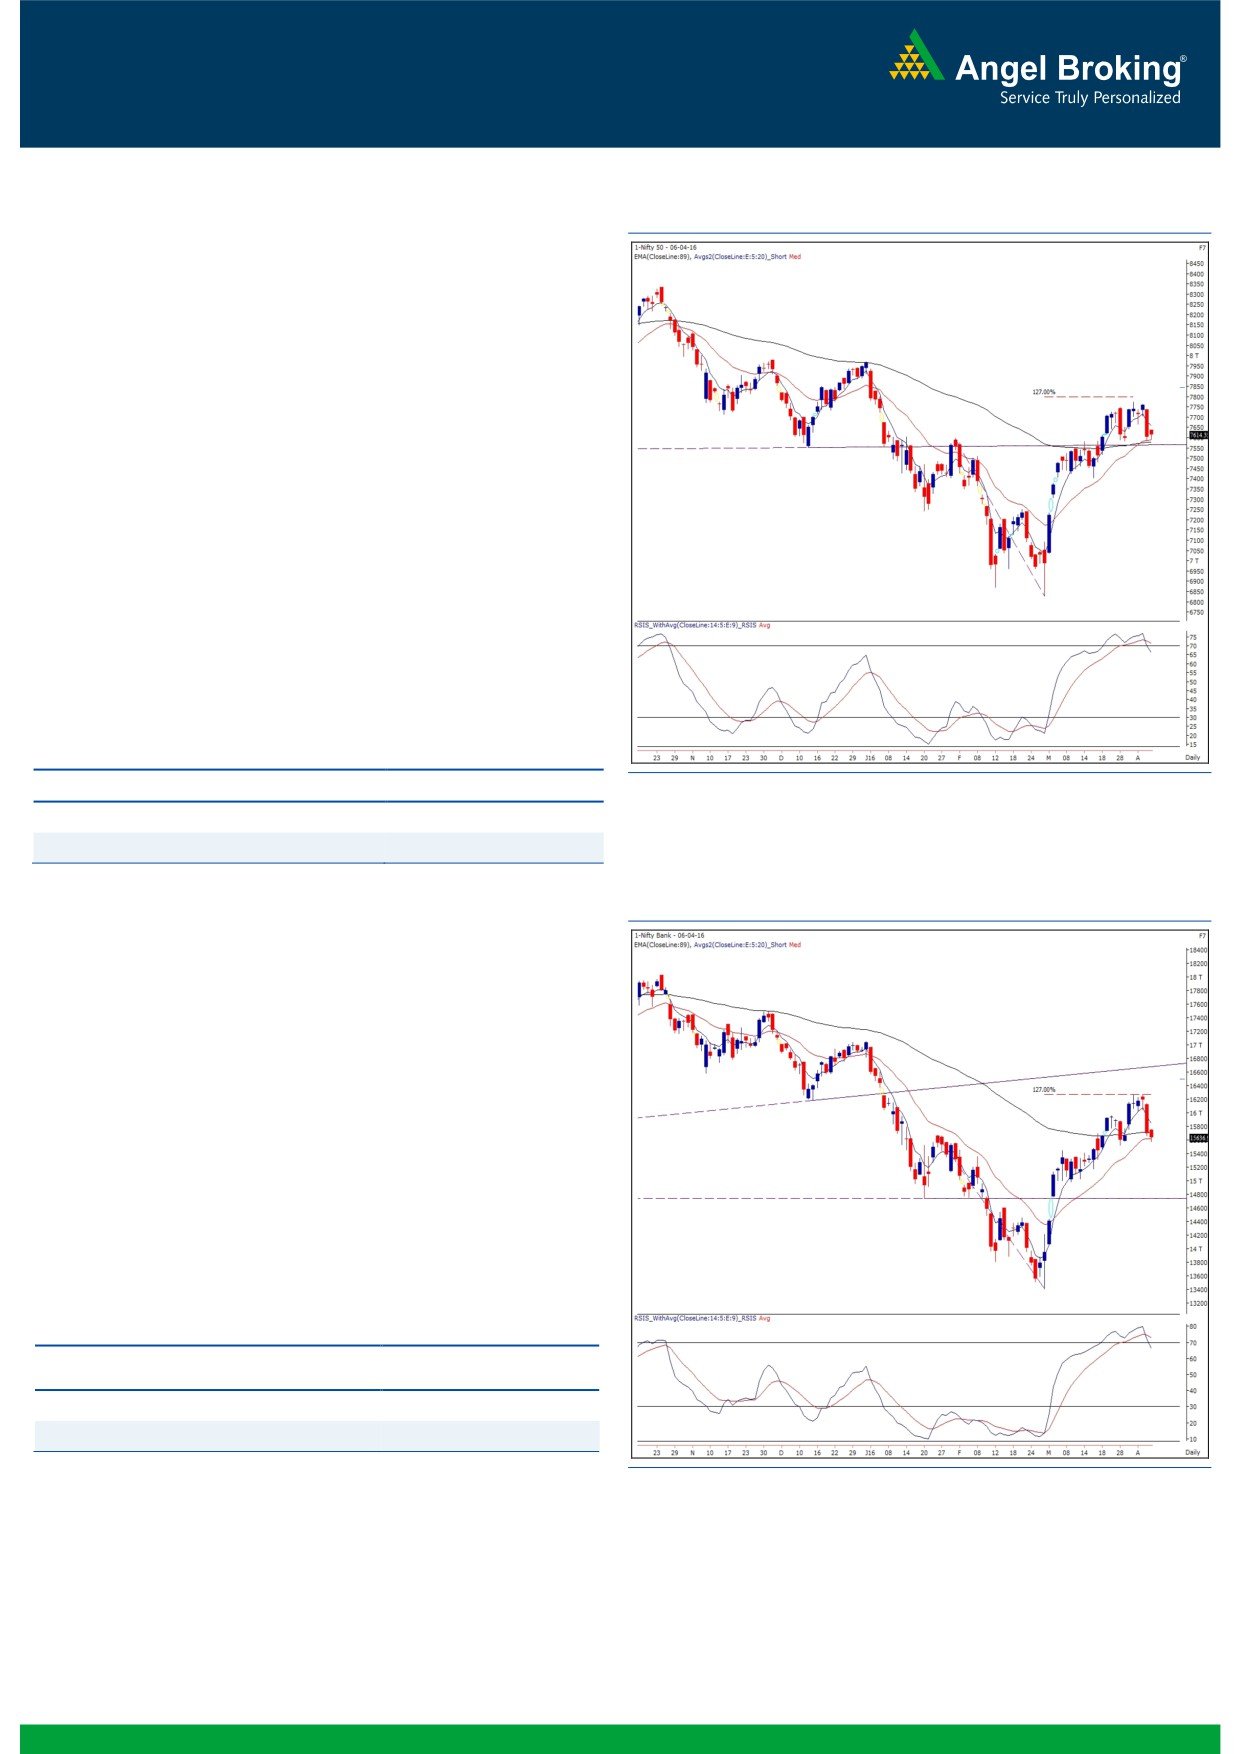
Exhibit 1: Nifty Daily Chart
A decent correction post the RBI Monetary policy was followed by
a flat opening citing to mixed global cues. Subsequently, the Nifty
corrected a bit to test the strong support level of 7580. However,
due to lack of follow through selling we saw index rebounding tad
above the 7600 mark by posting a dull day.
Yesterday’s session traded within a narrow range and has shown
no clear bias at the close. In last couple of weeks, the Nifty has
taken a support at the 7580 mark on four occasions; indicating
significance of this level. Despite being a strong support, we
expect the Nifty to sneak below this level soon. The important
evidence behind this opinion is the negative placement of the
daily ‘RSI-Smoothened’ oscillator. Going forward, we expect the
Nifty to test 7520 - 7480 levels. Thus, any intraday bounce
towards 7660 - 7700 could be a shorting opportunity for
momentum traders.
Key Levels
Support 1 - 7520
Resistance 1 - 7660
Support 2 - 7480
Resistance 2 - 7700
Exhibit 2: Nifty Bank Daily Chart
Nifty Bank Outlook - (15637)
In yesterday's trading session, the Nifty Bank index traded in a
narrow range of 190 points and ended the session with marginal
losses of 0.37%.
The index on Monday had corrected from its resistance zone
which is a bearish indication and the small body candle in
yesterday's session does not indicate any change to the short term
trend. Thus, the index can trade in a range with a negative bias at
least for next couple of days. Traders are hence advised to trade
on stock specific moves with a proper risk management. The
intraday support for the index is placed around 15530 and
15375; whereas, resistances are seen around 15780 and 15970.
Key Levels
Support 1 - 15530
Resistance 1 - 15780
Support 2 - 15375
Resistance 2 - 15970
1
Technical & Derivatives Report
April 07, 2016
Comments
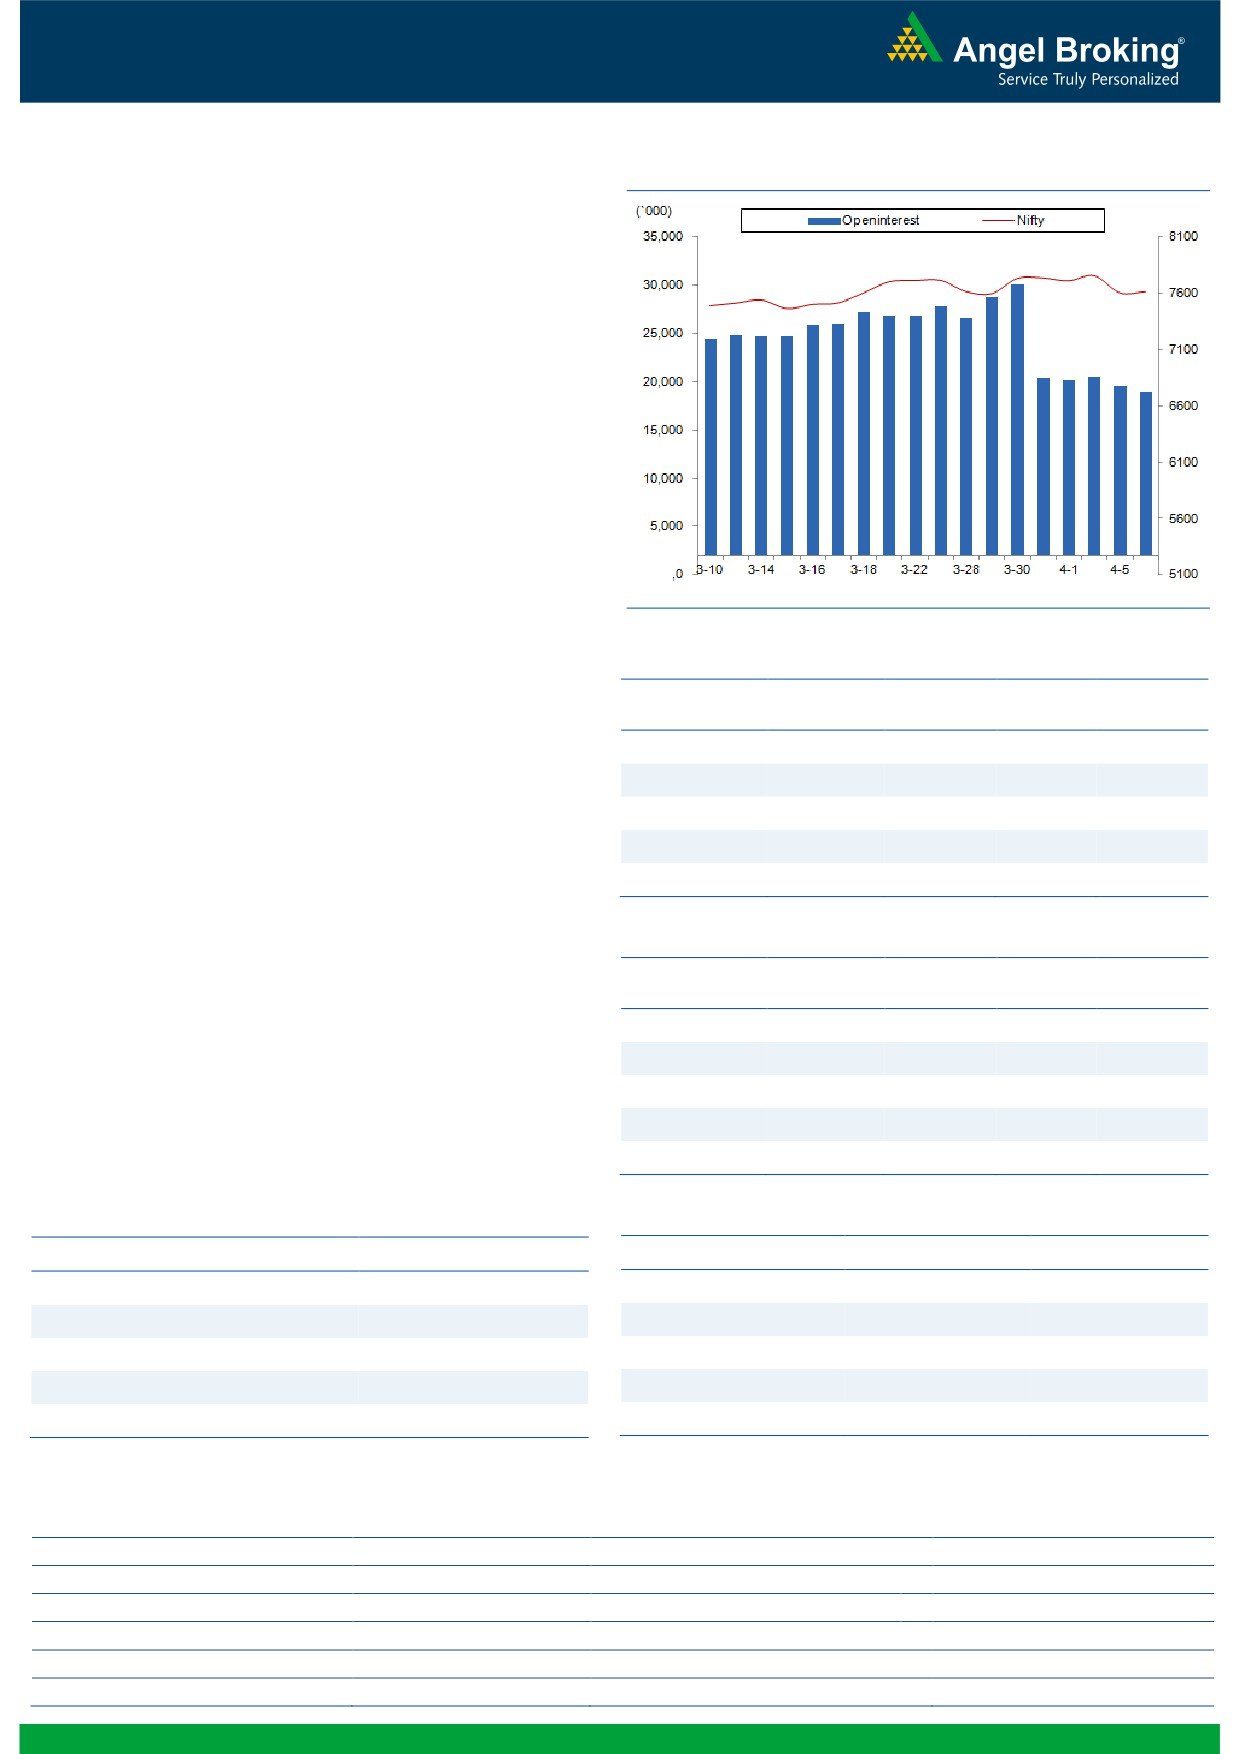
Nifty Vs OI
The Nifty futures open interest has decreased by 3.46%
BankNifty futures open interest has decreased by 0.07%
as market closed at 7614.35 levels.
The Nifty April future closed at a premium of 20.35
points against a premium of 20.30 points. The May
series closed at a premium of 53.40 points.
The Implied Volatility of at the money options has
decreased from 16.46% to 15.50%.
The total OI of the market is Rs. 1,93,697/- cr. and the
stock futures OI is Rs. 52,960/- cr.
Few of the liquid counters where we have seen high cost
of carry are JPASSOCIAT, UNITECH, GMRINFRA,
ADANIPOWER and RCOM.
Views
FIIs continue to sell in both cash market and Index
OI Gainers
Futures. They sold equities to the tune of Rs. 494 crores.
OI
PRICE
While in Index Futures, they were net seller of Rs. 770
SCRIP
OI
PRICE
CHG. (%)
CHG. (%)
crores with some fall in rise in OI, suggesting blend of
HAVELLS
3226000
26.91
327.45
4.49
both long unwinding and short formation in last trading
BEML
736000
11.68
941.90
-3.27
session.
TATASTEEL
25534000
11.46
328.55
5.40
In Index Options front, FIIs were net sellers of Rs. 780
GRASIM
903750
9.71
3912.60
2.43
crores with rise in OI. PCR-OI decreased from 0.79 tong.com
AMARAJABAT
583200
8.97
877.70
-1.10
0.78 with fall in IV’s suggesting short formation in call
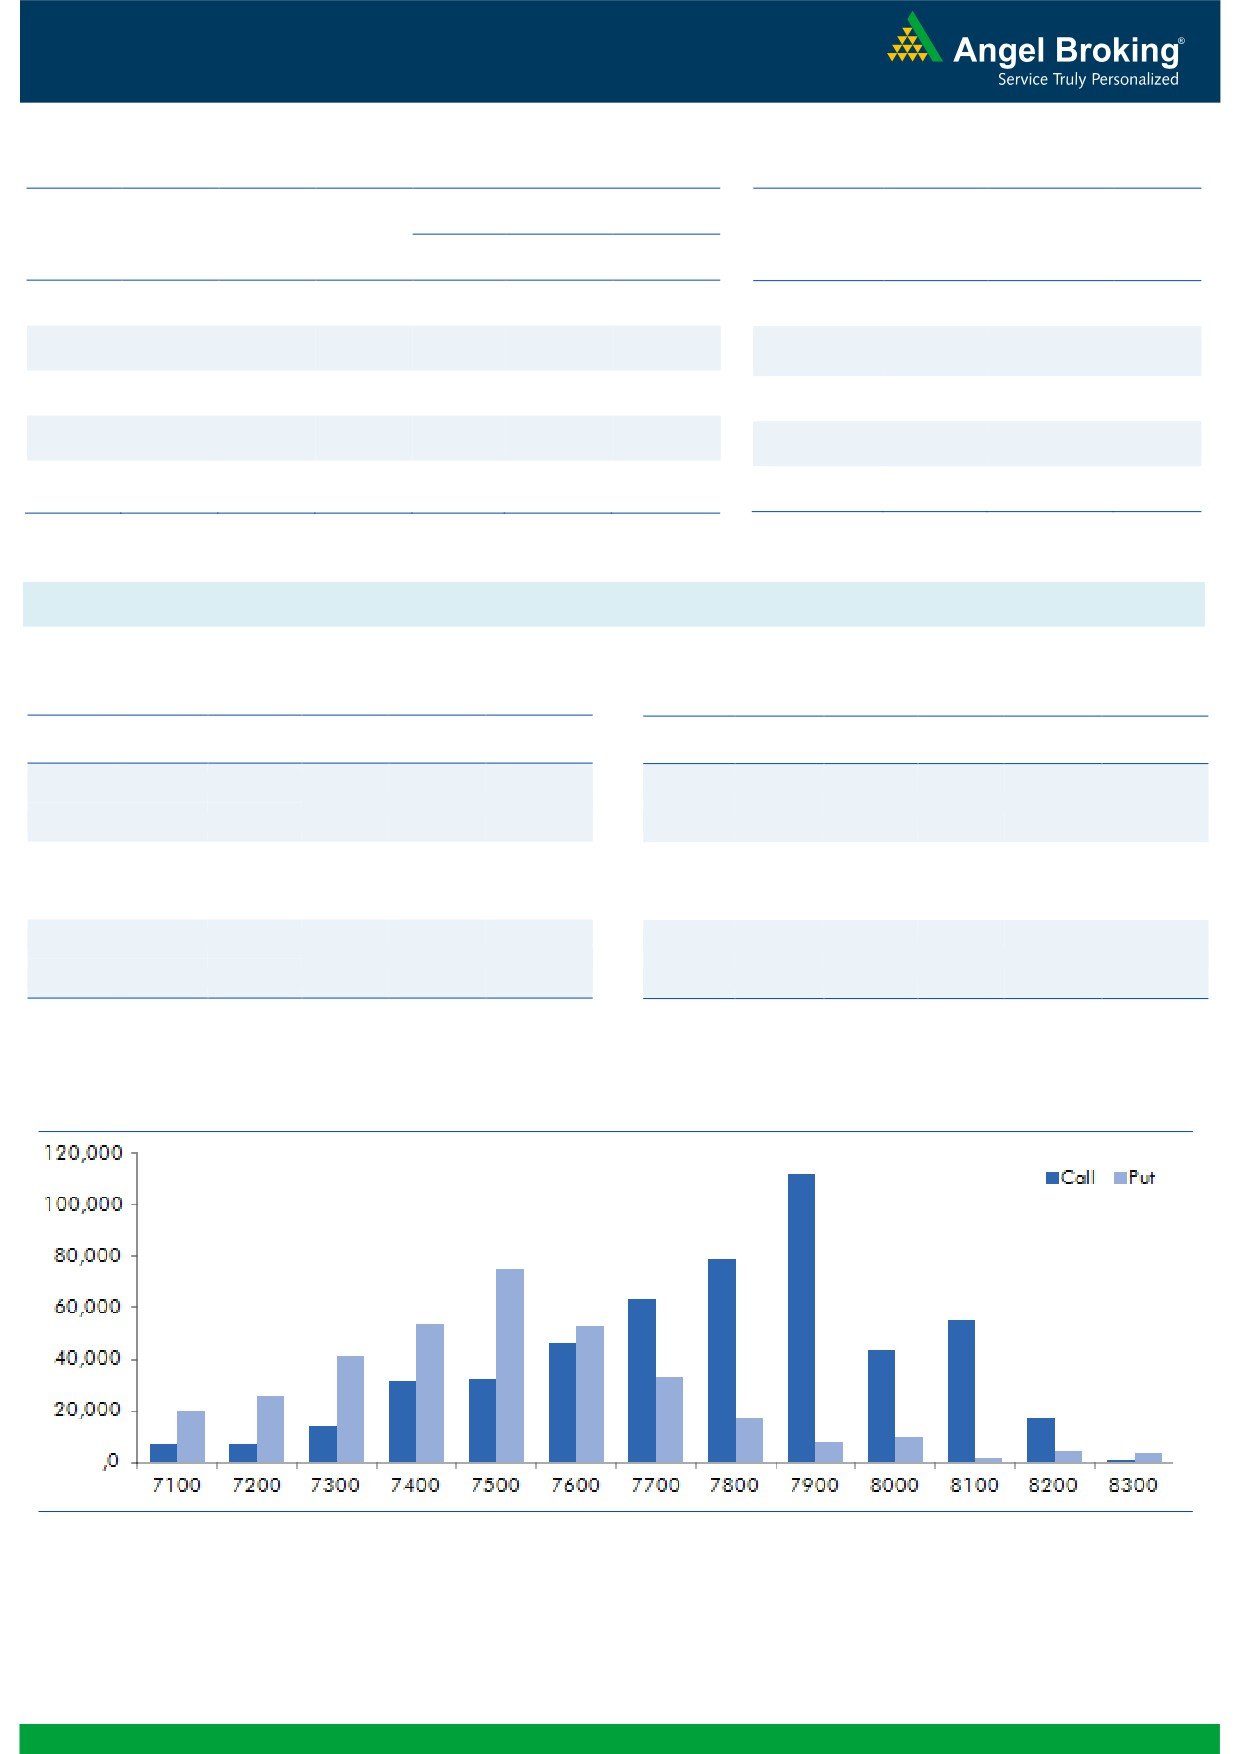
options. In call options, out of the money strikes 7900,
OI Losers
8000 and 8200 strikes added good amount of build-up.
OI
PRICE
Whereas, in put options, 7500 strike was active and
SCRIP
OI
PRICE
CHG. (%)
CHG. (%)
some fresh OI addition was also visible. Maximum OI in
HINDZINC
7052800
-11.98
162.20
1.18
current series is visible in 8000 call and 7500 put
HEXAWARE
3218000
-7.58
256.10
1.94
options. From past
2-3 trading sessions we are
M&M
3354400
-5.66
1220.35
0.36
witnessing good amount of profit booking and fresh
ONGC
16836000
-4.41
206.10
0.36
short formation by FIIs. We would suggest avoiding fresh
EICHERMOT
166525
-4.32
19179.85
1.99
longs in this market, we may see further pain.
Historical Volatility
Put-Call Ratio
SCRIP
HV
SCRIP
PCR-OI
PCR-VOL
CENTURYTEX
59.03
NIFTY
0.78
0.85
BHARATFORG
43.10
BANKNIFTY
0.62
0.81
APOLLOTYRE
45.50
SBIN
0.33
0.42
INDIACEM
58.27
ICICIBANK
0.40
0.59
SRF
43.22
LUPIN
0.53
0.70
Strategy Date
Symbol
Strategy
Status
April 04, 2016
TCS
Ratio Bear Put Spread
Active
2
Technical & Derivatives Report
April 07, 2016
FII Statistics for 05-April 2016
Turnover on 05-April 2016
Open Interest
No. of
Turnover
Change
Detail
Buy
Sell
Net
Instrument
Value
Contracts
( in Cr. )
(%)
Contracts
Change (%)
(in Cr.)
INDEX
INDEX
1015.24
1785.20
(769.95)
238399
13317.54
(1.96)
241736
12822.74
-48.82
FUTURES
FUTURES
INDEX
INDEX
22789.13
23568.88
(779.75)
996662
56316.69
3.34
2300570
130116.17
-39.64
OPTIONS
OPTIONS
STOCK
3854.15
3348.22
505.93
980121
45049.69
0.33
STOCK
FUTURES
498144
24071.99
-15.09
FUTURES
STOCK
STOCK
2163.39
2149.80
13.59
45314
2082.37
15.61
OPTIONS
240797
12023.14
-16.81
OPTIONS
TOTAL
29821.91
30852.09
(1030.17)
2260496
116766.30
1.66
TOTAL
3281247
179034.04
-36.83
Nifty Spot = 7603.20
Lot Size = 75
Bull-Call Spreads
Bear-Put Spreads
Action
Strike
Price
Risk
Reward
BEP
Action
Strike
Price
Risk
Reward
BEP
Buy
7600
132.60
Buy
7600
102.70
50.05
49.95
7650.05
33.80
66.20
7566.20
Sell
7700
82.55
Sell
7500
68.90
Buy
7600
132.60
Buy
7600
102.70
85.70
114.30
7685.70
57.15
142.85
7542.85
Sell
7800
46.90
Sell
7400
45.55
Buy
7700
82.55
Buy
7500
68.90
35.65
64.35
7735.65
23.35
76.65
7476.65
Sell
7800
46.90
Sell
7400
45.55
Note: Above mentioned Bullish or Bearish Spreads in Nifty (April Series) are given as an information and not as a recommendation.
Nifty Put-Call Analysis
3
Technical & Derivatives Report
April 07, 2016
Daily Pivot Levels for Nifty Constituents
Scrips
S2
S1
PIVOT
R1
R2
ACC
1,370
1,380
1,398
1,408
1,426
ADANIPORTS
212
219
231
238
249
AMBUJACEM
222
224
227
230
233
ASIANPAINT
849
859
872
883
896
AUROPHARMA
728
740
753
765
778
AXISBANK
419
426
438
444
456
BAJAJ-AUTO
2,333
2,364
2,417
2,448
2,501
BANKBARODA
138
141
147
150
155
BHEL
109
111
114
116
120
BPCL
869
880
895
906
921
BHARTIARTL
318
324
335
342
353
INFRATEL
365
370
376
381
388
BOSCH
19,433
19,623
19,894
20,085
20,356
CIPLA
492
498
507
512
521
COALINDIA
267
271
278
282
289
DRREDDY
2,963
2,981
3,011
3,029
3,059
EICHERMOT
18,135
18,435
18,942
19,242
19,749
GAIL
332
336
342
346
352
GRASIM
3,785
3,810
3,848
3,874
3,912
HCLTECH
825
834
842
851
858
HDFCBANK
1,042
1,050
1,063
1,071
1,085
HDFC
1,074
1,089
1,100
1,114
1,125
HEROMOTOCO
2,912
2,938
2,975
3,001
3,038
HINDALCO
81
83
86
88
91
HINDUNILVR
851
860
871
880
892
ICICIBANK
217
221
229
234
242
IDEA
106
108
111
112
115
INDUSINDBK
936
944
954
961
972
INFY
1,197
1,208
1,225
1,237
1,254
ITC
321
324
327
330
333
KOTAKBANK
653
661
673
681
693
LT
1,162
1,179
1,207
1,223
1,251
LUPIN
1,430
1,447
1,463
1,480
1,496
M&M
1,192
1,204
1,226
1,238
1,259
MARUTI
3,436
3,495
3,596
3,656
3,756
NTPC
123
125
128
130
134
ONGC
202
204
206
208
210
POWERGRID
137
138
140
140
142
RELIANCE
1,010
1,019
1,031
1,039
1,051
SBIN
176
180
187
192
199
SUNPHARMA
789
795
806
812
823
TCS
2,420
2,442
2,463
2,484
2,506
TATAMTRDVR
261
266
275
280
289
TATAMOTORS
358
364
375
381
392
TATAPOWER
66
66
67
68
69
TATASTEEL
302
307
313
318
324
TECHM
452
457
465
470
478
ULTRACEMCO
3,046
3,073
3,124
3,151
3,202
WIPRO
552
555
561
565
570
YESBANK
802
815
840
854
879
ZEEL
376
380
387
391
398
4
Technical & Derivatives Report
April 07, 2016
Research Team Tel: 022 - 39357800
For Technical Queries
For Derivatives Queries
DISCLAIMER
Angel Broking Private Limited (hereinafter referred to as “Angel”) is a registered Member of National Stock Exchange of India Limited,
Bombay Stock Exchange Limited and MCX Stock Exchange Limited. It is also registered as a Depository Participant with CDSL and
Portfolio Manager with SEBI. It also has registration with AMFI as a Mutual Fund Distributor. Angel Broking Private Limited is a
registered entity with SEBI for Research Analyst in terms of SEBI (Research Analyst) Regulations, 2014 vide registration number
INH000000164. Angel or its associates has not been debarred/ suspended by SEBI or any other regulatory authority for accessing
/dealing in securities Market. Angel or its associates including its relatives/analyst do not hold any financial interest/beneficial
ownership of more than 1% in the company covered by Analyst. Angel or its associates/analyst has not received any compensation /
managed or co-managed public offering of securities of the company covered by Analyst during the past twelve months. Angel/analyst
has not served as an officer, director or employee of company covered by Analyst and has not been engaged in market making activity
of the company covered by Analyst.
This document is solely for the personal information of the recipient, and must not be singularly used as the basis of any investment
decision. Nothing in this document should be construed as investment or financial advice. Each recipient of this document should
make such investigations as they deem necessary to arrive at an independent evaluation of an investment in the securities of the
companies referred to in this document (including the merits and risks involved), and should consult their own advisors to determine
the merits and risks of such an investment.
Reports based on technical and derivative analysis center on studying charts of a stock's price movement, outstanding positions and
trading volume, as opposed to focusing on a company's fundamentals and, as such, may not match with a report on a company's
fundamentals.
The information in this document has been printed on the basis of publicly available information, internal data and other reliable
sources believed to be true, but we do not represent that it is accurate or complete and it should not be relied on as such, as this
document is for general guidance only. Angel Broking Pvt. Limited or any of its affiliates/ group companies shall not be in any way
responsible for any loss or damage that may arise to any person from any inadvertent error in the information contained in this report.
Angel Broking Pvt. Limited has not independently verified all the information contained within this document. Accordingly, we cannot
testify, nor make any representation or warranty, express or implied, to the accuracy, contents or data contained within this document.
While Angel Broking Pvt. Limited endeavors to update on a reasonable basis the information discussed in this material, there may be
regulatory, compliance, or other reasons that prevent us from doing so.
This document is being supplied to you solely for your information, and its contents, information or data may not be reproduced,
redistributed or passed on, directly or indirectly.
Neither Angel Broking Pvt. Limited, nor its directors, employees or affiliates shall be liable for any loss or damage that may arise from
or in connection with the use of this information.
Note: Please refer to the important ‘Stock Holding Disclosure' report on the Angel website (Research Section). Also, please refer to the
latest update on respective stocks for the disclosure status in respect of those stocks. Angel Broking Pvt. Limited and its affiliates may
have investment positions in the stocks recommended in this report.
5