Technical & Derivatives Report
December 06, 2016
Sensex (26349) / Nifty (8129)
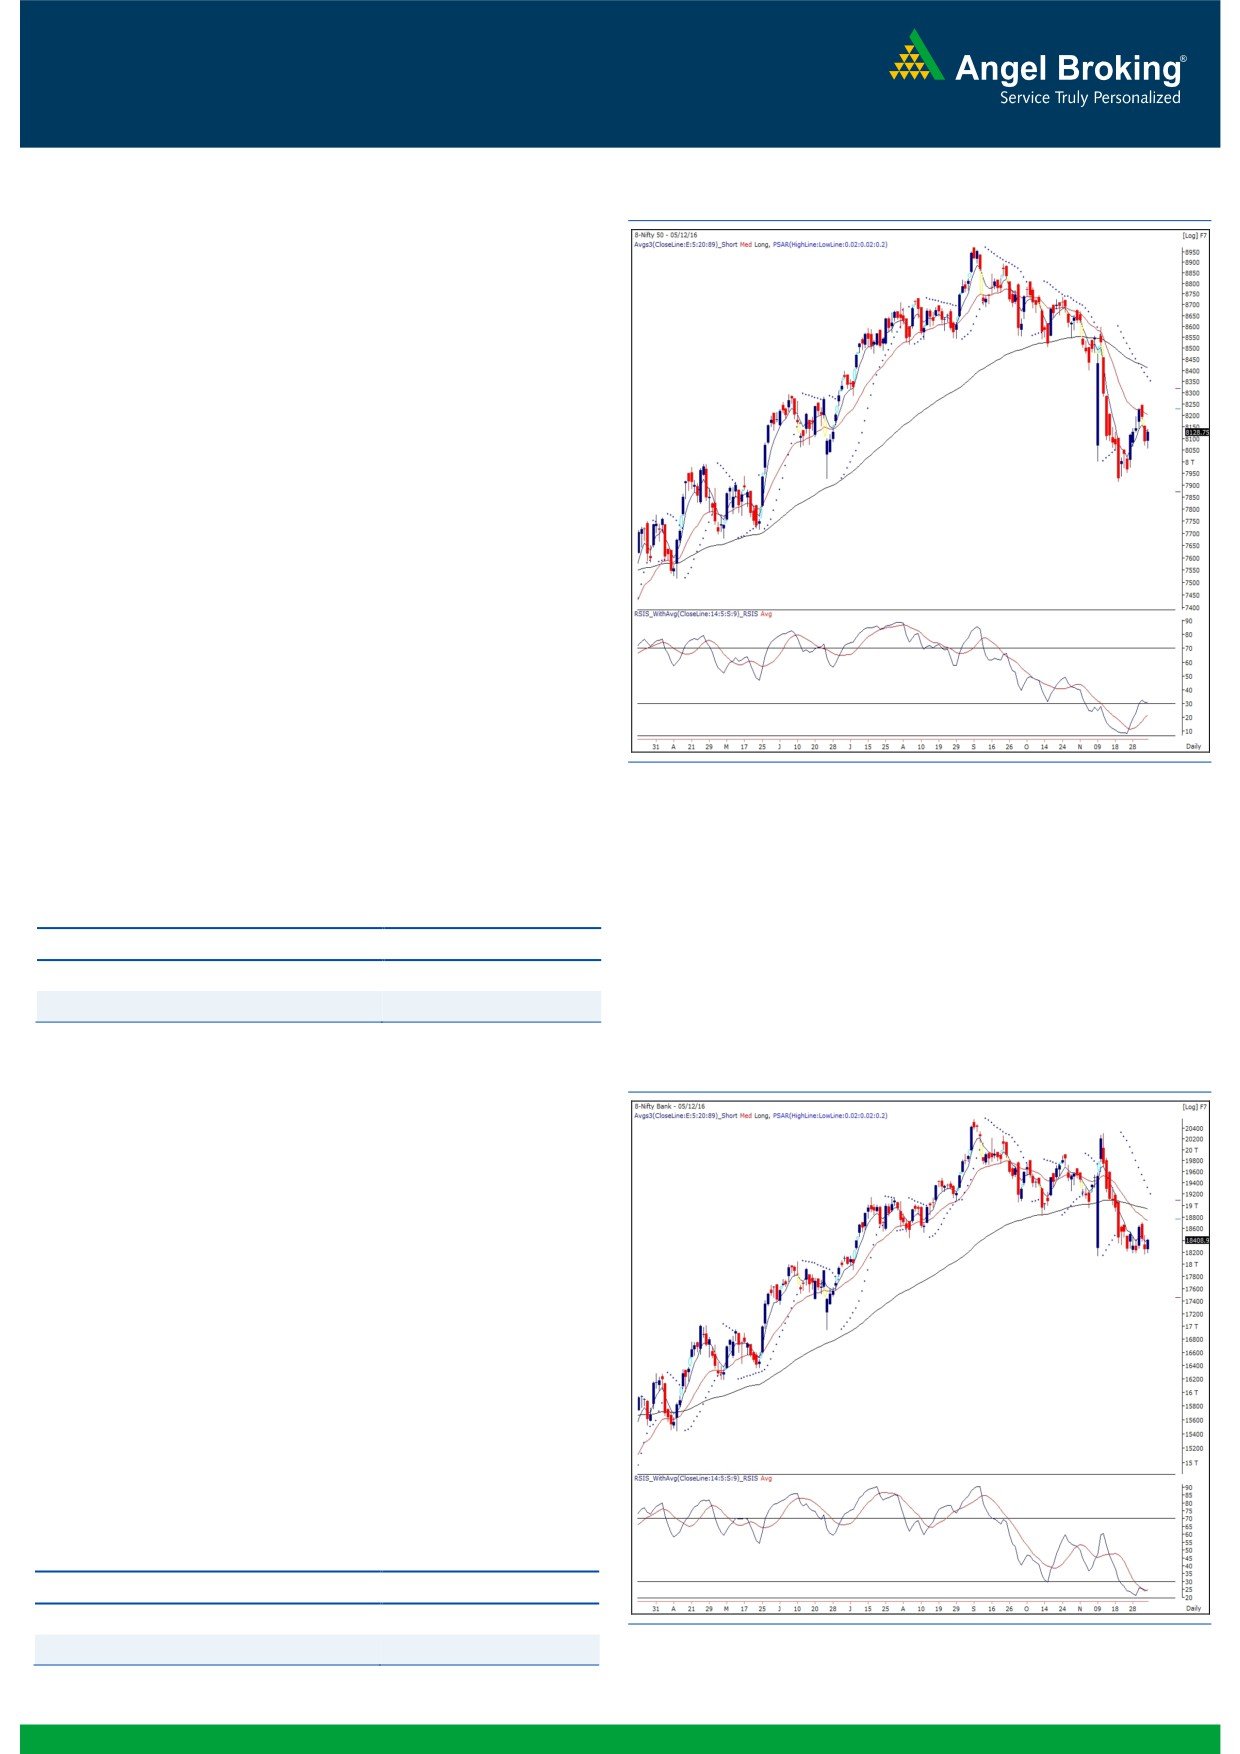
Exhibit 1: Nifty Daily Chart
Trading for the week began on flat note owing to mixed global
cues. Subsequently, we witnessed some selling pressure in the
initial hour, which dragged the index towards the 8050 mark.
However, very much on expected lines,
8055.20 (high on
November 23, 2016) played a sheet anchor role as we witnessed
a smart rally in the second half to reclaim the 8100 mark.
Now, as far as weekly chart is concerned, the ‘Dragonfly Doji’
formed around the 50% retracement (of the entire rally from
February lows) during the penultimate week, is still intact. Hence,
as long as the low of 7916.40 is not violated on Nifty, we would
like to stay on the optimistic side. In fact, yesterday’s late surge
was really encouraging and has provided conviction to our
positive stance. Although, it would be too early to take this call,
we are of the opinion that yesterday’s low of 8056.85 may form a
probable ‘Higher Low’ on daily chart. One of the key
observations to support this hypothesis is a placement of ‘RSI-
Smoothened’ which has surpassed the 30 mark after confirming a
positive crossover well inside the oversold territory. Going ahead,
we continue to expect the bounce back rally to extend towards
8320 - 8380 levels. With an intraday perspective, 8159 - 8251
would be seen as immediate hurdles; whereas on the other hand,
yesterday’s low of 8056.85 would act as a strong support for the
Nifty.
Key Levels
Support 1 - 8056
Resistance 1 - 8159
Support 2 - 7952
Resistance 2 - 8251
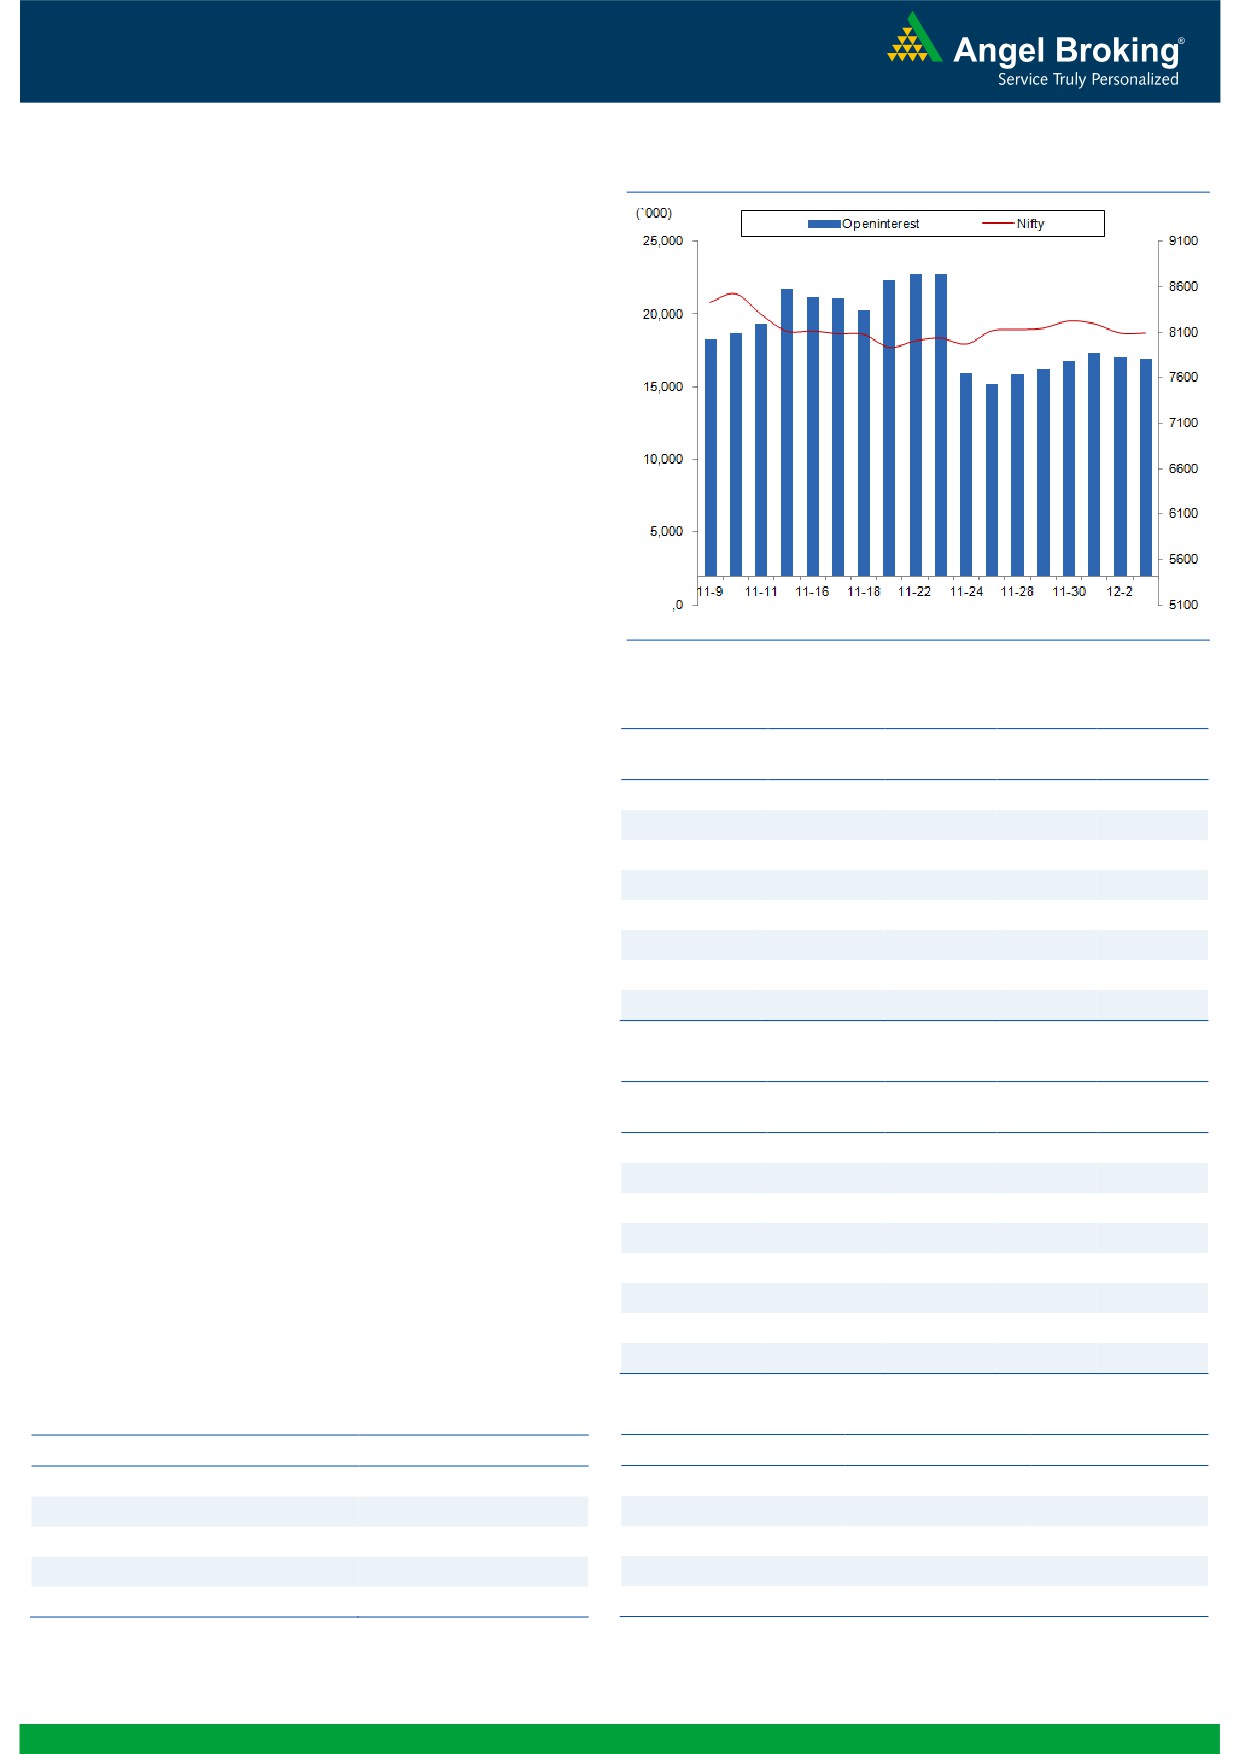
Nifty Bank Outlook - (18409)
Exhibit 2: Nifty Bank Daily Chart
The Nifty Bank index opened on a flat note and traded in a
narrow range, until the last hour of up move which led to the
index posting gains of 0.88 percent over its previous session's
close.
Since last few days, the index is trading in a narrow range and
tad above the support of 18143, which was the low registered on
9th November. We continue to maintain our optimistic view on
the index as the downside from current levels seems to be very
limited. The momentum readings on the lower time frame chart
are indicating a positive momentum which also supports our
positive view on the index. Thus, we continue to advise traders to
refrain from creating short positions and trade with positive bias.
The intraday support for the index are placed around 18284 and
18143 whereas resistances are seen around 18547 and 18713.
Key Levels
Support 1 - 18284
Resistance 1 - 18547
Support 2 - 18143
Resistance 2 - 18713
1
Technical & Derivatives Report
December 06, 2016
Comments
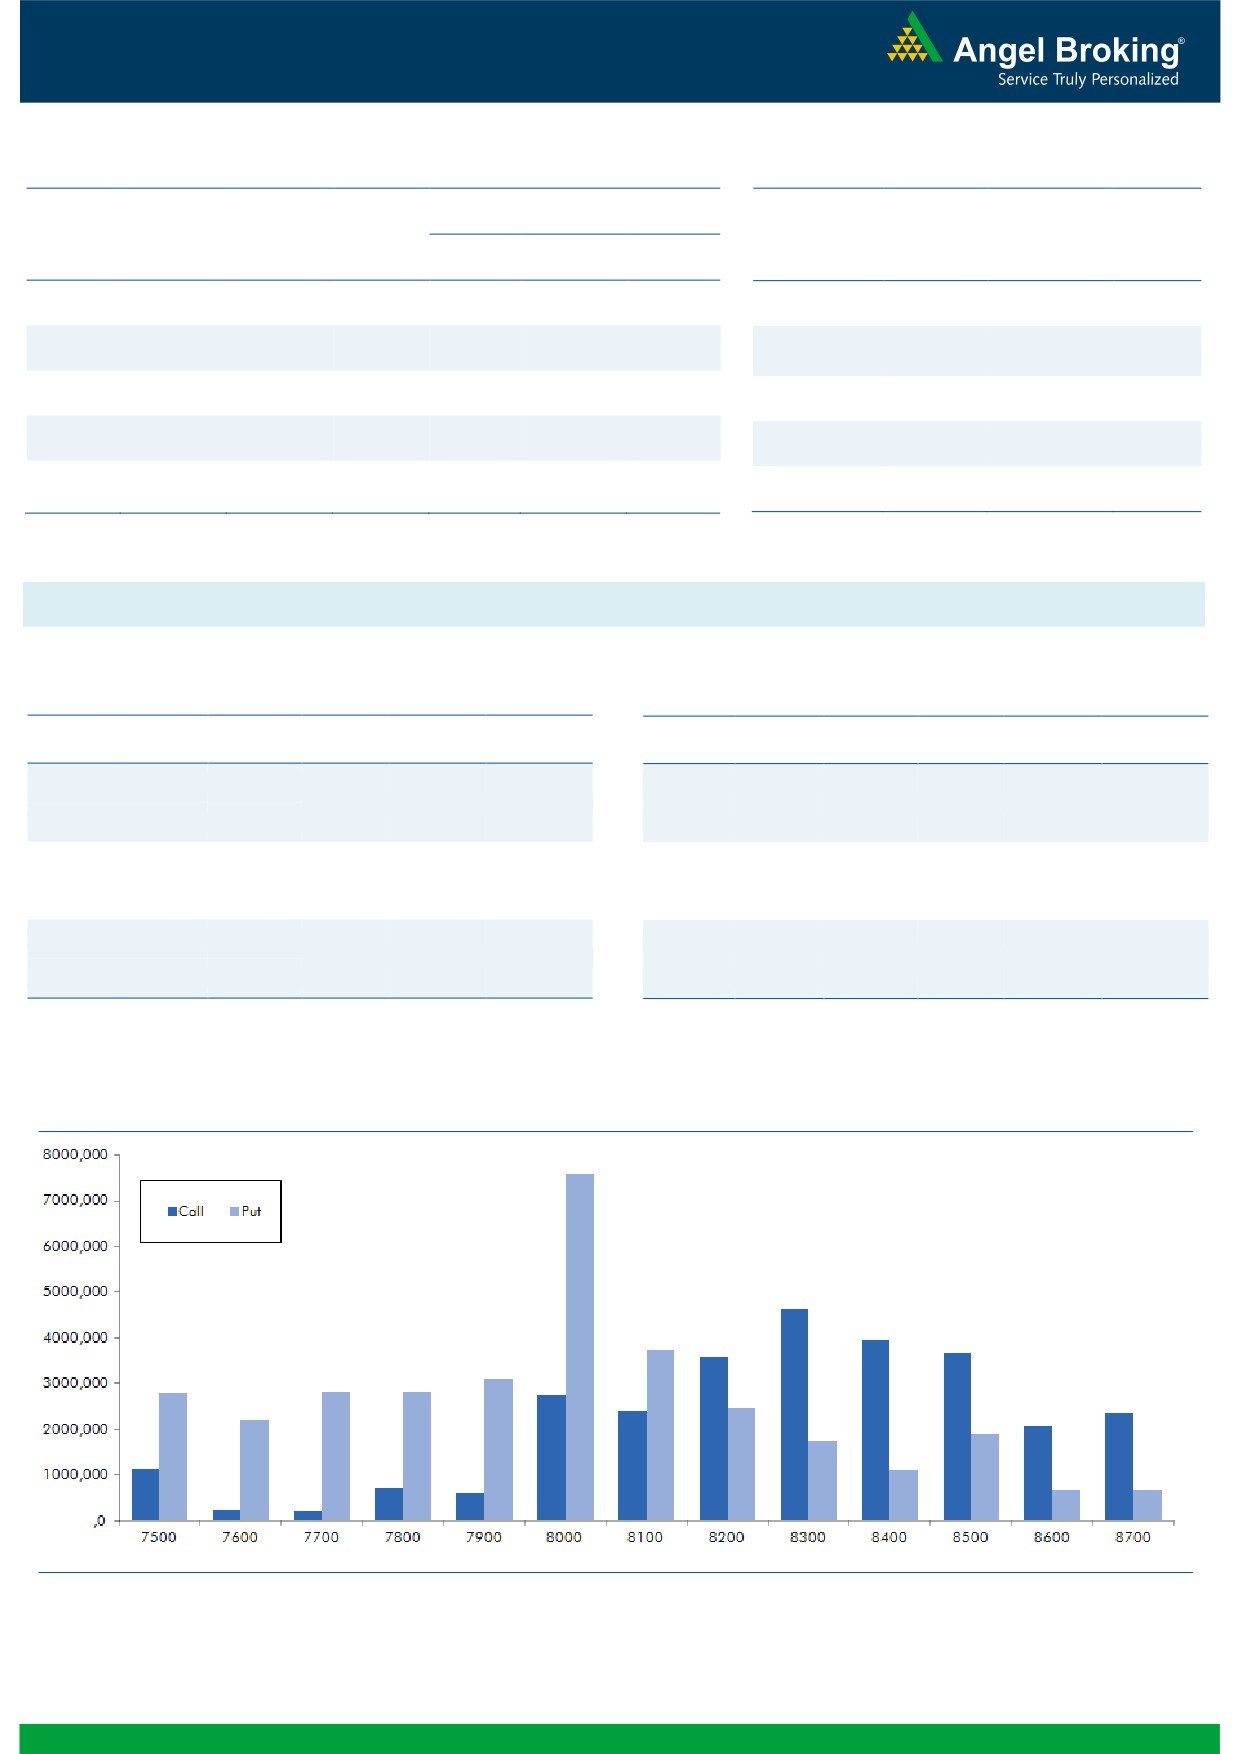
Nifty Vs OI
The Nifty futures open interest has decreased by 0.67%
BankNifty futures open interest has increased by 0.95%
as market closed at 8128.75 levels.
The Nifty December future closed with a premium of
36.15 against the premium of 22.10 points in last
trading session. The January series closed at a premium
of 66.30 points.
The Implied Volatility of at the money options has
increased from 15.62% to 15.71%. At the same time, the
PCR-OI of Nifty has remained unchanged at 1.03 levels.
The total OI of the market is Rs. 2,30,401/- cr. and the
stock futures OI is Rs. 66,972/- cr.
Few of the liquid counters where we have seen high cost
of carry are JPASSOCIAT, IFCI, GMRINFRA, DLF and
ADANIENT.
Views
OI Gainers
FIIs were net seller in both cash market segment and
OI
PRICE
SCRIP
OI
PRICE
Index Futures. They sold equities worth Rs. 318 crores.
CHG. (%)
CHG. (%)
While, in index futures, they were net sellers of Rs. 179
CROMPGREAV
11364000
68.21
68.60
-10.15
crores with marginal change in open interest, indicating
SUNTV
9370000
38.98
495.25
13.02
blend of long unwinding and some fresh short formation
INFRATEL
3410800
9.81
388.20
0.37
www.angelbroking.com
in previous trading session.
CEATLTD
1047900
9.75
1269.65
2.91
In Index options segment, FIIs were net buyers of Rs. 470
GODREJCP
477600
9.44
1476.85
1.49
crores with some rise in open interest. However, the
MRF
29490
9.22
50552.45
3.32
overall activity in both Nifty options wasn’t meaningful,
ADANIPOWER
100520000
7.76
31.30
7.19
8100 strike of both call & put option was comparatively
M&MFIN
9750000
7.62
272.45
-1.20
active and they also added some positions. Highest OI in
current series is visible in 8300 call and 8000 put option.
OI Losers
In past few days, we witnessed decent OI addition in
OI
PRICE
SCRIP
OI
PRICE
Nifty and most of them are longs. Despite market being
CHG. (%)
CHG. (%)
range bound, FII added good amount of long positions
OIL
1198500
-8.32
437.50
2.21
in both Index futures and Stock Futures. However, their
TATAELXSI
1485800
-6.57
1349.55
2.58
selling in cash segment has not yet stopped. Considering
BANKINDIA
19494000
-5.91
117.70
1.12
above data, we may see further upside in Nifty towards
TORNTPHARM
271600
-5.69
1340.40
-0.92
8300 - 8350 levels. Thus, we advise traders to trade with
AMARAJABAT
522600
-5.43
920.35
-0.64
positive bias unless we see any meaningful change in
LUPIN
4847800
-5.24
1538.00
2.80
data.
INDUSINDBK
4403400
-4.71
1085.55
2.21
NIITTECH
552000
-4.58
420.55
-1.01
Historical Volatility
Put-Call Ratio
SCRIP
HV
SCRIP
PCR-OI
PCR-VOL
SUNTV
78.28
NIFTY
1.03
0.92
CROMPGREAV
72.83
BANKNIFTY
1.09
0.79
ADANIPOWER
68.73
SBIN
0.51
0.44
BRITANNIA
34.74
INFY
0.50
0.70
M&M
39.19
RELIANCE
0.49
0.51
2
Technical & Derivatives Report
December 06, 2016
FII Statistics for December 05, 2016
Turnover on December 05, 2016
Open Interest
No. of
Turnover
Change
Detail
Buy
Sell
Net
Instrument
Value
Change
Contracts
( in Cr. )
(%)
Contracts
(in Cr.)
(%)
INDEX
INDEX
1551.69
1730.26
(178.56)
175474
11069.66
(0.19)
206506
13513.97
-27.44
FUTURES
FUTURES
INDEX
INDEX
28307.96
27837.87
470.10
976136
60562.14
0.86
2308071
153041.16
-15.55
OPTIONS
OPTIONS
STOCK
5151.13
5358.16
(207.03)
852129
51963.27
0.08
STOCK
FUTURES
394137
26130.14
-14.68
FUTURES
STOCK
STOCK
2438.41
2444.00
(5.60)
62924
4028.60
4.64
OPTIONS
207390
14301.44
-16.64
OPTIONS
TOTAL
37449.19
37370.29
78.90
2066663
127623.67
0.56
TOTAL
3116104
206986.70
-16.41
Nifty Spot = 8128.75
Lot Size = 75
Bull-Call Spreads
Bear-Put Spreads
Action
Strike
Price
Risk
Reward
BEP
Action
Strike
Price
Risk
Reward
BEP
Buy
8200
108.45
Buy
8100
105.00
43.30
56.70
8243.30
29.00
71.00
8071.00
Sell
8300
65.15
Sell
8000
76.00
Buy
8200
108.45
Buy
8100
105.00
73.15
126.85
8273.15
50.85
149.15
8049.15
Sell
8400
35.30
Sell
7900
54.15
Buy
8300
65.15
Buy
8000
76.00
29.85
70.15
8329.85
21.85
78.15
7978.15
Sell
8400
35.30
Sell
7900
54.15
Note: Above mentioned Bullish or Bearish Spreads in Nifty (December Series) are given as an information and not as a recommendation.
Nifty Put-Call Analysis
3
Technical & Derivatives Report
December 06, 2016
Daily Pivot Levels for Nifty Constituents
Scrips
S2
S1
PIVOT
R1
R2
ACC
1,307
1,323
1,335
1,352
1,364
ADANIPORTS
259
264
269
274
278
AMBUJACEM
202
206
209
213
216
ASIANPAINT
878
908
925
954
971
AUROPHARMA
708
716
723
732
739
AXISBANK
452
456
460
465
469
BAJAJ-AUTO
2,655
2,698
2,732
2,774
2,808
BANKBARODA
160
161
162
164
165
BHEL
124
126
128
130
132
BPCL
588
596
606
615
625
BHARTIARTL
313
320
324
331
335
INFRATEL
374
380
388
394
402
BOSCH
20,030
20,441
20,710
21,121
21,390
CIPLA
565
569
575
579
585
COALINDIA
300
302
305
308
310
DRREDDY
3,082
3,125
3,161
3,204
3,240
EICHERMOT
22,257
22,503
22,846
23,092
23,435
GAIL
421
424
429
433
438
GRASIM
840
856
868
884
896
HCLTECH
773
783
792
803
812
HDFCBANK
1,168
1,182
1,191
1,205
1,213
HDFC
1,156
1,186
1,213
1,243
1,270
HEROMOTOCO
3,100
3,162
3,213
3,276
3,327
HINDALCO
165
170
173
177
180
HINDUNILVR
823
834
843
854
862
ICICIBANK
256
259
260
262
264
IDEA
70
71
73
74
75
INDUSINDBK
1,039
1,061
1,075
1,098
1,111
INFY
952
957
963
968
973
ITC
225
229
231
235
237
KOTAKBANK
719
725
728
733
737
LT
1,341
1,349
1,357
1,364
1,372
LUPIN
1,479
1,507
1,524
1,552
1,568
M&M
1,137
1,159
1,172
1,195
1,208
MARUTI
4,994
5,099
5,159
5,264
5,324
NTPC
159
161
162
164
165
ONGC
286
291
294
298
301
POWERGRID
179
182
184
187
189
RELIANCE
980
987
993
1,000
1,007
SBIN
251
254
256
259
261
SUNPHARMA
702
707
716
722
731
TCS
2,130
2,158
2,198
2,226
2,266
TATAMTRDVR
280
285
288
294
297
TATAMOTORS
424
431
436
444
449
TATAPOWER
72
72
73
74
75
TATASTEEL
401
407
411
417
421
TECHM
449
456
466
473
483
ULTRACEMCO
3,508
3,545
3,589
3,626
3,670
WIPRO
450
453
457
460
464
YESBANK
1,138
1,161
1,174
1,197
1,210
ZEEL
424
433
440
449
456
4
Technical & Derivatives Report
December 06, 2016
Research Team Tel: 022 - 39357800
For Technical Queries
For Derivatives Queries
DISCLAIMER
Angel Broking Private Limited (hereinafter referred to as “Angel”) is a registered Member of National Stock Exchange of India Limited,
Bombay Stock Exchange Limited and Metropolitan Stock Exchange Limited. It is also registered as a Depository Participant with CDSL
and Portfolio Manager with SEBI. It also has registration with AMFI as a Mutual Fund Distributor. Angel Broking Private Limited is a
registered entity with SEBI for Research Analyst in terms of SEBI (Research Analyst) Regulations, 2014 vide registration number
INH000000164. Angel or its associates has not been debarred/ suspended by SEBI or any other regulatory authority for accessing
/dealing in securities Market. Angel or its associates/analyst has not received any compensation / managed or co-managed public
offering of securities of the company covered by Analyst during the past twelve months.
This document is solely for the personal information of the recipient, and must not be singularly used as the basis of any investment
decision. Nothing in this document should be construed as investment or financial advice. Each recipient of this document should
make such investigations as they deem necessary to arrive at an independent evaluation of an investment in the securities of the
companies referred to in this document (including the merits and risks involved), and should consult their own advisors to determine
the merits and risks of such an investment.
Reports based on technical and derivative analysis center on studying charts of a stock's price movement, outstanding positions and
trading volume, as opposed to focusing on a company's fundamentals and, as such, may not match with a report on a company's
fundamentals. Investors are advised to refer the Fundamental and Technical Research Reports available on our website to evaluate the
contrary view, if any.
The information in this document has been printed on the basis of publicly available information, internal data and other reliable
sources believed to be true, but we do not represent that it is accurate or complete and it should not be relied on as such, as this
document is for general guidance only. Angel Broking Pvt. Limited or any of its affiliates/ group companies shall not be in any way
responsible for any loss or damage that may arise to any person from any inadvertent error in the information contained in this report.
Angel Broking Pvt. Limited has not independently verified all the information contained within this document. Accordingly, we cannot
testify, nor make any representation or warranty, express or implied, to the accuracy, contents or data contained within this document.
While Angel Broking Pvt. Limited endeavors to update on a reasonable basis the information discussed in this material, there may be
regulatory, compliance, or other reasons that prevent us from doing so.
This document is being supplied to you solely for your information, and its contents, information or data may not be reproduced,
redistributed or passed on, directly or indirectly.
Neither Angel Broking Pvt. Limited, nor its directors, employees or affiliates shall be liable for any loss or damage that may arise from
or in connection with the use of this information.
5