Technical & Derivatives Report
November 06, 2015
Sensex (26304) / Nifty (7955)
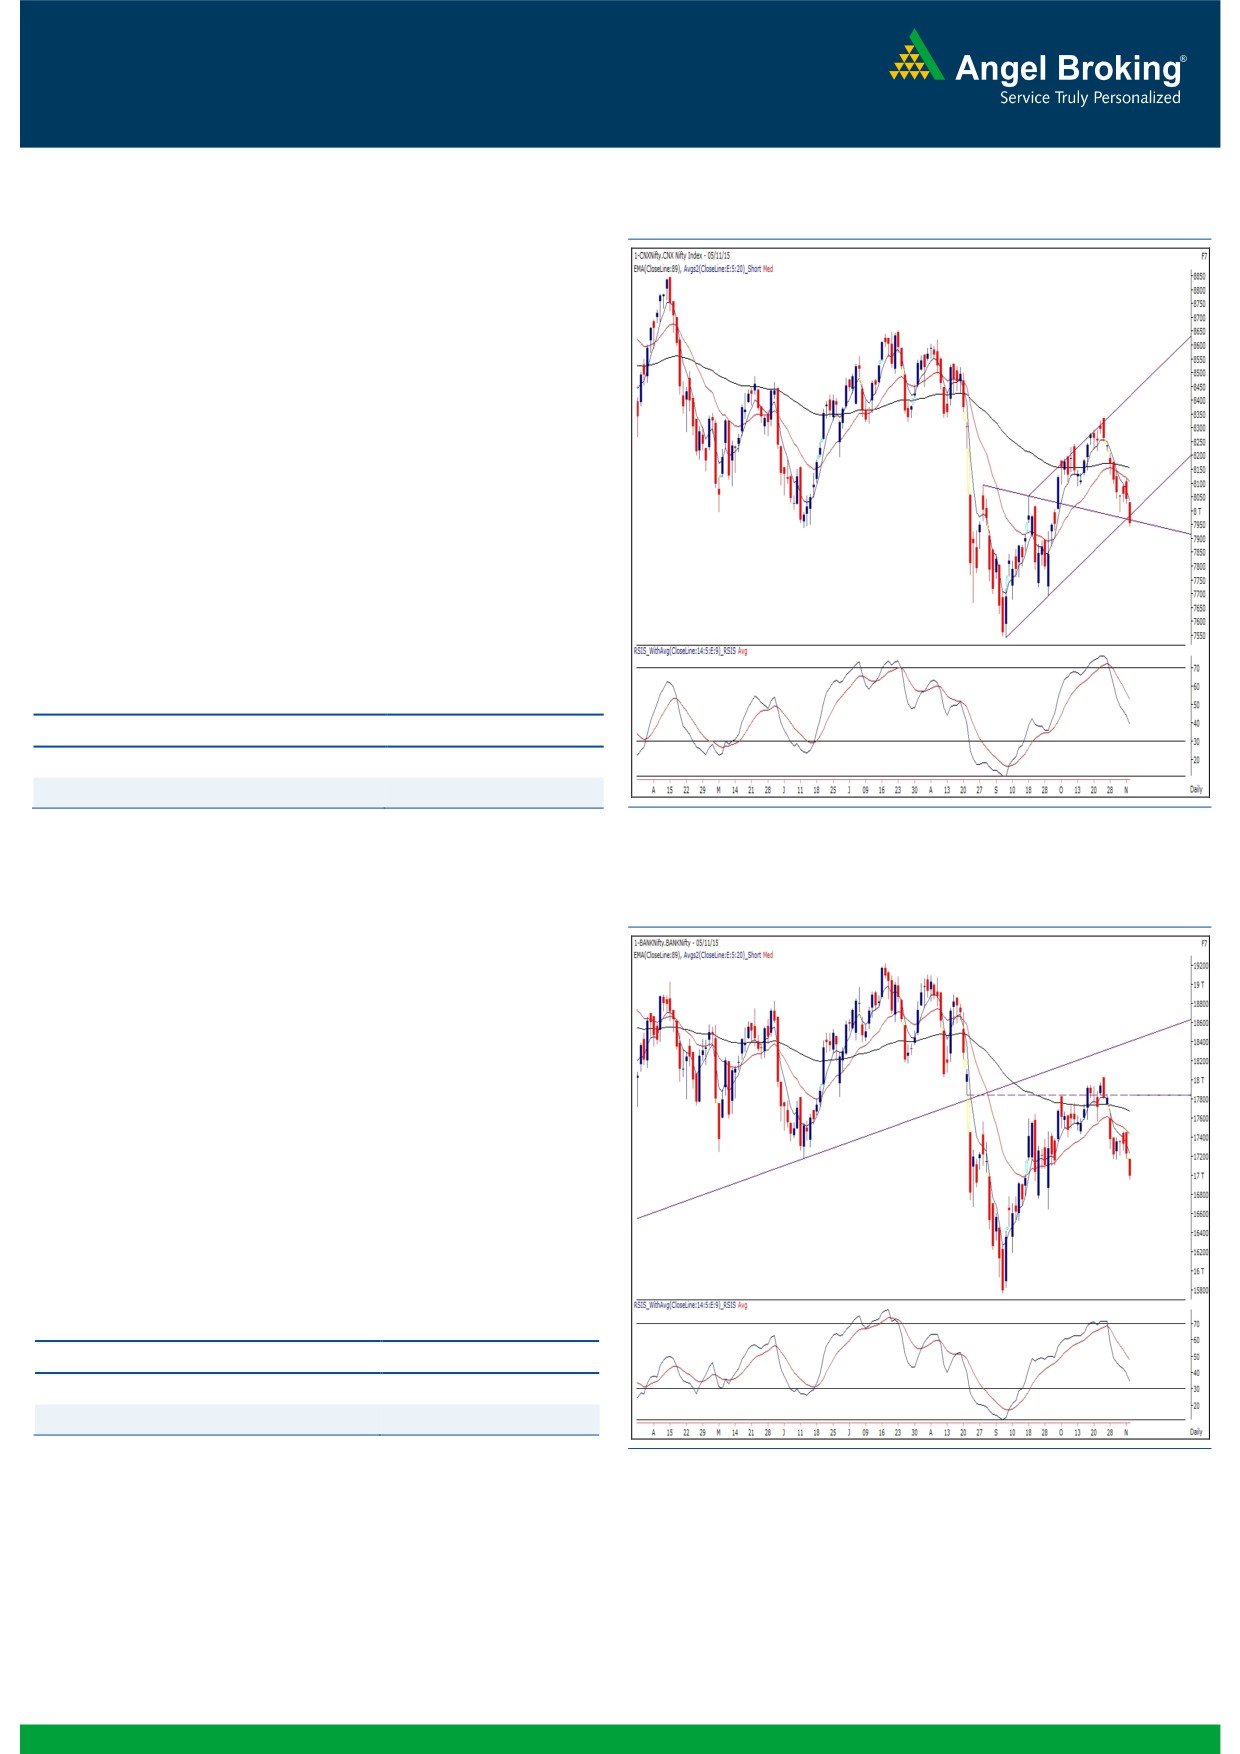
Exhibit 1: Nifty Daily Chart
We had a soft opening yesterday mainly on the back of mixed
global cues. Subsequently, the benchmark index kept on falling
throughout the session to close with a percent cut.
Quite surprisingly to most of the traders (including us), we
witnessed extremely weak session and as a result, the Nifty
eventually slipped below the 8000 mark for the first time in last
four weeks. Cosidering yesterday's session, it seems that the bulls
are opting to stay out of the market just ahead of Bihar election
result. Technically speaking, the Nifty has now broken down
marginally from its lower end of the Channel. Going forward, if
the index manages to stay below 7920 then we may witness an
immediate correction towards 7850 - 7800 levels. On the higher
side, 8020 - 8060 are likely to act as a strong resistance. It's
advisable to stay light on positions as the election outcome on
Monday may bring in higher volatility in our market.
Key Levels
Support 1 - 7920
Resistance 1 - 8020
Support 2 - 7850
Resistance 2 - 8060
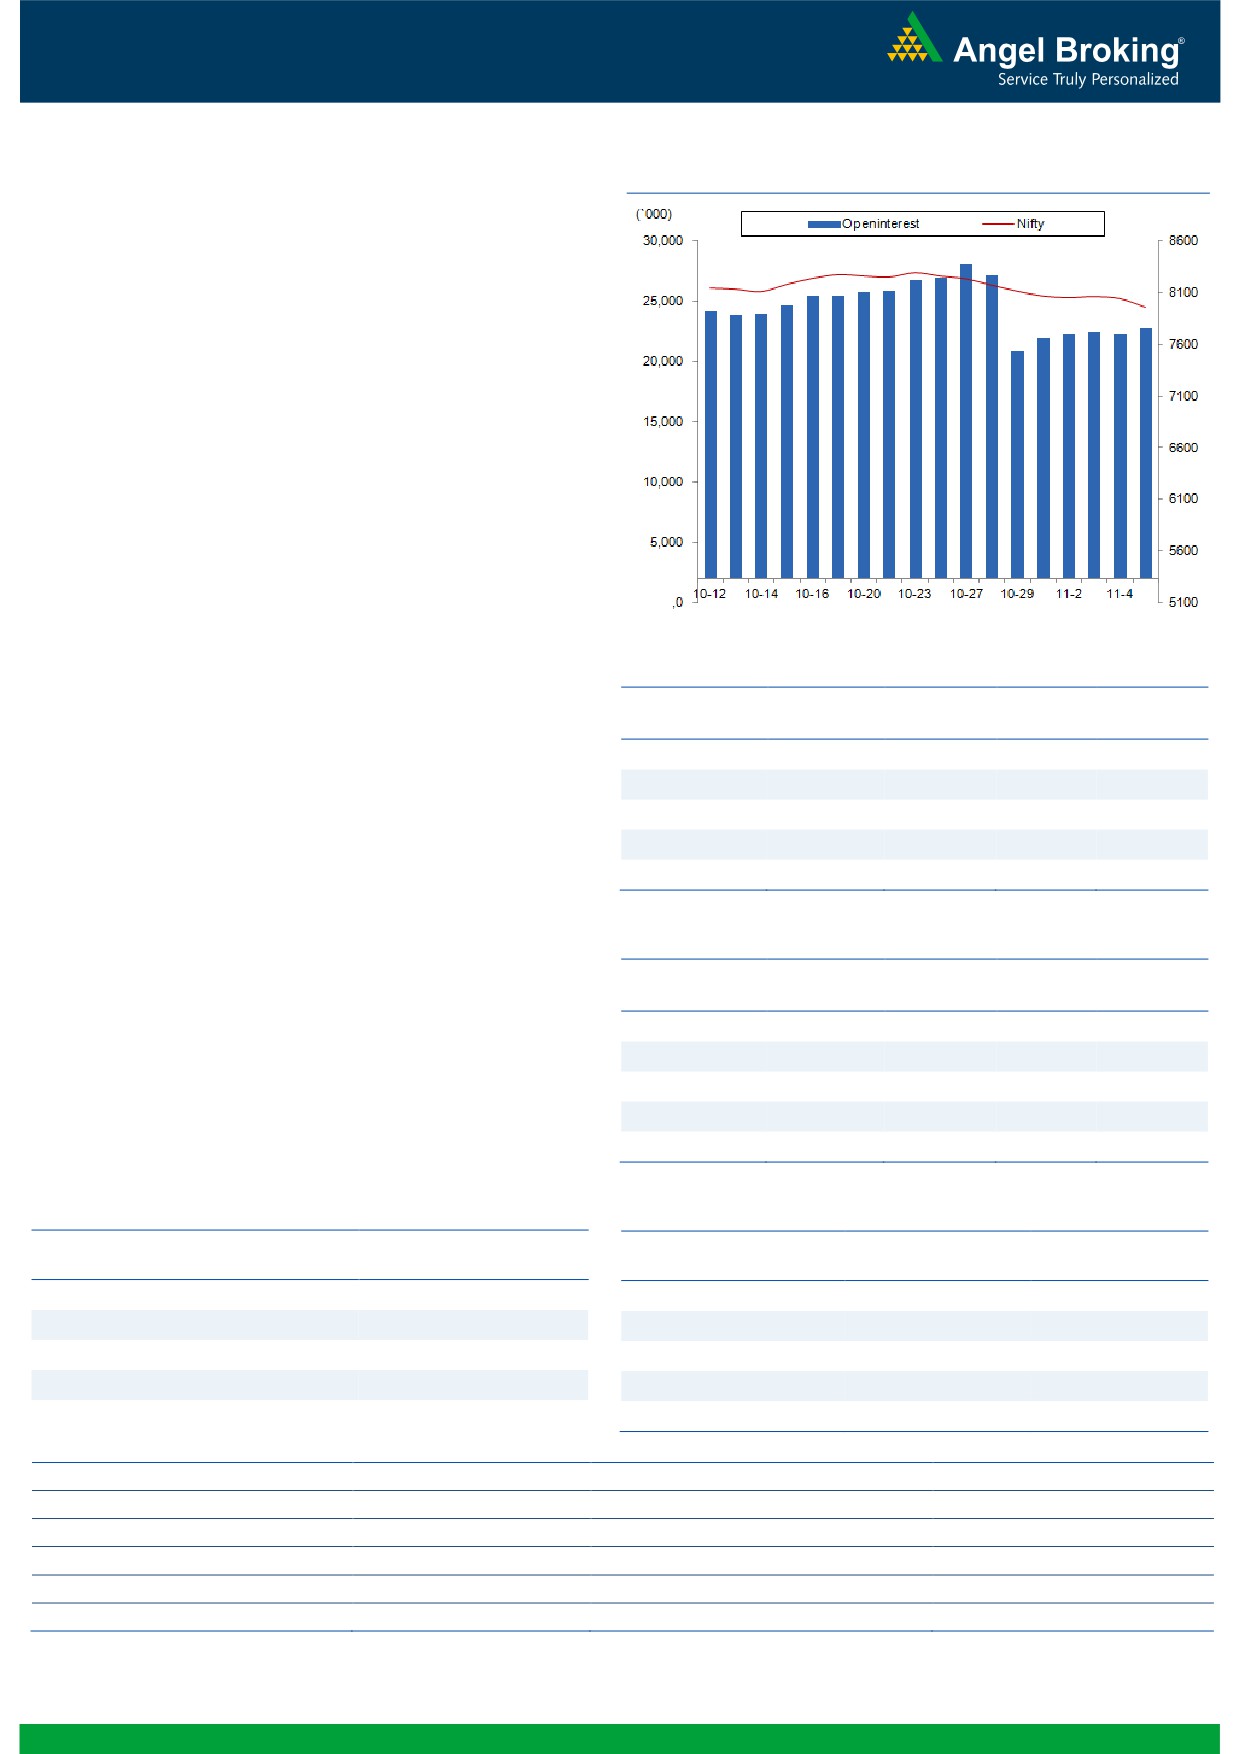
Exhibit 2: Bank Nifty Daily Chart
Bank Nifty Outlook - (16995)
In yesterday's trading session, the Bank Nifty index witnessed
another gap down opening and continued its negative
momentum throughout the session before ending the day with
losses of 1.31%. As we have mentioned in our previous report,
the breach of crucial support levels of 17170 with gaps indicates
resumption of the corrective down move. The index is now
approaching its next support level of 16888 which is
50%
retracement of the previous upmove. The index may give a minor
pullback move from the mentioned support; but, the broader
trend will continue to be negative unless the prices show any
reversal signs. The immediate support for BankNifty index are
placed around 16888 and 16620 whereas resistances are seen
around 17200 and 17475.
Key Levels
Support 1 - 16888
Resistance 1 - 17200
Support 2 - 16620
Resistance 2 - 17475
1
Technical & Derivatives Report
November 06, 2015
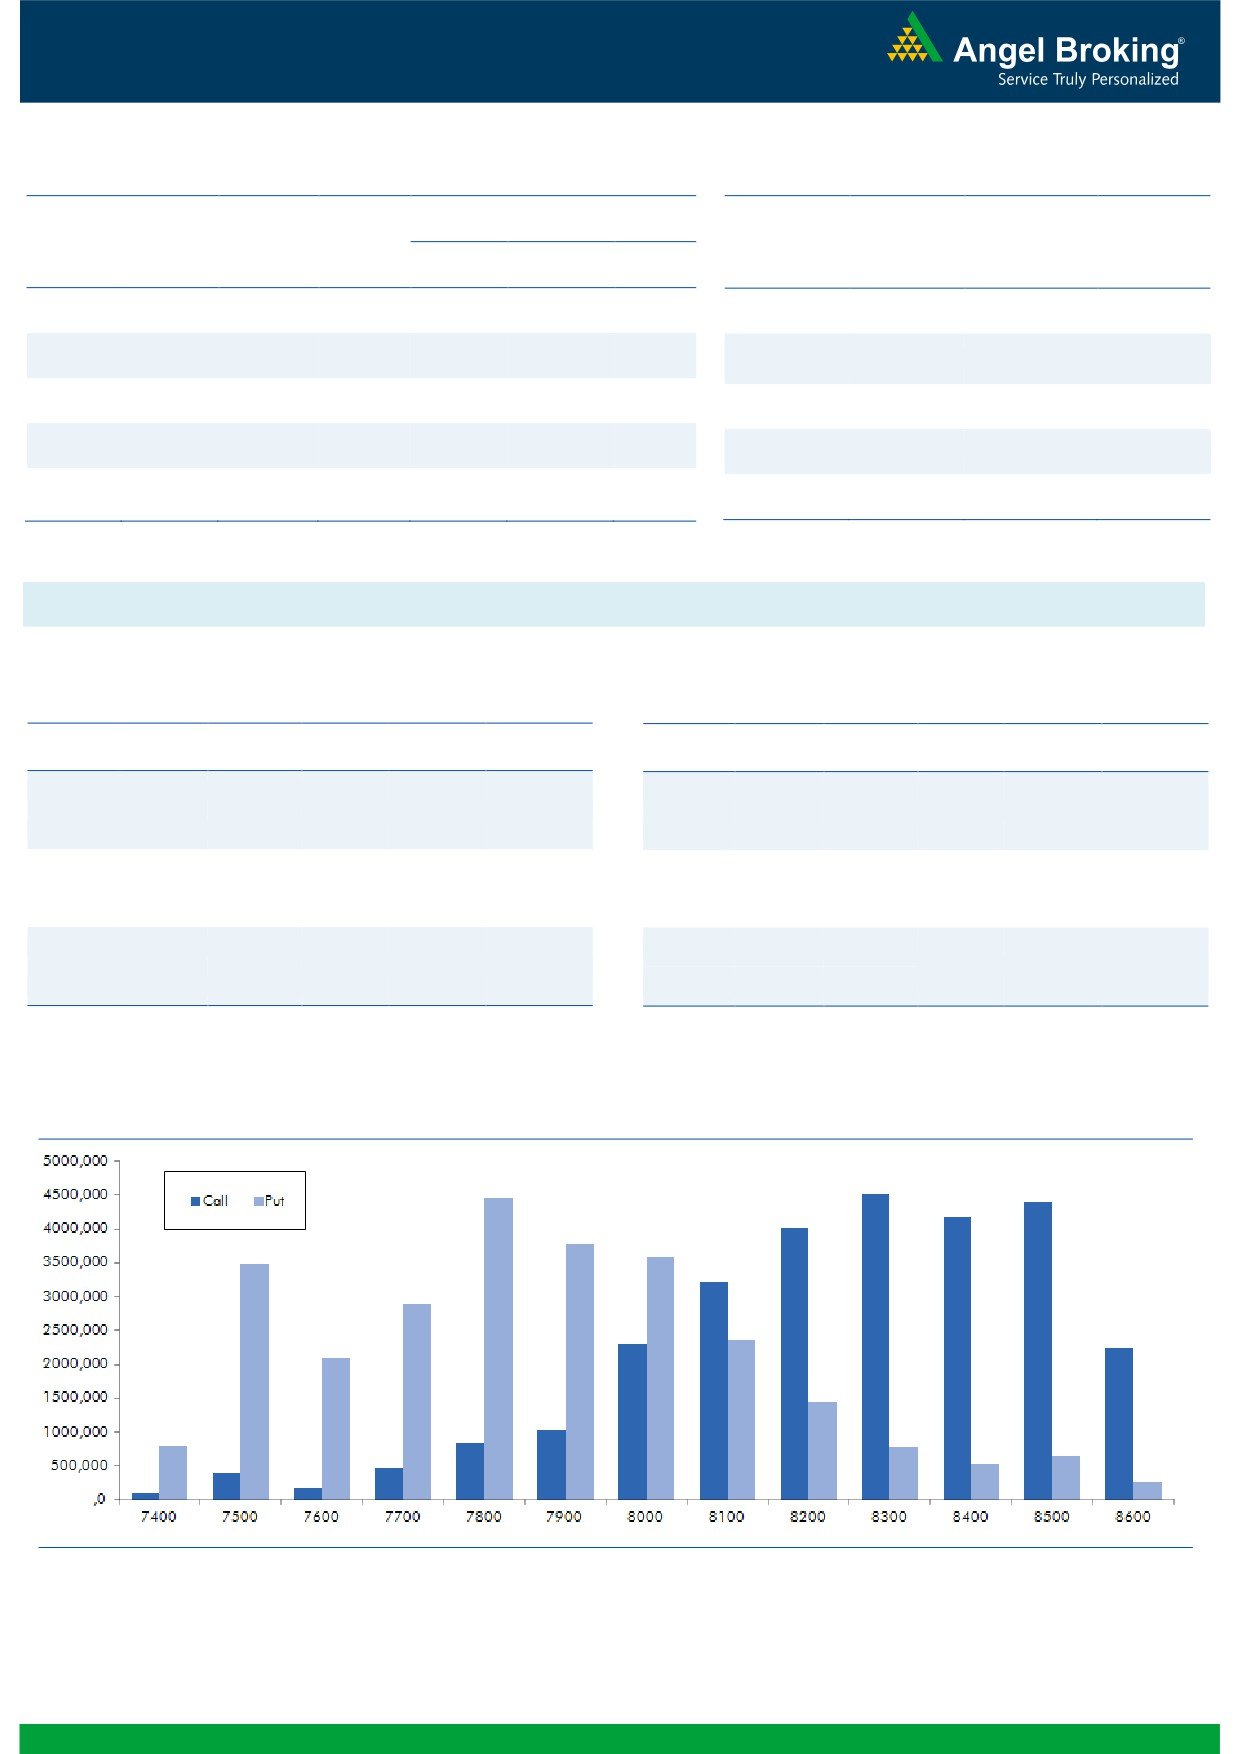
Nifty Vs OI
Comments
The Nifty futures open interest has increased by 2.28%
BankNifty futures open interest has increased by 7.04%
as market closed at 7955.45 levels.
The Nifty November future closed at a premium of 33.95
points against a premium of
29.85 points. The
December series closed at a premium of 78.45 points.
The Implied Volatility of at the money options has
increased from 17.86% to 18.93%.
The total OI of the market is Rs. 2,08,520/- cr. and the
stock futures OI is Rs. 60,098/- cr.
Few of the liquid counters where we have seen high cost
of carry are GMRINFRA, JPASSOCIAT, IDFC, SKSMICRO
and ITC.
OI Gainers
Views
OI
PRICE
SCRIP
OI
PRICE
CHG. (%)
CHG. (%)
Yesterday, FIIs were net seller in both equity cash and
JUBLFOOD
2642700
21.04
1380.30
-5.36
index future segment. They sold worth Rs. 992 crores in
MARICO
2119000
14.55
403.85
1.13
equity cash. While, they were net seller to the tune of Rs
SUNPHARMA
11872800
12.81
820.95
-4.28
858 crores in index future with marginal rise in OI,
ARVIND
4263600
10.14
280.25
4.63
suggesting short built-up in last trading session.
TATASTEEL
33684000
9.12
226.00
-4.24
In Index Options front, they sold of worth Rs. 2182 crores
with decent amount of rise in OI. In call options 800,
8200 and 8300 strikes added decent buildup. While in
OI Losers
put options 7500 strike added some OI. Maximum OI is
OI
PRICE
SCRIP
OI
PRICE
seen in 8300 call and 7800 put options. Seeing the
CHG. (%)
CHG. (%)
APOLLOHOSP
573600
-10.65
1346.65
-1.57
overall data, we believe Nifty may trade in a range of
CADILAHC
1977000
-8.79
430.10
-0.44
7800-7850 on the lower side and 8300-8350 on the
DRREDDY
1176600
-7.79
4265.90
-1.50
higher side. One should trade accordingly.
JSWENERGY
6702000
-7.61
89.90
-4.36
RELINFRA
5405400
-5.91
398.80
-0.59
Historical Volatility
Put-Call Ratio
SCRIP
HV
SCRIP
PCR-OI
PCR-VOL
JUBLFOOD
40.59
NIFTY
0.86
0.80
DISHTV
42.82
BANKNIFTY
0.70
0.69
ASHOKLEY
45.05
LT
0.44
0.35
SUNPHARMA
36.82
AXISBANK
0.36
0.49
LICHSGFIN
41.71
SBIN
0.48
0.47
Strategy Date
Symbol
Strategy
Status
November 02, 2015
RELIANCE
Short Strangle
Active
2
Technical & Derivatives Report
November 06, 2015
FII Statistics for 05-November 2015
Turnover on 05-November 2015
Open Interest
No. of
Turnover
Change
Detail
Buy
Sell
Net
Instrument
Value
Change
Contracts
( in Cr. )
(%)
Contracts
(in Cr.)
(%)
INDEX
INDEX
1683.68
2542.04
(858.37)
286164
16778.94
1.28
253342
14325.93
19.20
FUTURES
FUTURES
INDEX
INDEX
15210.39
17392.28
(2181.89)
1060268
62646.79
4.46
2057760
123159.61
37.99
OPTIONS
OPTIONS
STOCK
2501.86
3574.33
(1072.47)
928943
45965.13
0.03
STOCK
FUTURES
445912
22784.90
-0.90
FUTURES
STOCK
STOCK
1683.71
1718.37
(34.66)
53633
2645.76
10.72
OPTIONS
236461
12587.43
10.45
OPTIONS
TOTAL
21079.63
25227.02
(4147.39)
2329008
128036.62
2.39
TOTAL
2993475
172857.88
27.42
Nifty Spot = 7955.45
Lot Size = 25
Bull-Call Spreads
Bear-Put Spreads
Action
Strike
Price
Risk
Reward
BEP
Action
Strike
Price
Risk
Reward
BEP
Buy
8000
134.25
Buy
7900
105.35
46.45
53.55
8046.45
30.50
69.50
7869.50
Sell
8100
87.80
Sell
7800
74.85
Buy
8000
134.25
Buy
7900
105.35
80.75
119.25
8080.75
53.65
146.35
7846.35
Sell
8200
53.50
Sell
7700
51.70
Buy
8100
87.80
Buy
7800
74.85
34.30
65.70
8134.30
23.15
76.85
7776.85
Sell
8200
53.50
Sell
7700
51.70
Note: Above mentioned Bullish or Bearish Spreads in Nifty (Nov. Series) are given as an information and not as a recommendation.
Nifty Put-Call Analysis
3
Technical & Derivatives Report
November 06, 2015
Daily Pivot Levels for Nifty 50 Stocks
Scrips
S2
S1
PIVOT
R1
R2
ACC
1,365
1,377
1,393
1,405
1,422
ADANIPORTS
277
280
287
290
297
AMBUJACEM
205
207
208
210
211
ASIANPAINT
790
798
805
813
819
AXISBANK
456
460
466
470
476
BAJAJ-AUTO
2,366
2,390
2,429
2,453
2,492
BANKBARODA
156
157
160
162
165
BHARTIARTL
327
332
339
344
351
BHEL
187
191
196
200
205
BOSCHLTD
19,527
19,710
20,023
20,206
20,520
BPCL
875
882
888
896
902
CAIRN
147
149
151
153
156
CIPLA
643
650
663
671
683
COALINDIA
324
330
335
342
346
DRREDDY
4,180
4,215
4,272
4,306
4,363
GAIL
286
290
297
302
309
GRASIM
3,645
3,671
3,689
3,714
3,732
HCLTECH
869
873
878
883
888
HDFC
1,186
1,196
1,210
1,220
1,235
HDFCBANK
1,064
1,072
1,077
1,085
1,091
HEROMOTOCO
2,582
2,610
2,634
2,663
2,687
HINDALCO
80
80
81
82
83
HINDUNILVR
790
796
804
810
818
ICICIBANK
266
268
271
273
276
IDEA
136
138
139
141
142
INDUSINDBK
896
902
907
913
919
INFY
1,104
1,113
1,129
1,139
1,155
ITC
331
334
337
340
342
KOTAKBANK
633
642
657
666
681
LT
1,355
1,362
1,371
1,378
1,386
LUPIN
1,820
1,829
1,843
1,852
1,866
M&M
1,234
1,247
1,258
1,271
1,283
MARUTI
4,467
4,497
4,526
4,556
4,585
NTPC
134
135
136
137
138
ONGC
247
249
251
253
256
PNB
128
129
130
131
133
POWERGRID
129
130
131
132
133
RELIANCE
922
929
940
947
958
SBIN
229
232
235
238
241
SUNPHARMA
90
92
96
97
101
TATAMOTORS
784
800
825
841
866
TATAPOWER
395
399
406
411
417
TATASTEEL
67
68
69
69
70
TCS
217
221
229
233
240
TECHM
2,444
2,463
2,499
2,518
2,554
ULTRACEMCO
524
530
538
544
552
VEDL
2,776
2,805
2,856
2,885
2,935
WIPRO
566
569
572
574
577
YESBANK
746
754
767
775
789
ZEEL
397
402
408
413
419
4
Technical & Derivatives Report
November 06, 2015
Research Team Tel: 022 - 39357800
For Technical Queries
For Derivatives Queries
DISCLAIMER
Angel Broking Private Limited (hereinafter referred to as “Angel”) is a registered Member of National Stock Exchange of India Limited,
Bombay Stock Exchange Limited and MCX Stock Exchange Limited. It is also registered as a Depository Participant with CDSL and
Portfolio Manager with SEBI. It also has registration with AMFI as a Mutual Fund Distributor. Angel Broking Private Limited is a
registered entity with SEBI for Research Analyst in terms of SEBI (Research Analyst) Regulations, 2014 vide registration number
INH000000164. Angel or its associates has not been debarred/ suspended by SEBI or any other regulatory authority for accessing
/dealing in securities Market. Angel or its associates including its relatives/analyst do not hold any financial interest/beneficial
ownership of more than 1% in the company covered by Analyst. Angel or its associates/analyst has not received any compensation /
managed or co-managed public offering of securities of the company covered by Analyst during the past twelve months. Angel/analyst
has not served as an officer, director or employee of company covered by Analyst and has not been engaged in market making activity
of the company covered by Analyst.
This document is solely for the personal information of the recipient, and must not be singularly used as the basis of any investment
decision. Nothing in this document should be construed as investment or financial advice. Each recipient of this document should
make such investigations as they deem necessary to arrive at an independent evaluation of an investment in the securities of the
companies referred to in this document (including the merits and risks involved), and should consult their own advisors to determine
the merits and risks of such an investment.
Reports based on technical and derivative analysis center on studying charts of a stock's price movement, outstanding positions and
trading volume, as opposed to focusing on a company's fundamentals and, as such, may not match with a report on a company's
fundamentals.
The information in this document has been printed on the basis of publicly available information, internal data and other reliable
sources believed to be true, but we do not represent that it is accurate or complete and it should not be relied on as such, as this
document is for general guidance only. Angel Broking Pvt. Limited or any of its affiliates/ group companies shall not be in any way
responsible for any loss or damage that may arise to any person from any inadvertent error in the information contained in this report.
Angel Broking Pvt. Limited has not independently verified all the information contained within this document. Accordingly, we cannot
testify, nor make any representation or warranty, express or implied, to the accuracy, contents or data contained within this document.
While Angel Broking Pvt. Limited endeavors to update on a reasonable basis the information discussed in this material, there may be
regulatory, compliance, or other reasons that prevent us from doing so.
This document is being supplied to you solely for your information, and its contents, information or data may not be reproduced,
redistributed or passed on, directly or indirectly.
Neither Angel Broking Pvt. Limited, nor its directors, employees or affiliates shall be liable for any loss or damage that may arise from
or in connection with the use of this information.
Note: Please refer to the important ‘Stock Holding Disclosure' report on the Angel website (Research Section). Also, please refer to the
latest update on respective stocks for the disclosure status in respect of those stocks. Angel Broking Pvt. Limited and its affiliates may
have investment positions in the stocks recommended in this report.
5