Technical & Derivatives Report
October 06, 2016
Sensex (28221) / Nifty (8744)
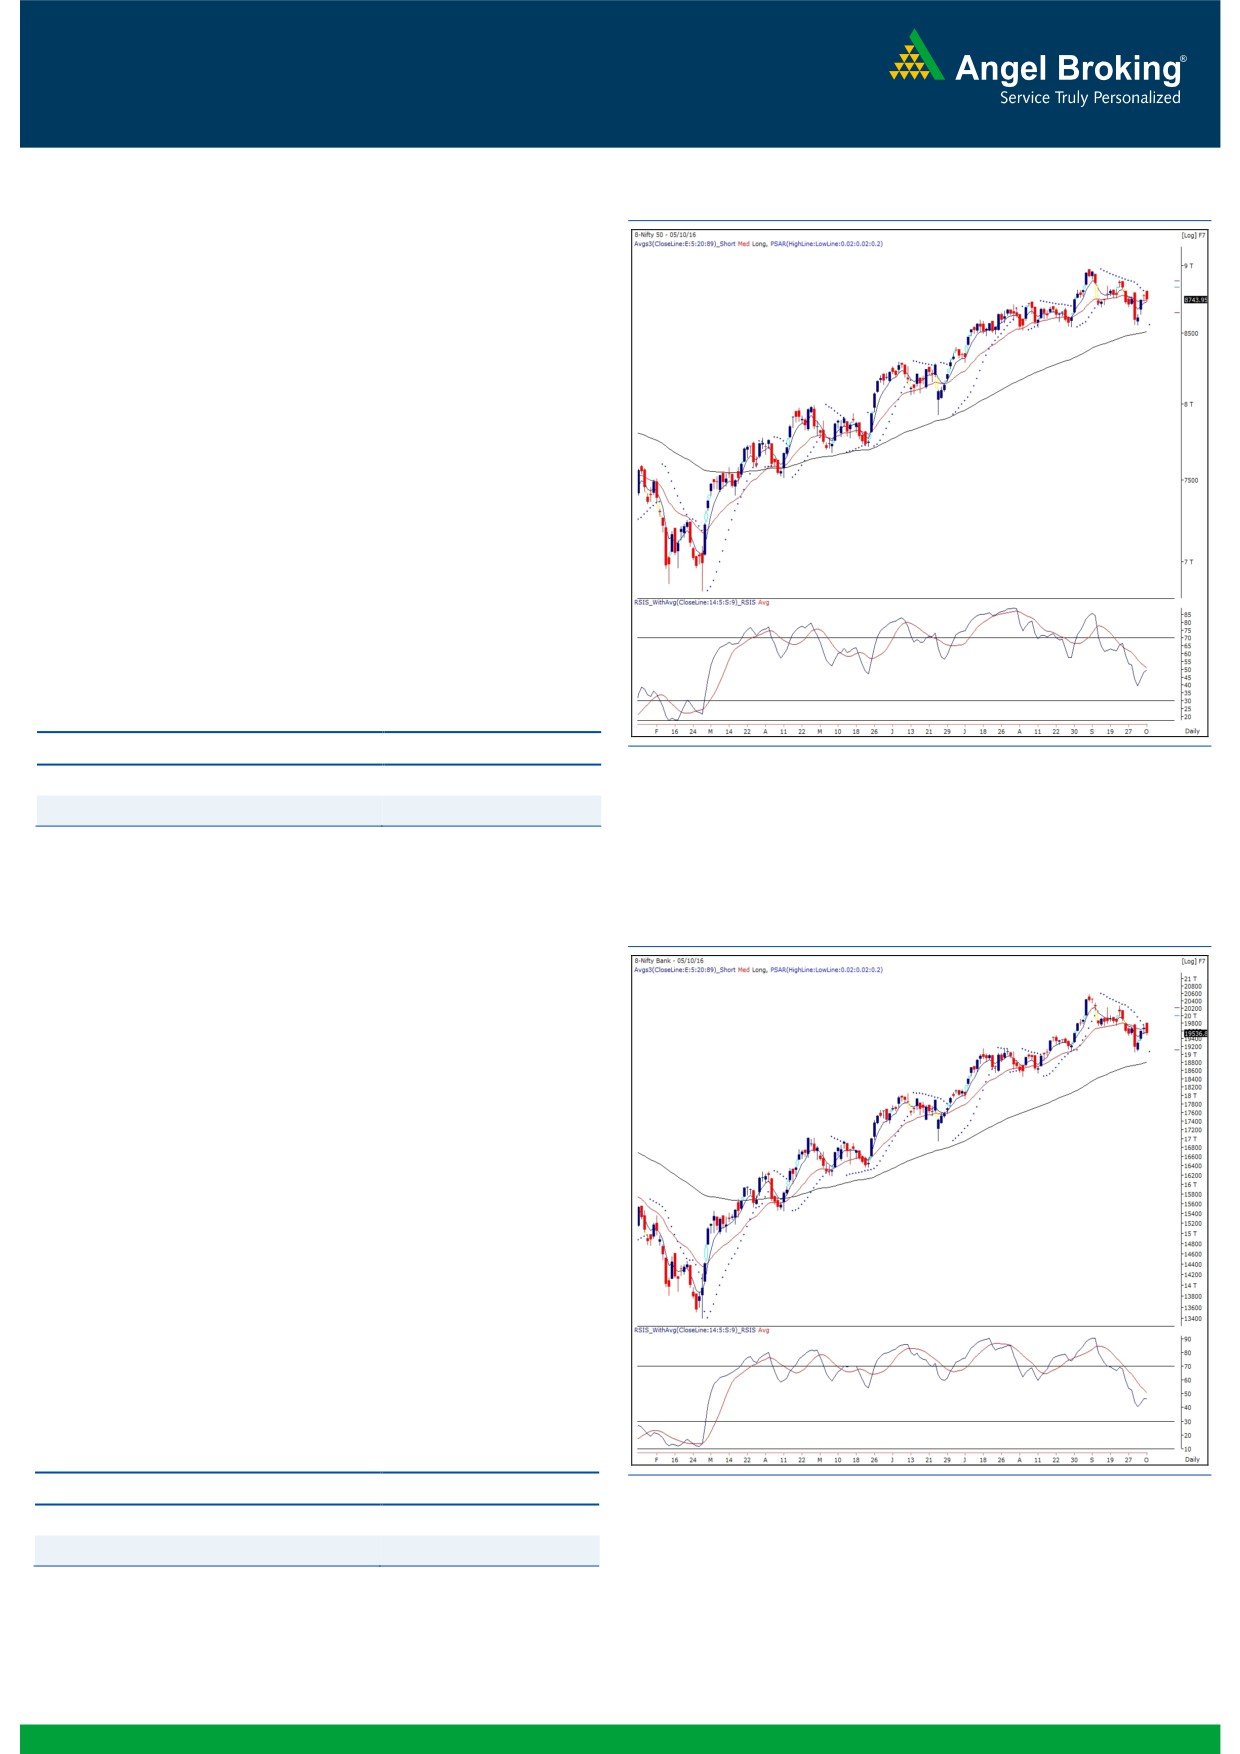
Exhibit 1: Nifty Daily Chart
Our markets opened higher yesterday mainly on the back of a
positive mood seen across the Asian bourses. However, this lead
was very short lived as the index started drifting lower
immediately after posting an ‘Open High’. The Nifty consolidated
for major part of the day to end the session tad below the 8750
mark with marginal losses.
If we refer to our previous report, we had mentioned about the
strong hurdle placed around 8780 - 8820 for the index. As
expected, the Nifty corrected after opening inside this resistance
zone. Going ahead, we maintain our cautious stance on the
market and expect the index to remain under pressure as long as
a stiff hurdle of 8780 - 8820 in not violated convincingly. For the
coming session, 8730 would be seen as immediate support. A
move below this may drag the index lower to test 8690 - 8635
levels.
Key Levels
Support 1 - 8690
Resistance 1 - 8780
Support 2 - 8635
Resistance 2 - 8820
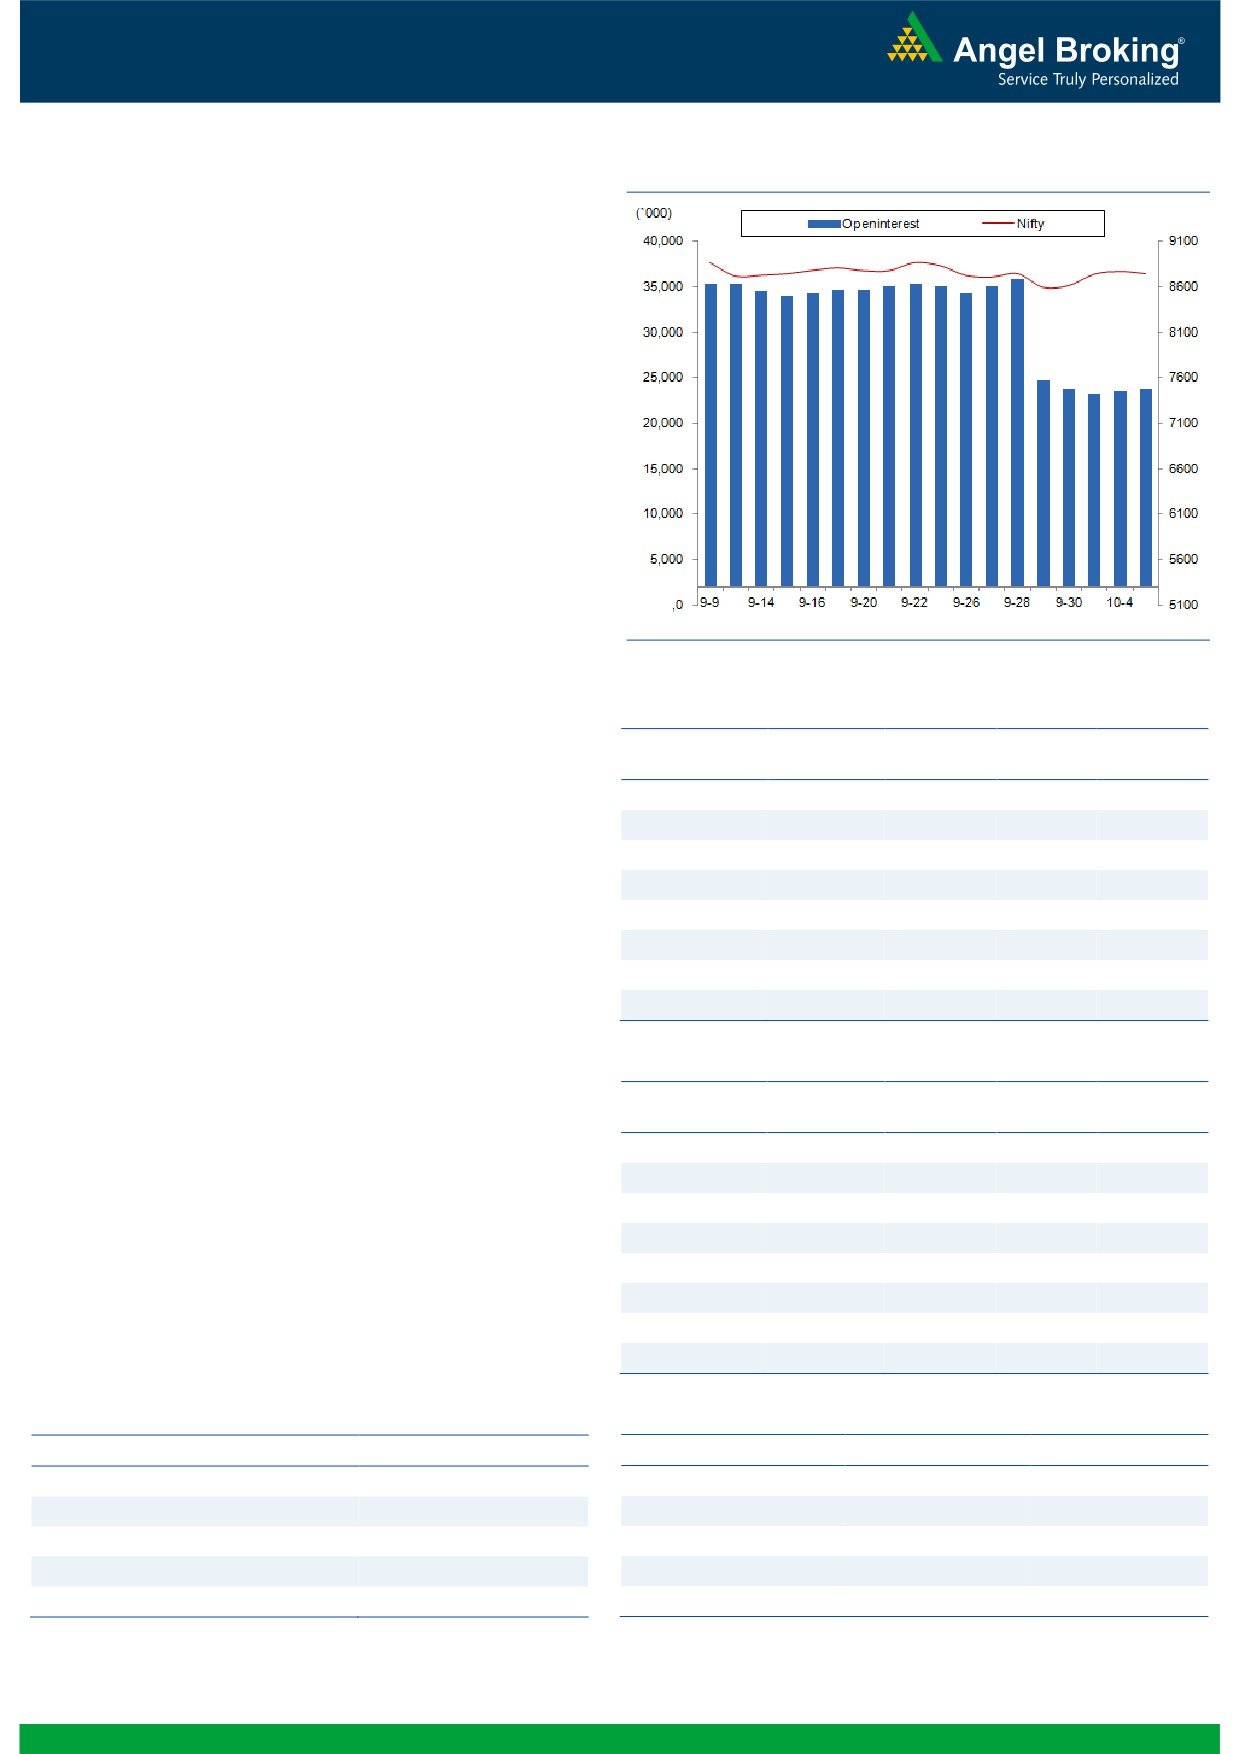
Exhibit 2: Nifty Bank Daily Chart
Nifty Bank Outlook - (19537)
In yesterday's trading session, the Nifty Bank index opened
marginally higher, but remained under pressure throughout the
session and ended the day with loss of 0.69 percent over its
previous sessions close.
On daily charts, the Nifty Bank index has recently formed a 'Lower
Top Lower Bottom' structure. During the corrective move, the
index breached the support with a gap down opening on 26th
September. As per the gap theory, this gap which is placed in
range of 19794-19861 is a resistance and unless the index
crosses the mentioned range, it is likely to remain in corrective
mode. In yesterday's session, the index has resisted in the gap
area and thus, we continue to maintain our cautious stance on
the index. The intraday support for the index are placed around
19418 and 19320 whereas resistance is seen in range of 19794-
19861.
Key Levels
Support 1 - 19418
Resistance 1 - 19794
Support 2 - 19320
Resistance 2 - 19861
1
Technical & Derivatives Report
October 06, 2016
Comments
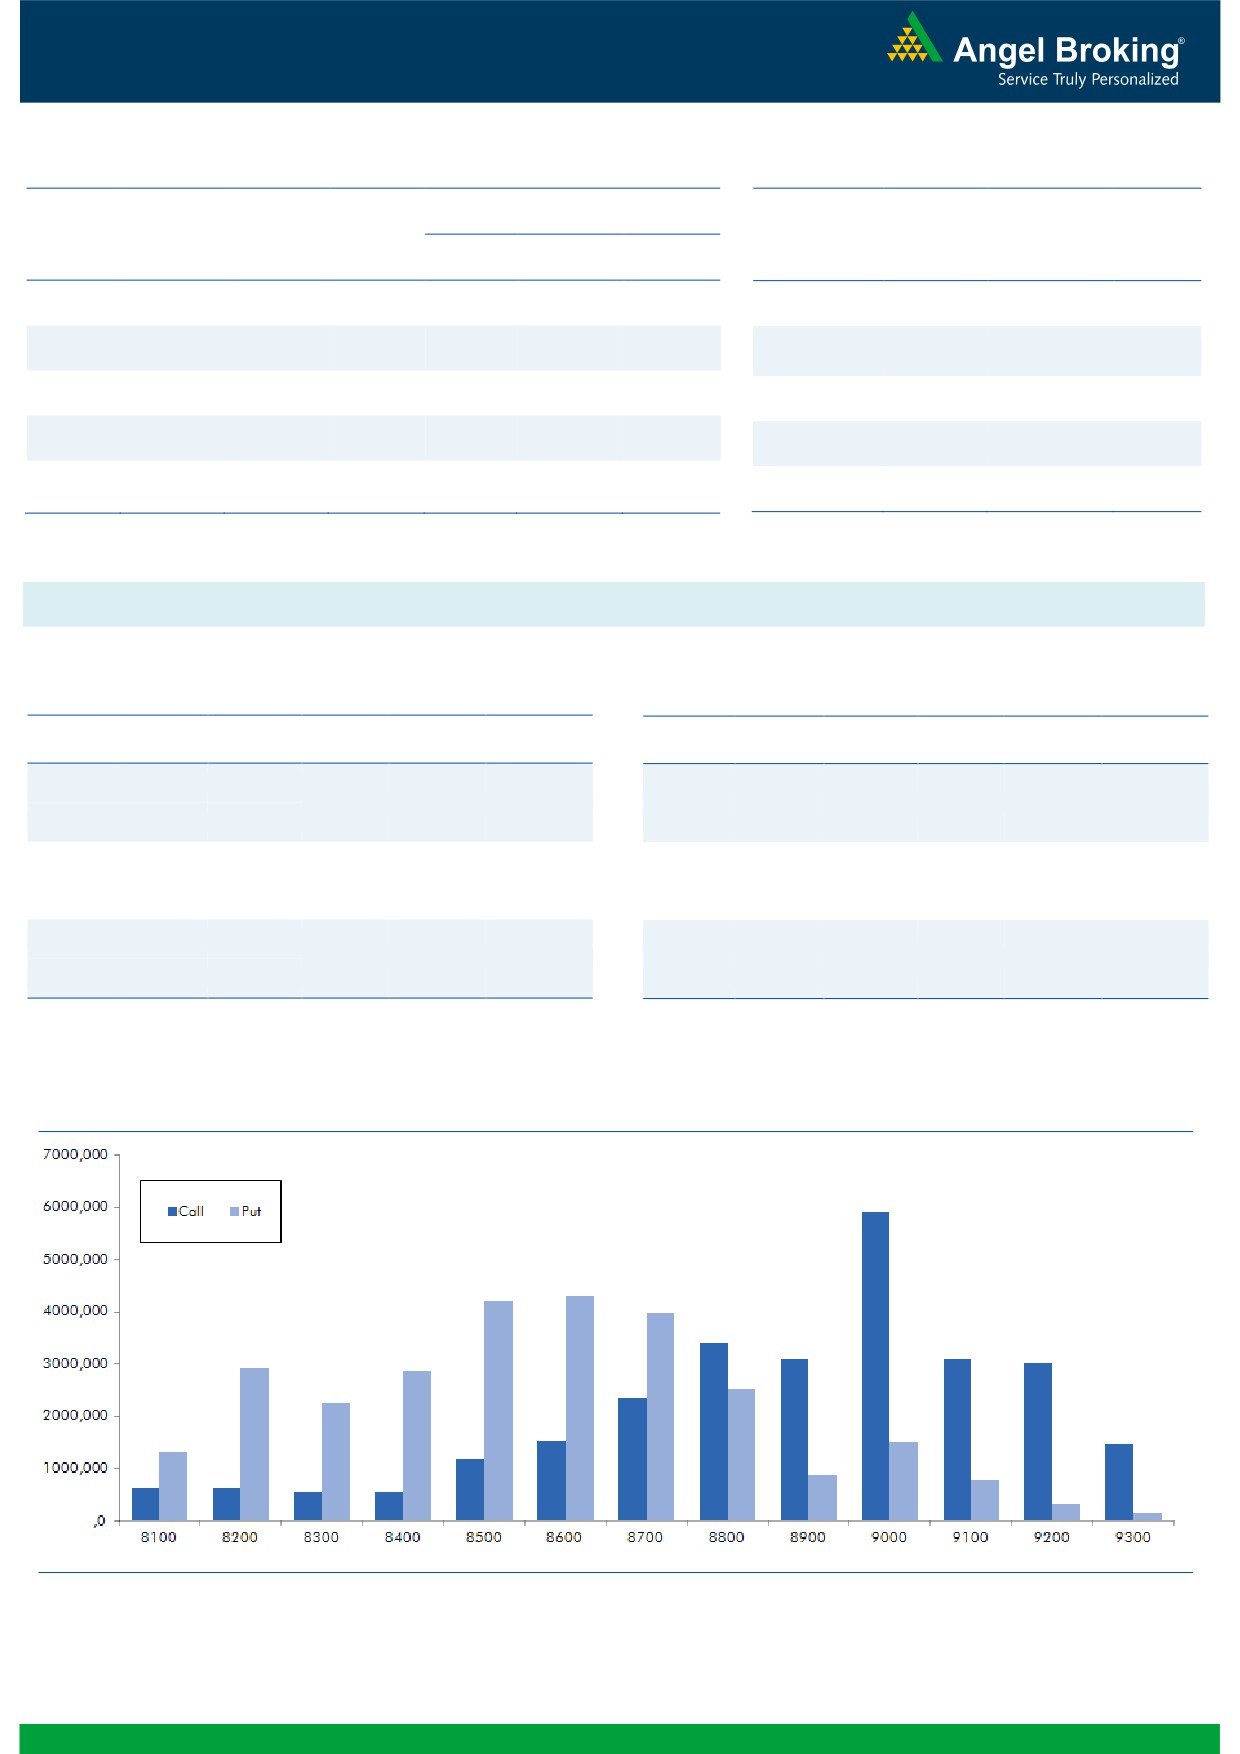
Nifty Vs OI
The Nifty futures open interest has increased by 0.77%
BankNifty futures open interest has increased by 1.63%
as market closed at 8743.95 levels.
The Nifty October future closed with a premium of 31.40
against the premium of 30.55 points in last trading
session. The November series closed at a premium of
71.00 points.
The Implied Volatility of at the money options has
decreased from 13.41% to 12.92%. At the same time,
the PCR-OI of Nifty remained unchanged at 0.97.
The total OI of the market is Rs. 2,59,814/- cr. and the
stock futures OI is Rs. 78,720/- cr.
Few of the liquid counters where we have seen high cost
of carry are JPASSOCIAT, NHPC, GMRINFRA, IFCI and
TATACHEM.
Views
OI Gainers
FIIs were net buyers in both cash market segment and
OI
PRICE
index futures. They bought equities of worth Rs. 243
SCRIP
OI
PRICE
CHG. (%)
CHG. (%)
crores. While, in index future, they were net buyers of
MCLEODRUSS
6423000
37.24
179.80
4.38
Rs. 154 crores with rise in OI, indicating some long
IDFCBANK
14288000
31.13
76.75
-3.03
formation in last trading session.
TORNTPOWER
702000
28.57
184.20
1.88
On Index Options front, FIIs bought towthegtuneoofng.com
CESC
1667600
18.07
617.80
-2.90
Rs. 701 crores with rise in OI. We hardly saw any
SRF
505500
17.83
1937.20
3.24
meaningful open interest in both call and put options.
AJANTPHARM
454800
13.81
2014.95
-1.73
However,
8800 call and
8700 put options were
AMBUJACEM
11292500
12.95
257.70
0.06
comparatively active and they also added some fresh
DLF
43935000
11.27
159.60
3.33
positions. Highest OI in October series is placed at 9000
call and 8600 put option.
From last two trading sessions, FIIs are net buyers in
OI Losers
Index Futures but the quantum of buying figure is
OI
PRICE
SCRIP
OI
PRICE
CHG. (%)
CHG. (%)
marginal. Most of the heavy weigth counters that showed
NMDC
14622000
-7.48
112.05
0.67
strength didn’t add longs. In fact, we are witnessing fresh
IGL
1860100
-6.21
831.95
-1.30
short formation in INFY, TCS and AXISBANK. Thus, we
UNIONBANK
11252000
-5.41
152.90
0.26
would suggest traders to avoid getting carried away with
HAVELLS
2806000
-4.43
449.35
-0.90
this move. 8800-8850 is an immediate wall of resistance
LT
7842500
-3.93
1460.80
0.22
for Nifty, traders can buy 8700 put options to trade in
IBREALEST
41300000
-3.86
94.60
0.69
Index for near term.
ICICIBANK
70412500
-3.83
256.20
-1.08
PETRONET
5301000
-3.60
371.75
0.51
Historical Volatility
Put-Call Ratio
SCRIP
HV
SCRIP
PCR-OI
PCR-VOL
TATAGLOBAL
55.25
NIFTY
0.97
0.99
KSCL
58.57
BANKNIFTY
0.77
0.82
MCLEODRUSS
45.90
RELIANCE
0.54
0.55
CESC
31.79
ICICIBANK
0.49
0.49
TATACOMM
64.87
AXISBANK
0.33
0.47
2
Technical & Derivatives Report
October 06, 2016
FII Statistics for 05, October 2016
Turnover on 05, October 2016
Open Interest
No. of
Turnover
Change
Detail
Buy
Sell
Net
Instrument
Value
Change
Contracts
( in Cr. )
(%)
Contracts
(in Cr.)
(%)
INDEX
INDEX
1409.17
1255.44
153.73
274321
18441.41
2.51
199224
14191.01
-16.91
FUTURES
FUTURES
INDEX
INDEX
36930.48
36229.83
700.64
925814
61770.23
1.60
4062681
302758.73
25.22
OPTIONS
OPTIONS
STOCK
6666.76
7055.69
(388.94)
855032
57405.13
0.53
STOCK
FUTURES
569277
42963.50
0.55
FUTURES
STOCK
STOCK
3854.82
3849.98
4.84
60272
4178.31
16.50
OPTIONS
289509
22120.38
-2.09
OPTIONS
TOTAL
48861.22
48390.94
470.27
2115439
141795.07
1.65
TOTAL
5120691
382033.62
17.85
Nifty Spot = 8743.95
Lot Size = 75
Bull-Call Spreads
Bear-Put Spreads
Action
Strike
Price
Risk
Reward
BEP
Action
Strike
Price
Risk
Reward
BEP
Buy
8800
99.55
Buy
8700
86.05
43.85
56.15
8843.85
28.20
71.80
8671.80
Sell
8900
55.70
Sell
8600
57.85
Buy
8800
99.55
Buy
8700
86.05
72.20
127.80
8872.20
46.50
153.50
8653.50
Sell
9000
27.35
Sell
8500
39.55
Buy
8900
55.70
Buy
8600
57.85
28.35
71.65
8928.35
18.30
81.70
8581.70
Sell
9000
27.35
Sell
8500
39.55
Note: Above mentioned Bullish or Bearish Spreads in Nifty (October Series) are given as an information and not as a recommendation.
Nifty Put-Call Analysis
3
Technical & Derivatives Report
October 06, 2016
Daily Pivot Levels for Nifty Constituents
Scrips
S2
S1
PIVOT
R1
R2
ACC
1,611
1,624
1,636
1,650
1,662
ADANIPORTS
261
263
266
269
272
AMBUJACEM
251
254
256
258
260
ASIANPAINT
1,167
1,188
1,206
1,227
1,245
AUROPHARMA
854
860
867
873
879
AXISBANK
522
529
540
546
557
BAJAJ-AUTO
2,807
2,833
2,871
2,897
2,935
BANKBARODA
166
168
170
172
175
BHEL
134
135
137
139
140
BPCL
618
634
643
659
668
BHARTIARTL
317
319
323
325
328
INFRATEL
359
368
373
382
387
BOSCH
22,587
22,695
22,815
22,923
23,043
CIPLA
584
588
594
598
604
COALINDIA
316
319
321
324
326
DRREDDY
3,081
3,102
3,126
3,147
3,171
EICHERMOT
25,346
25,814
26,080
26,547
26,814
GAIL
394
397
402
406
411
GRASIM
4,853
4,893
4,942
4,983
5,032
HCLTECH
798
807
815
824
832
HDFCBANK
1,264
1,275
1,288
1,299
1,311
HDFC
1,402
1,413
1,425
1,436
1,448
HEROMOTOCO
3,440
3,466
3,512
3,537
3,584
HINDALCO
154
156
157
159
161
HINDUNILVR
858
864
869
876
880
ICICIBANK
251
253
257
259
263
IDEA
78
79
81
82
84
INDUSINDBK
1,196
1,206
1,220
1,229
1,243
INFY
1,030
1,036
1,043
1,049
1,056
ITC
237
239
241
243
245
KOTAKBANK
772
777
786
791
800
LT
1,432
1,443
1,452
1,464
1,473
LUPIN
1,475
1,484
1,493
1,502
1,512
M&M
1,376
1,387
1,407
1,418
1,438
MARUTI
5,616
5,652
5,710
5,746
5,804
NTPC
149
151
152
154
156
ONGC
260
263
269
273
279
POWERGRID
179
180
182
183
185
RELIANCE
1,073
1,081
1,094
1,102
1,115
SBIN
256
259
262
264
267
SUNPHARMA
751
755
762
766
773
TCS
2,353
2,370
2,393
2,409
2,432
TATAMTRDVR
346
353
357
364
368
TATAMOTORS
545
552
557
565
570
TATAPOWER
77
78
78
79
80
TATASTEEL
385
388
392
395
400
TECHM
417
421
427
431
437
ULTRACEMCO
3,900
3,967
4,006
4,072
4,111
WIPRO
473
476
480
483
486
YESBANK
1,256
1,268
1,283
1,294
1,309
ZEEL
555
561
568
574
581
4
Technical & Derivatives Report
October 06, 2016
Research Team Tel: 022 - 39357800
For Technical Queries
For Derivatives Queries
DISCLAIMER
Angel Broking Private Limited (hereinafter referred to as “Angel”) is a registered Member of National Stock Exchange of India Limited,
Bombay Stock Exchange Limited and Metropolitan Stock Exchange Limited. It is also registered as a Depository Participant with CDSL
and Portfolio Manager with SEBI. It also has registration with AMFI as a Mutual Fund Distributor. Angel Broking Private Limited is a
registered entity with SEBI for Research Analyst in terms of SEBI (Research Analyst) Regulations, 2014 vide registration number
INH000000164. Angel or its associates has not been debarred/ suspended by SEBI or any other regulatory authority for accessing
/dealing in securities Market. Angel or its associates/analyst has not received any compensation / managed or co-managed public
offering of securities of the company covered by Analyst during the past twelve months.
This document is solely for the personal information of the recipient, and must not be singularly used as the basis of any investment
decision. Nothing in this document should be construed as investment or financial advice. Each recipient of this document should
make such investigations as they deem necessary to arrive at an independent evaluation of an investment in the securities of the
companies referred to in this document (including the merits and risks involved), and should consult their own advisors to determine
the merits and risks of such an investment.
Reports based on technical and derivative analysis center on studying charts of a stock's price movement, outstanding positions and
trading volume, as opposed to focusing on a company's fundamentals and, as such, may not match with a report on a company's
fundamentals. Investors are advised to refer the Fundamental and Technical Research Reports available on our website to evaluate the
contrary view, if any.
The information in this document has been printed on the basis of publicly available information, internal data and other reliable
sources believed to be true, but we do not represent that it is accurate or complete and it should not be relied on as such, as this
document is for general guidance only. Angel Broking Pvt. Limited or any of its affiliates/ group companies shall not be in any way
responsible for any loss or damage that may arise to any person from any inadvertent error in the information contained in this report.
Angel Broking Pvt. Limited has not independently verified all the information contained within this document. Accordingly, we cannot
testify, nor make any representation or warranty, express or implied, to the accuracy, contents or data contained within this document.
While Angel Broking Pvt. Limited endeavors to update on a reasonable basis the information discussed in this material, there may be
regulatory, compliance, or other reasons that prevent us from doing so.
This document is being supplied to you solely for your information, and its contents, information or data may not be reproduced,
redistributed or passed on, directly or indirectly.
Neither Angel Broking Pvt. Limited, nor its directors, employees or affiliates shall be liable for any loss or damage that may arise from
or in connection with the use of this information.
5