Technical & Derivatives Report
September 06, 2016
Sensex (28532) / Nifty (8810)
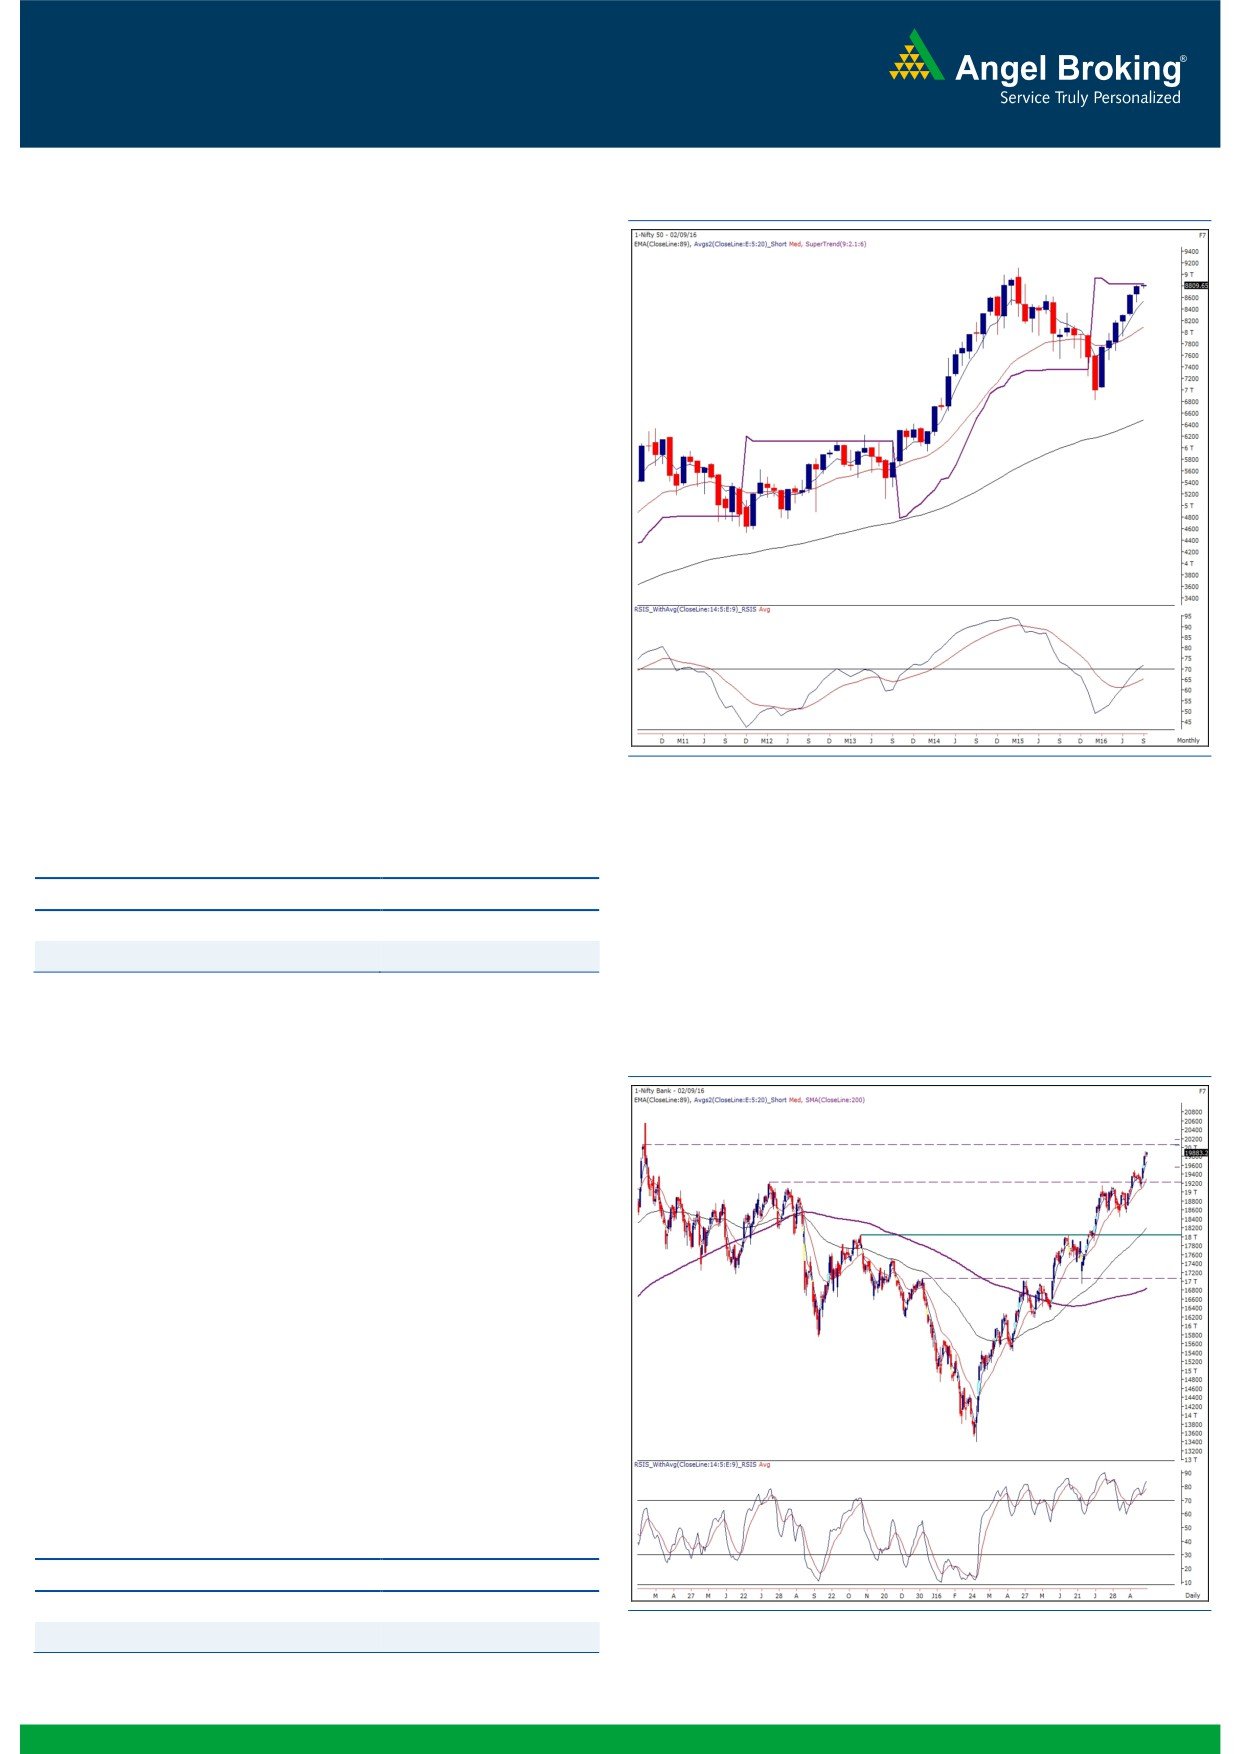
Exhibit 1: Nifty Monthly Chart
Finally, after a time-wise pain of nearly a month, the bulls had
something to cheer about. Due to last week’s spectacular move,
the Nifty managed to close above the psychological level of 8800
as well as at the highest point of the calendar year 2016. Our
contradictory view to go long around 8550 (as per the 5th point
confirmation for ‘Bullish Wolfe wave’) played out well because of
low risk trade with reasonably higher reward. The Nifty met with
the pattern target of 8720 and given the strong momentum, it
even went on to enter our near term target zone of 8800 - 8850.
Now at this juncture, we see resistance points converging around
8850 along with the ‘Super Trend’ on the monthly chart placed at
8831. Thus, to be on the conservative side, we would now advise
traders to start taking some money off the table although we do
not want to sound pessimistic at this point in time since there is no
sign of reversal or weakness. But we would prefer to reassess the
market developments over the next few days and want to wait for
clear signals to emerge for a near term direction. If the Nifty is
able to surpass the 8850 mark, then it may continue to head
higher; whereas, on the flipside, a minor profit booking could
lead to some corrective move towards 8720 - 8670 levels.
Key Levels
Support 1 - 8850
Resistance 1 - 8720
Support 2 - 8900
Resistance 2 - 8670
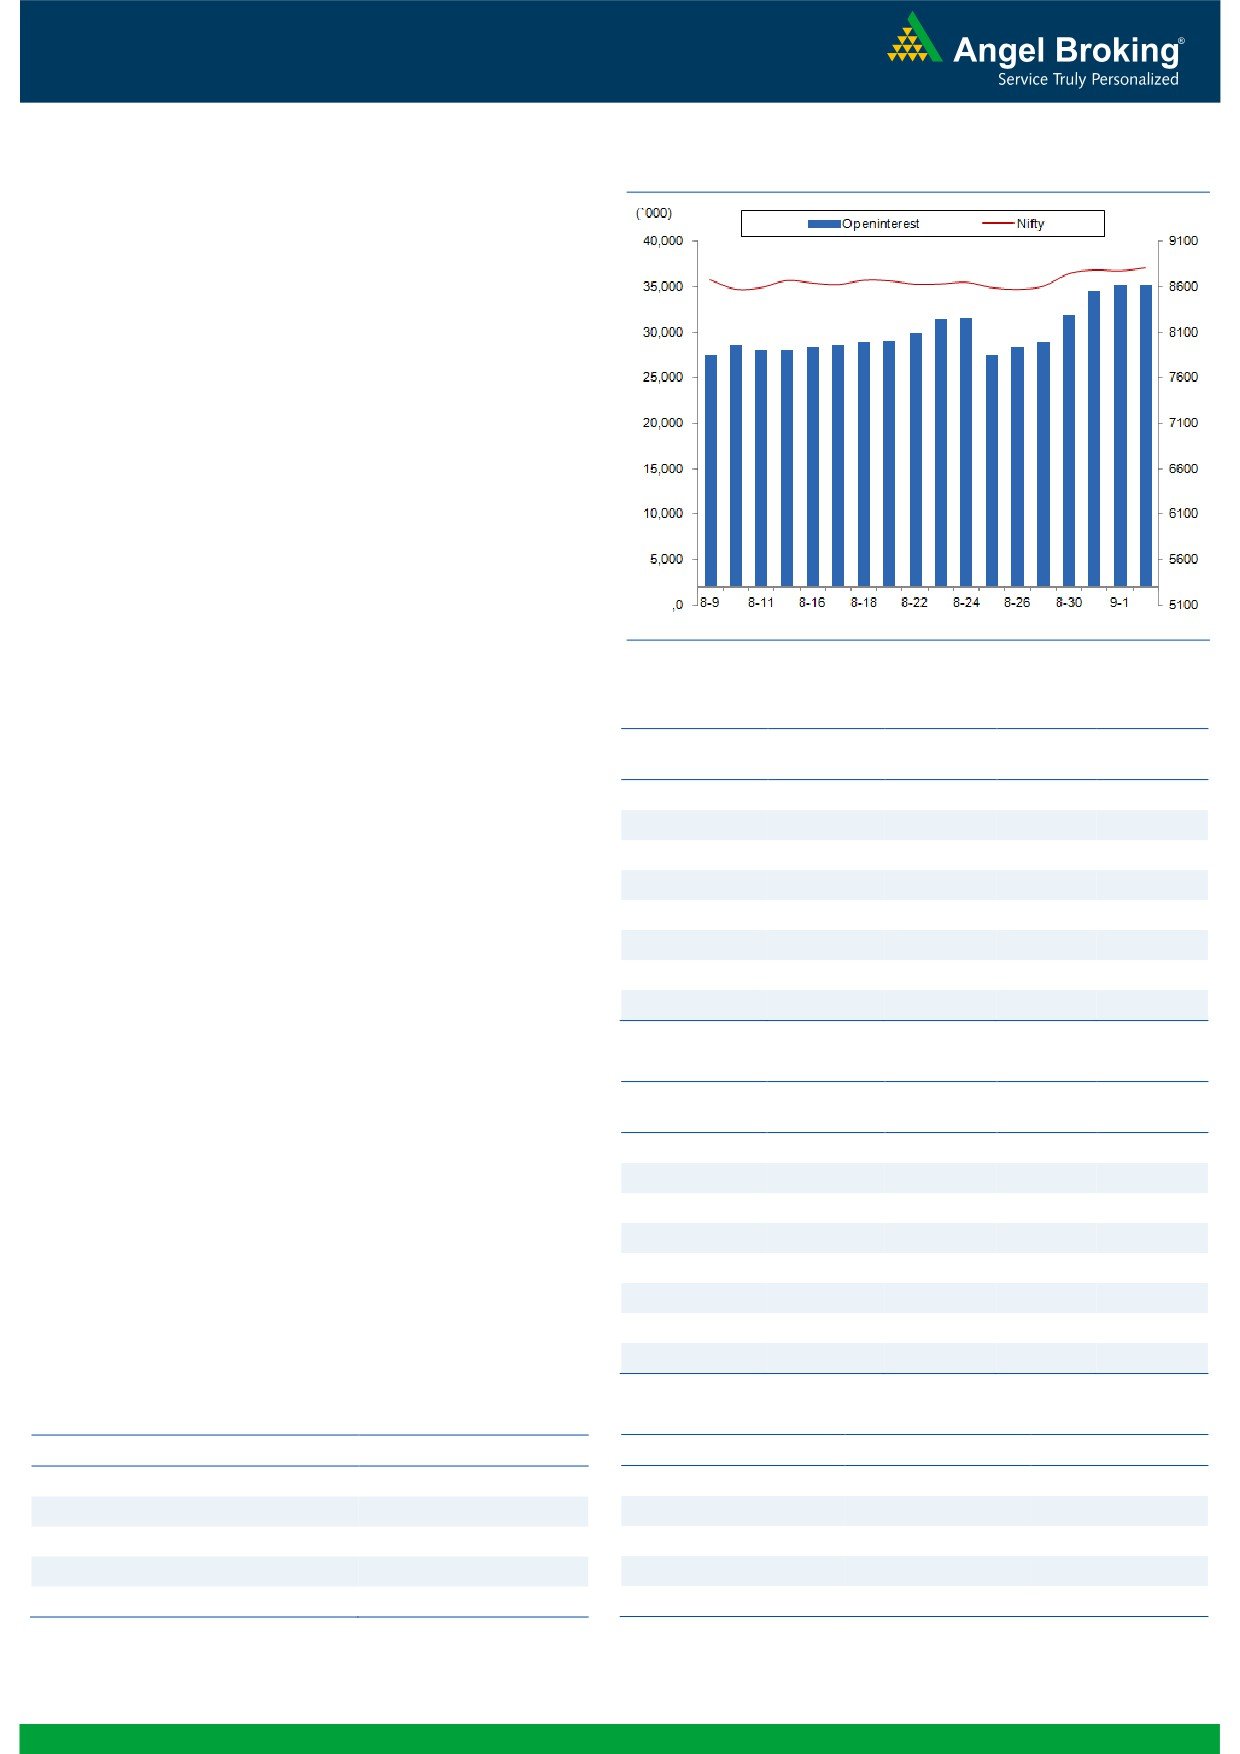
Nifty Bank Outlook - (19883)
Exhibit 2: Nifty Bank Daily Chart
The Nifty Bank index opened with marginal gains on Friday and
traded in narrow range throughout the session. With some
positive traction, the banking index managed to end the session
with gains of 0.48 percent over its previous close. The Nifty Bank
index posted a strong weekly gain of 3.58 percent and thus
outperformed benchmark indices.
Going forward, the positive momentum in banking
conglomerates should continue in upcoming sessions too as there
is no sign of reversal. We advise traders not to pre-emt any
corrective move as of now and avoid taking short positions at
current juncture. They should follow stock centric approach with
proper risk management. The intraday support for the index are
placed around 19787 and 19700 whereas resistance is seen in
range of 20000 - 20180.
Key Levels
Support 1 - 19787
Resistance 1 - 20000
Support 2 - 19700
Resistance 2 - 20180
1
Technical & Derivatives Report
September 06, 2016
Comments
Nifty Vs OI
The Nifty futures open interest has decreased by 1.23%
BankNifty futures open interest has increased by 0.18%
as market closed at 8809.65 levels.
The Nifty September future closed with a premium of
30.50 points against a premium of 33.70 points in
previous session. The October series closed at a
premium of 69.85 points.
The Implied Volatility of at the money options has
decreased from 11.47% to 11.03%. At the same time,
the PCR-OI of Nifty has increased from 1.11 to 1.13.
The total OI of the market is Rs. 2,77,570/- cr. and the
stock futures OI is Rs. 83,092/- cr.
Few of the liquid counters where we have seen high cost
of carry are SOUTHBANK, IBREALEST, GRANULES,
GMRINFRA and ADANIPOWER.
Views
OI Gainers
OI
PRICE
On Friday, FIIs were net buyers in equity cash segment
SCRIP
OI
PRICE
CHG. (%)
CHG. (%)
worth Rs. 231. While, they sold index future worth
APOLLOTYRE
11712000
18.84
195.85
4.87
Rs. 399 crores with marginal fall in OI, indicating blend
PETRONET
3951000
16.96
353.40
1.00
of long unwinding and short build-up in last trading
AMARAJABAT
681600
14.06
993.05
2.48
session.
www.angelbroking.com
ALBK
15210000
10.30
84.95
3.03
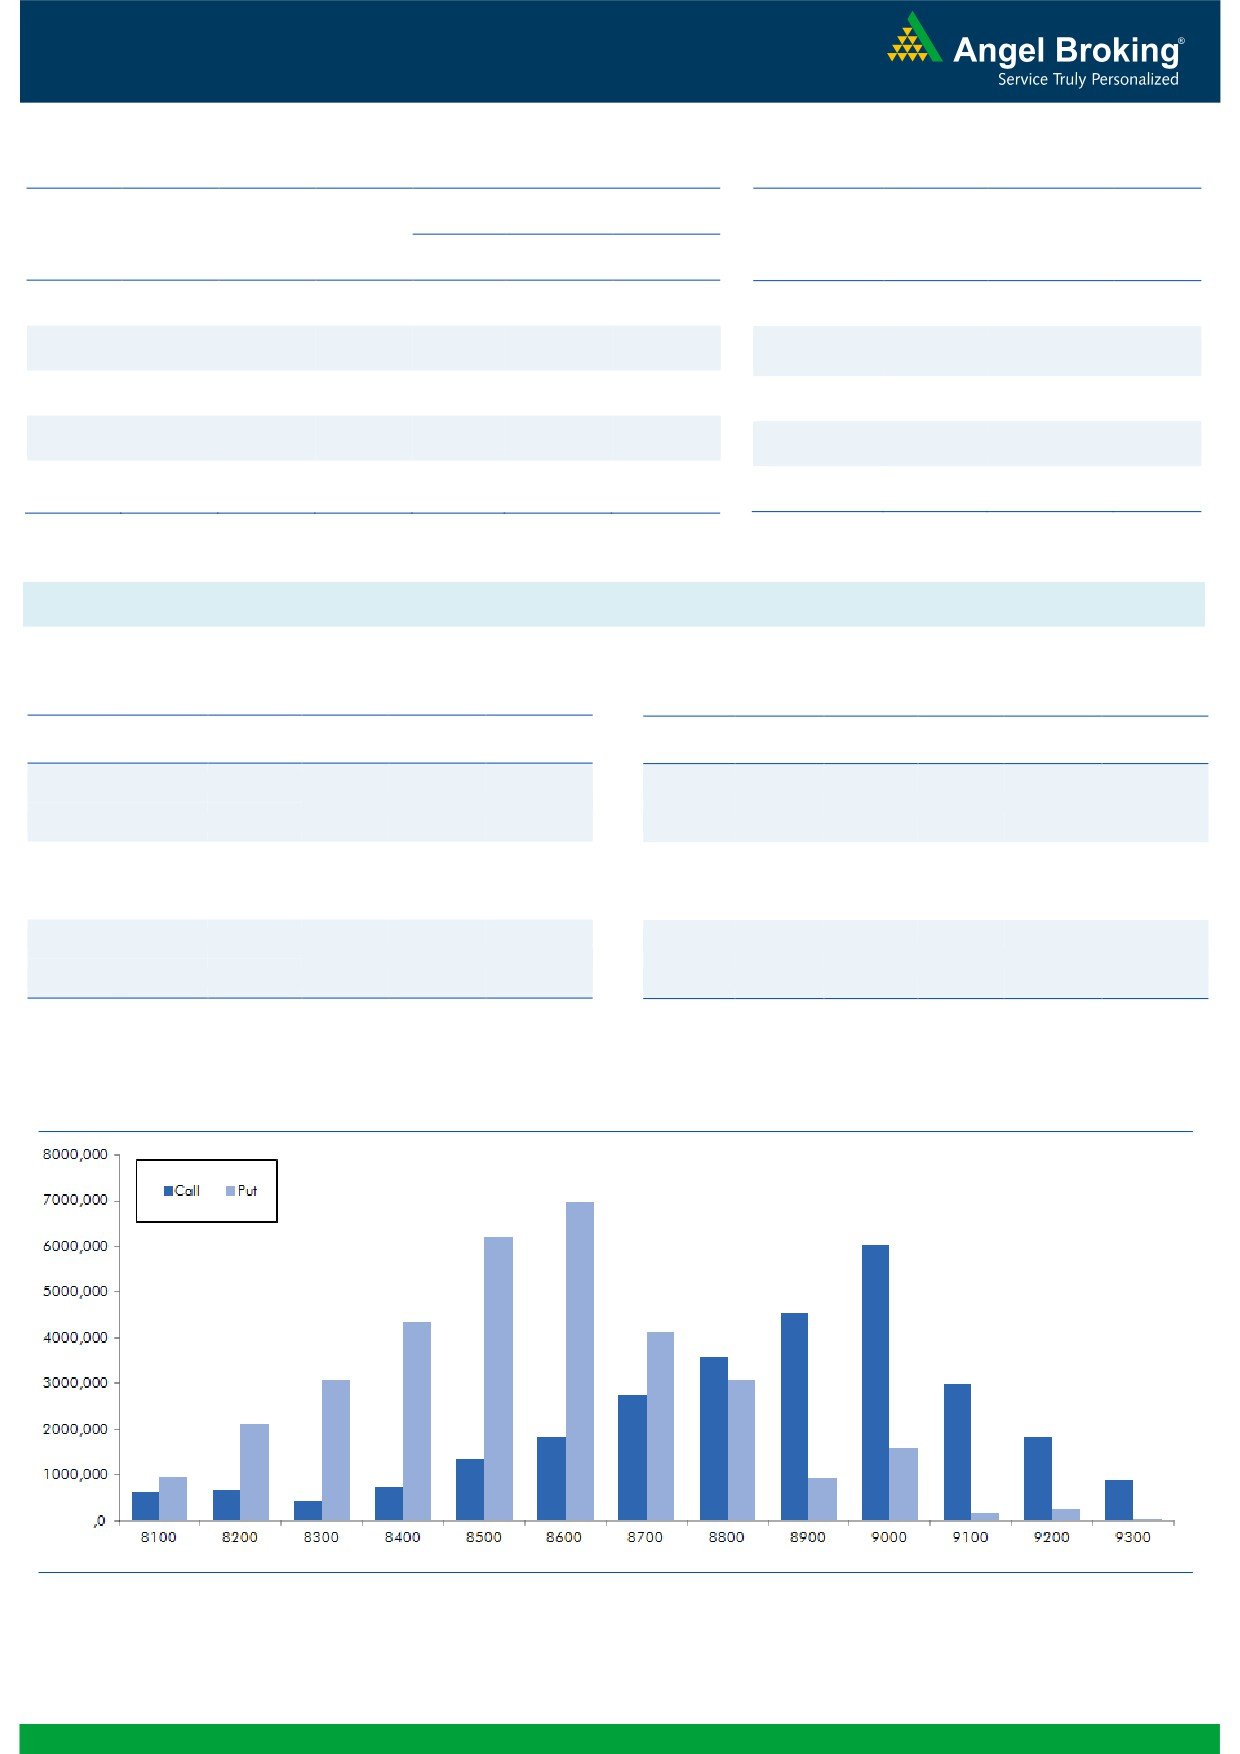
On Index Options front, FIIs were net buyers of Rs. 179
CEATLTD
2954700
8.20
956.15
6.42
crores with rise in OI. In call options, marginal OI build-
ACC
1582400
7.94
1680.40
-1.18
up was seen in 9000 and 8800 strikes; followed by some
DLF
46445000
7.91
151.00
0.87
unwinding in 8700 strike. While in put options, 8600
KSCL
4170000
7.17
329.20
-4.08
strike was active and added good amount of positions;
followed by OI build-up in 8700 and 8800 strikes. We
also witnessed some unwinding in 8500 put option.
OI Losers
OI
PRICE
Highest OI in September series remains intact in 9000
SCRIP
OI
PRICE
CHG. (%)
CHG. (%)
call; while in put option, it got shifted from 8500 to 8600
APOLLOHOSP
445200
-13.45
1377.60
0.89
strike.
DABUR
5267500
-5.77
297.70
0.98
Although some profit booking was seen by FIIs in index
RCOM
131150000
-5.76
49.40
0.10
future segment, but the quantum was very low. We
TCS
5068500
-5.02
2521.15
-0.12
reiterate our bullish stance on index as there is no sign of
M&M
6382000
-4.93
1477.40
1.16
weakness in market as per derivative data. Thus,
JINDALSTEL
52902000
-4.73
81.85
-3.25
intraday dips are buying opportunities in Nifty as we may
LUPIN
6150900
-4.40
1521.85
0.62
see 8950-9000 in near term.
BIOCON
3572800
-4.33
917.50
0.49
Historical Volatility
Put-Call Ratio
SCRIP
HV
SCRIP
PCR-OI
PCR-VOL
CEATLTD
46.35
NIFTY
1.13
1.16
MRF
33.22
BANKNIFTY
1.17
1.01
RELINFRA
40.74
RELIANCE
0.42
0.49
APOLLOTYRE
48.61
SBIN
0.82
0.66
KSCL
42.81
TATAMOTORS
1.31
0.82
2
Technical & Derivatives Report
September 06, 2016
FII Statistics for 02, September 2016
Turnover on 02, September 2016
Open Interest
No. of
Turnover
Change
Detail
Buy
Sell
Net
Instrument
Value
Contracts
( in Cr. )
(%)
Contracts
Change (%)
(in Cr.)
INDEX
INDEX
1485.52
1884.71
(399.19)
438487
29563.94
(0.70)
157318
11192.32
-19.90
FUTURES
FUTURES
INDEX
INDEX
26409.83
26230.95
178.89
1051203
70826.62
2.86
1979607
142658.67
-64.54
OPTIONS
OPTIONS
STOCK
6581.64
6180.61
401.03
875664
58633.06
0.57
STOCK
FUTURES
524038
35769.94
-14.81
FUTURES
STOCK
STOCK
3929.79
4004.01
(74.22)
81830
5606.74
9.32
OPTIONS
294593
19537.28
-21.60
OPTIONS
TOTAL
38406.78
38300.28
106.50
2447184
164630.36
1.58
TOTAL
2955556
209158.21
-56.71
Nifty Spot = 8809.65
Lot Size = 75
Bull-Call Spreads
Bear-Put Spreads
Action
Strike
Price
Risk
Reward
BEP
Action
Strike
Price
Risk
Reward
BEP
Buy
8900
76.70
Buy
8800
91.65
34.45
65.55
8934.45
31.45
68.55
8768.55
Sell
9000
42.25
Sell
8700
60.20
Buy
8900
76.70
Buy
8800
91.65
55.85
144.15
8955.85
52.00
148.00
8748.00
Sell
9100
20.85
Sell
8600
39.65
Buy
9000
42.25
Buy
8700
60.20
21.40
78.60
9021.40
20.55
79.45
8679.45
Sell
9100
20.85
Sell
8600
39.65
Note: Above mentioned Bullish or Bearish Spreads in Nifty (September Series) are given as an information and not as a recommendation.
Nifty Put-Call Analysis
3
Technical & Derivatives Report
September 06, 2016
Daily Pivot Levels for Nifty Constituents
Scrips
S2
S1
PIVOT
R1
R2
ACC
1,646
1,658
1,677
1,689
1,708
ADANIPORTS
252
260
265
273
277
AMBUJACEM
271
274
276
279
282
ASIANPAINT
1,143
1,155
1,164
1,176
1,184
AUROPHARMA
758
769
777
788
796
AXISBANK
591
595
598
603
606
BAJAJ-AUTO
2,888
2,943
2,979
3,034
3,070
BANKBARODA
159
163
165
168
171
BHEL
133
135
136
137
138
BPCL
577
582
586
591
596
BHARTIARTL
301
310
315
324
330
INFRATEL
334
339
345
350
356
BOSCH
23,580
23,795
24,118
24,333
24,655
CIPLA
567
573
577
582
586
COALINDIA
328
330
334
336
339
DRREDDY
3,058
3,090
3,115
3,147
3,172
EICHERMOT
22,596
22,707
22,865
22,976
23,135
GAIL
386
391
394
399
402
GRASIM
4,494
4,553
4,597
4,656
4,700
HCLTECH
775
780
784
788
792
HDFCBANK
1,277
1,281
1,285
1,289
1,293
HDFC
1,413
1,426
1,434
1,447
1,455
HEROMOTOCO
3,519
3,548
3,581
3,611
3,643
HINDALCO
152
155
157
159
161
HINDUNILVR
913
917
922
926
931
ICICIBANK
258
260
262
264
266
IDEA
79
82
83
86
88
INDUSINDBK
1,176
1,184
1,189
1,197
1,202
INFY
1,019
1,025
1,033
1,039
1,046
ITC
259
261
262
264
266
KOTAKBANK
805
809
813
817
820
LT
1,476
1,490
1,501
1,516
1,527
LUPIN
1,495
1,507
1,516
1,527
1,536
M&M
1,421
1,447
1,462
1,488
1,502
MARUTI
5,028
5,094
5,141
5,208
5,255
NTPC
156
158
160
161
163
ONGC
233
236
238
241
243
POWERGRID
181
182
184
185
186
RELIANCE
986
1,000
1,016
1,030
1,046
SBIN
250
252
254
256
257
SUNPHARMA
762
772
778
788
795
TCS
2,487
2,501
2,510
2,524
2,533
TATAMTRDVR
345
348
351
354
356
TATAMOTORS
545
547
552
554
558
TATAPOWER
77
78
79
80
81
TATASTEEL
368
371
374
377
379
TECHM
462
467
471
475
479
ULTRACEMCO
4,016
4,051
4,073
4,108
4,130
WIPRO
477
480
483
486
489
YESBANK
1,350
1,369
1,382
1,401
1,414
ZEEL
525
529
535
539
544
4
Technical & Derivatives Report
September 06, 2016
Research Team Tel: 022 - 39357800
For Technical Queries
For Derivatives Queries
DISCLAIMER
Angel Broking Private Limited (hereinafter referred to as “Angel”) is a registered Member of National Stock Exchange of India Limited,
Bombay Stock Exchange Limited and Metropolitan Stock Exchange Limited. It is also registered as a Depository Participant with CDSL
and Portfolio Manager with SEBI. It also has registration with AMFI as a Mutual Fund Distributor. Angel Broking Private Limited is a
registered entity with SEBI for Research Analyst in terms of SEBI (Research Analyst) Regulations, 2014 vide registration number
INH000000164. Angel or its associates has not been debarred/ suspended by SEBI or any other regulatory authority for accessing
/dealing in securities Market. Angel or its associates/analyst has not received any compensation / managed or co-managed public
offering of securities of the company covered by Analyst during the past twelve months.
This document is solely for the personal information of the recipient, and must not be singularly used as the basis of any investment
decision. Nothing in this document should be construed as investment or financial advice. Each recipient of this document should
make such investigations as they deem necessary to arrive at an independent evaluation of an investment in the securities of the
companies referred to in this document (including the merits and risks involved), and should consult their own advisors to determine
the merits and risks of such an investment.
Reports based on technical and derivative analysis center on studying charts of a stock's price movement, outstanding positions and
trading volume, as opposed to focusing on a company's fundamentals and, as such, may not match with a report on a company's
fundamentals. Investors are advised to refer the Fundamental and Technical Research Reports available on our website to evaluate the
contrary view, if any.
The information in this document has been printed on the basis of publicly available information, internal data and other reliable
sources believed to be true, but we do not represent that it is accurate or complete and it should not be relied on as such, as this
document is for general guidance only. Angel Broking Pvt. Limited or any of its affiliates/ group companies shall not be in any way
responsible for any loss or damage that may arise to any person from any inadvertent error in the information contained in this report.
Angel Broking Pvt. Limited has not independently verified all the information contained within this document. Accordingly, we cannot
testify, nor make any representation or warranty, express or implied, to the accuracy, contents or data contained within this document.
While Angel Broking Pvt. Limited endeavors to update on a reasonable basis the information discussed in this material, there may be
regulatory, compliance, or other reasons that prevent us from doing so.
This document is being supplied to you solely for your information, and its contents, information or data may not be reproduced,
redistributed or passed on, directly or indirectly.
Neither Angel Broking Pvt. Limited, nor its directors, employees or affiliates shall be liable for any loss or damage that may arise from
or in connection with the use of this information.
5