Technical & Derivatives Report
April 06, 2016
Sensex (24884) / Nifty (7603)
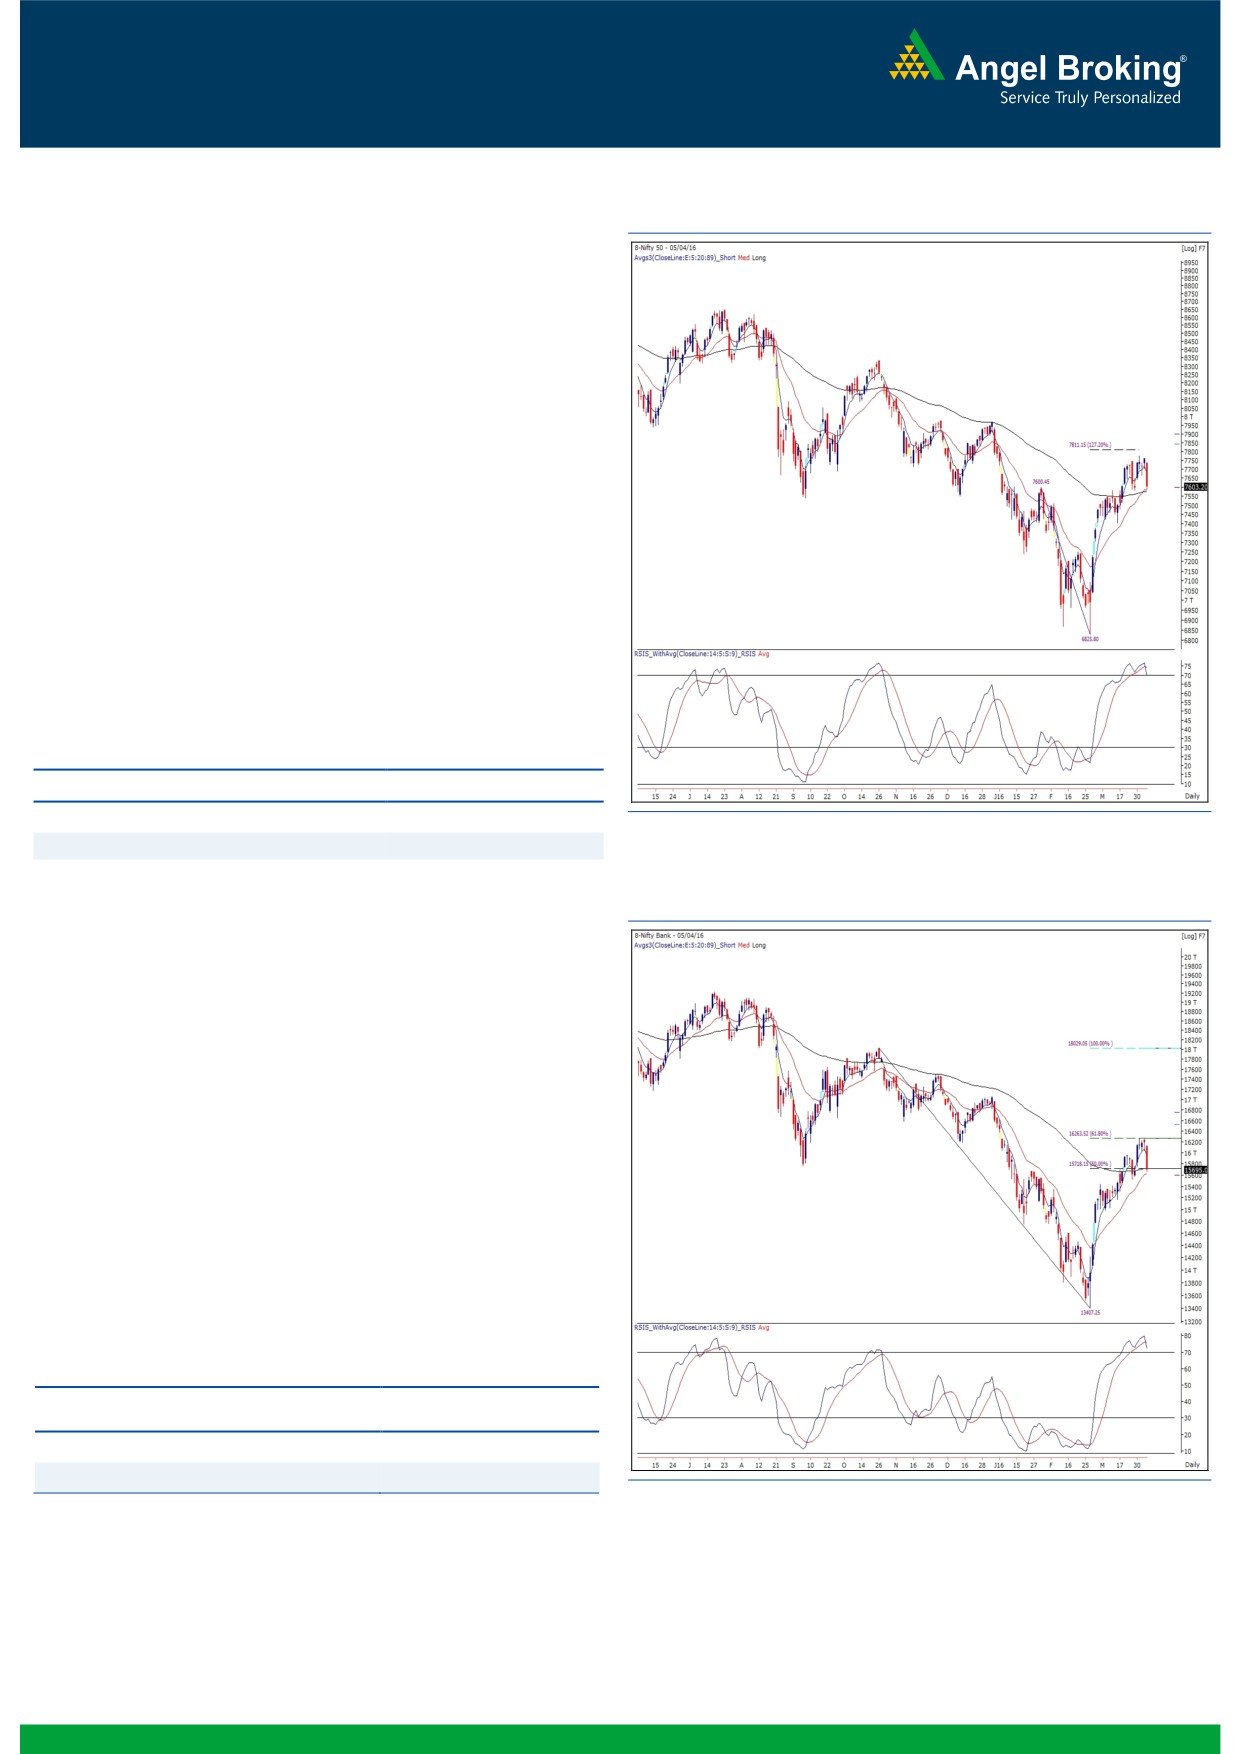
Exhibit 1: Nifty Daily Chart
In yesterday's trading session, the Nifty index started correcting
from the opening tick. The index traded with marginal negative
bias till the time of announcement of RBI monetary policy.
However, post the policy outcome, the sell off accelerated and the
index crept lower throughout the day to end the session with
losses over 2 percent.
The multiple resistances that we were mentioning in our daily
report since last couple of sessions played out well and thus we
hope the readers have reaped benefit from our forecast of a
possible reversal from 7750-7800 resistance zone. Unless any
positive sign emerging on charts, traders should stay cautious and
not create aggressive longs in this correction. Currently, the index
is hovering around its support zone of 7600 - 7550 and below
that the next support is placed around 7400. On any pullback
move, the Nifty index could resist around 7666 and 7736.
Key Levels
Support 1 - 7550
Resistance 1 - 7666
Support 2 - 7500
Resistance 2 - 7736
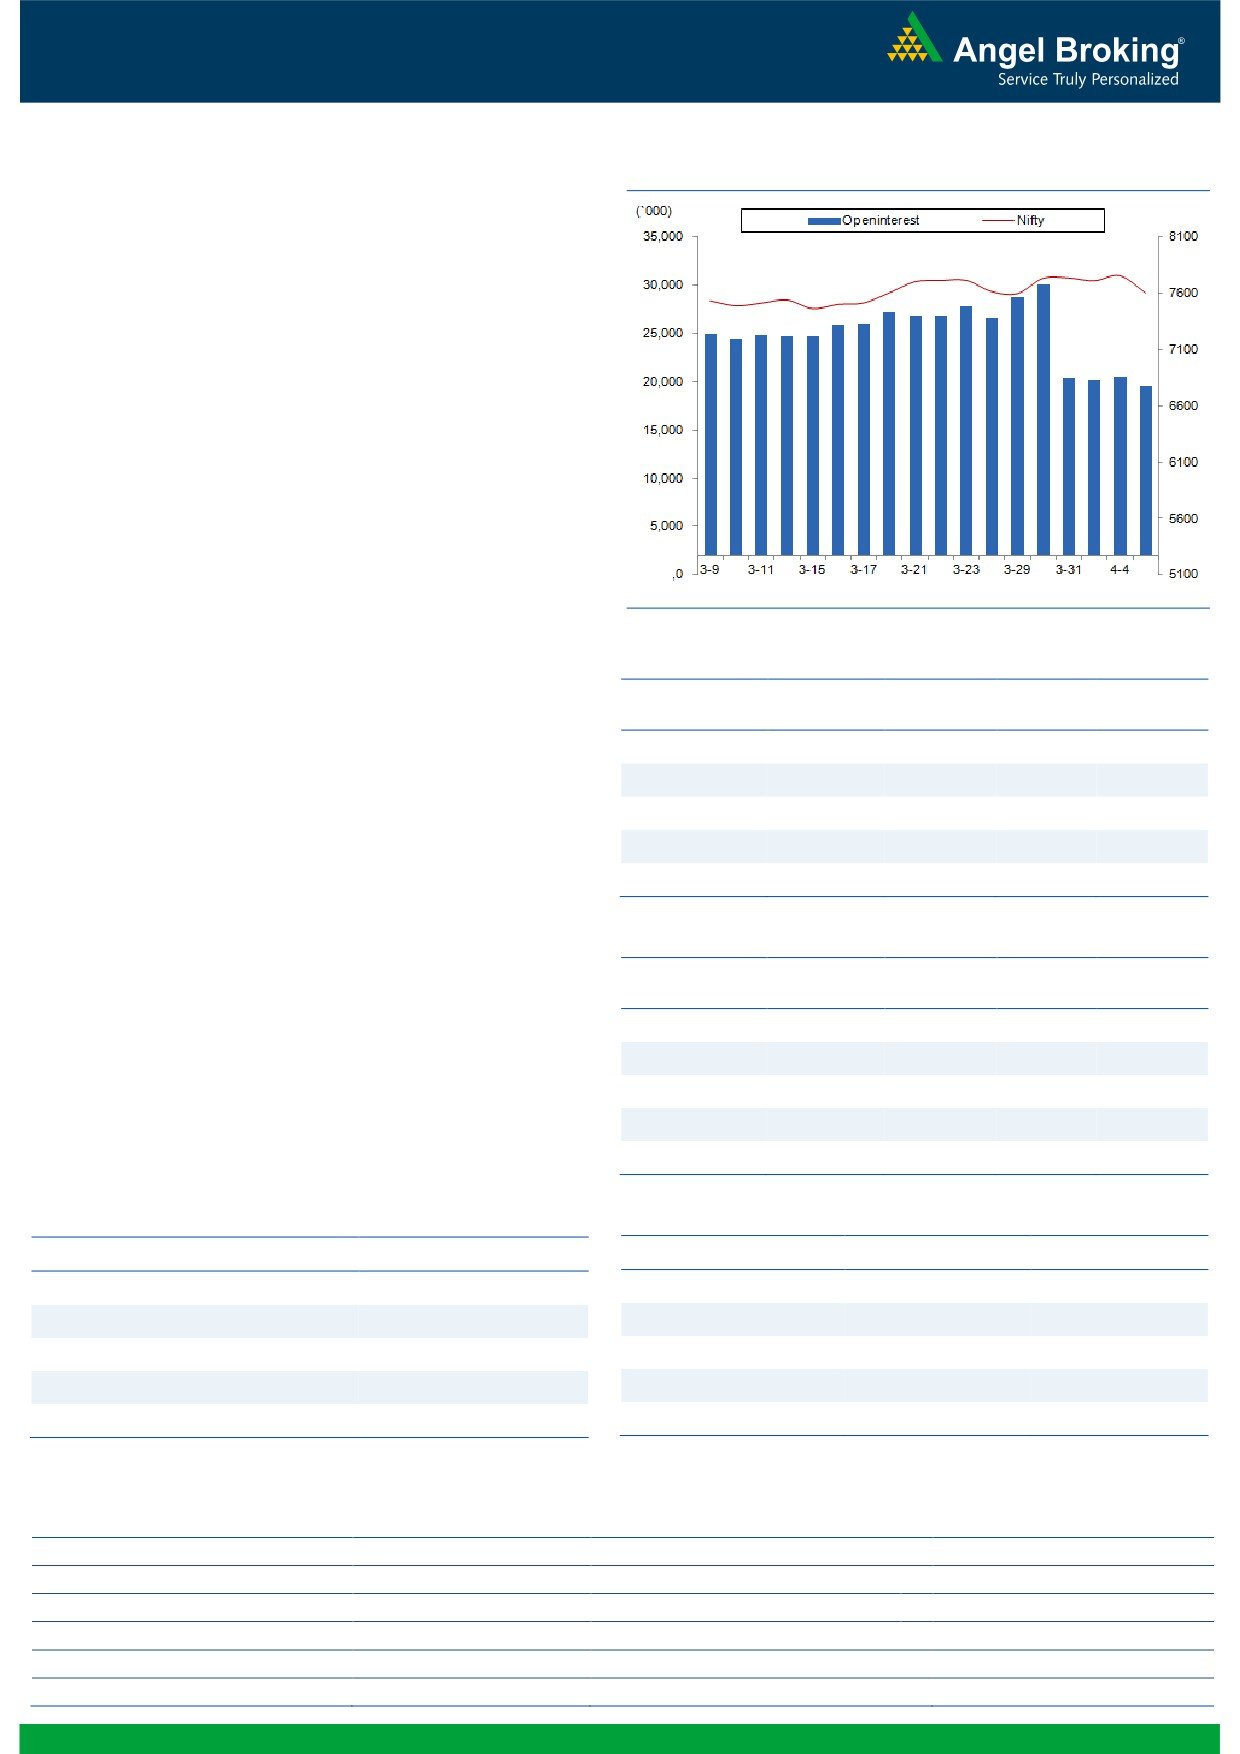
Exhibit 2: Nifty Bank Daily Chart
Nifty Bank Outlook - (15695)
Yesterday, the Nifty Bank index opened with loss of around 60
points and started correcting from initial trades. The fall got
accelerated as the time passed on. Eventually, the Nifty Bank
index ended the session with huge cut of 3.06 percent over its
previous close.
Yesterday’s sharp decline was on our expected line as we had
already mentioned in our previous report that a move below
15950 - 16000 zone may drag index to 15700 levels. The
gigantic fall from the multiple resistance zone of 16260 - 16400
doesn’t bode well for Bulls. The ‘RSI -Smoothened’ oscillator has
also given negative crossover with its average from overbought
territory, indicates further weakness in the index. Going forward,
the Nifty Bank index has support at 15520 and 15300 levels. On
the flipside resistance can be seen around 15845 and 16050.
Key Levels
Support 1 - 15520
Resistance 1 - 15845
Support 2 - 15300
Resistance 2 - 16050
1
Technical & Derivatives Report
April 06, 2016
Comments
Nifty Vs OI
The Nifty futures open interest has decreased by 4.10%
BankNifty futures open interest has increased by 7.67%
as market closed at 7603.20 levels.
The Nifty April future closed at a premium of 20.30
points against a premium of 31.95 points. The May
series closed at a premium of 54.50 points.
The Implied Volatility of at the money options has
increased from 15.62% to 16.46%.
The total OI of the market is Rs. 1,86,551/- cr. and the
stock futures OI is Rs. 52,405 /- cr.
Few of the liquid counters where we have seen high cost
of carry are UNITECH, IOC, FEDERALBNK, L&TFH and
HDFCBANK.
Views
FIIs after long time have been net sellers in both cash
OI Gainers
market and Index Futures. They sold equities to the tune
OI
PRICE
of Rs. 801 crores. While in Index Futures, they were net
SCRIP
OI
PRICE
CHG. (%)
CHG. (%)
seller of Rs. 1224 crores with some fall in rise in OI,
HINDZINC
8012800
30.15
185.10
-0.75
suggesting blend of both long unwinding and short
EXIDEIND
7187600
24.06
132.20
-5.77
formation in last trading session.
GODREJCP
311600
13.06
1360.65
-4.44
In Index Options front, FIIs were net buyers of Rs. 527
UNIONBANK
7824000
11.98
128.95
-5.88
crores with significant rise in OI. They have formed hugeng.com
BATAINDIA
1576000
10.44
513.65
-2.22
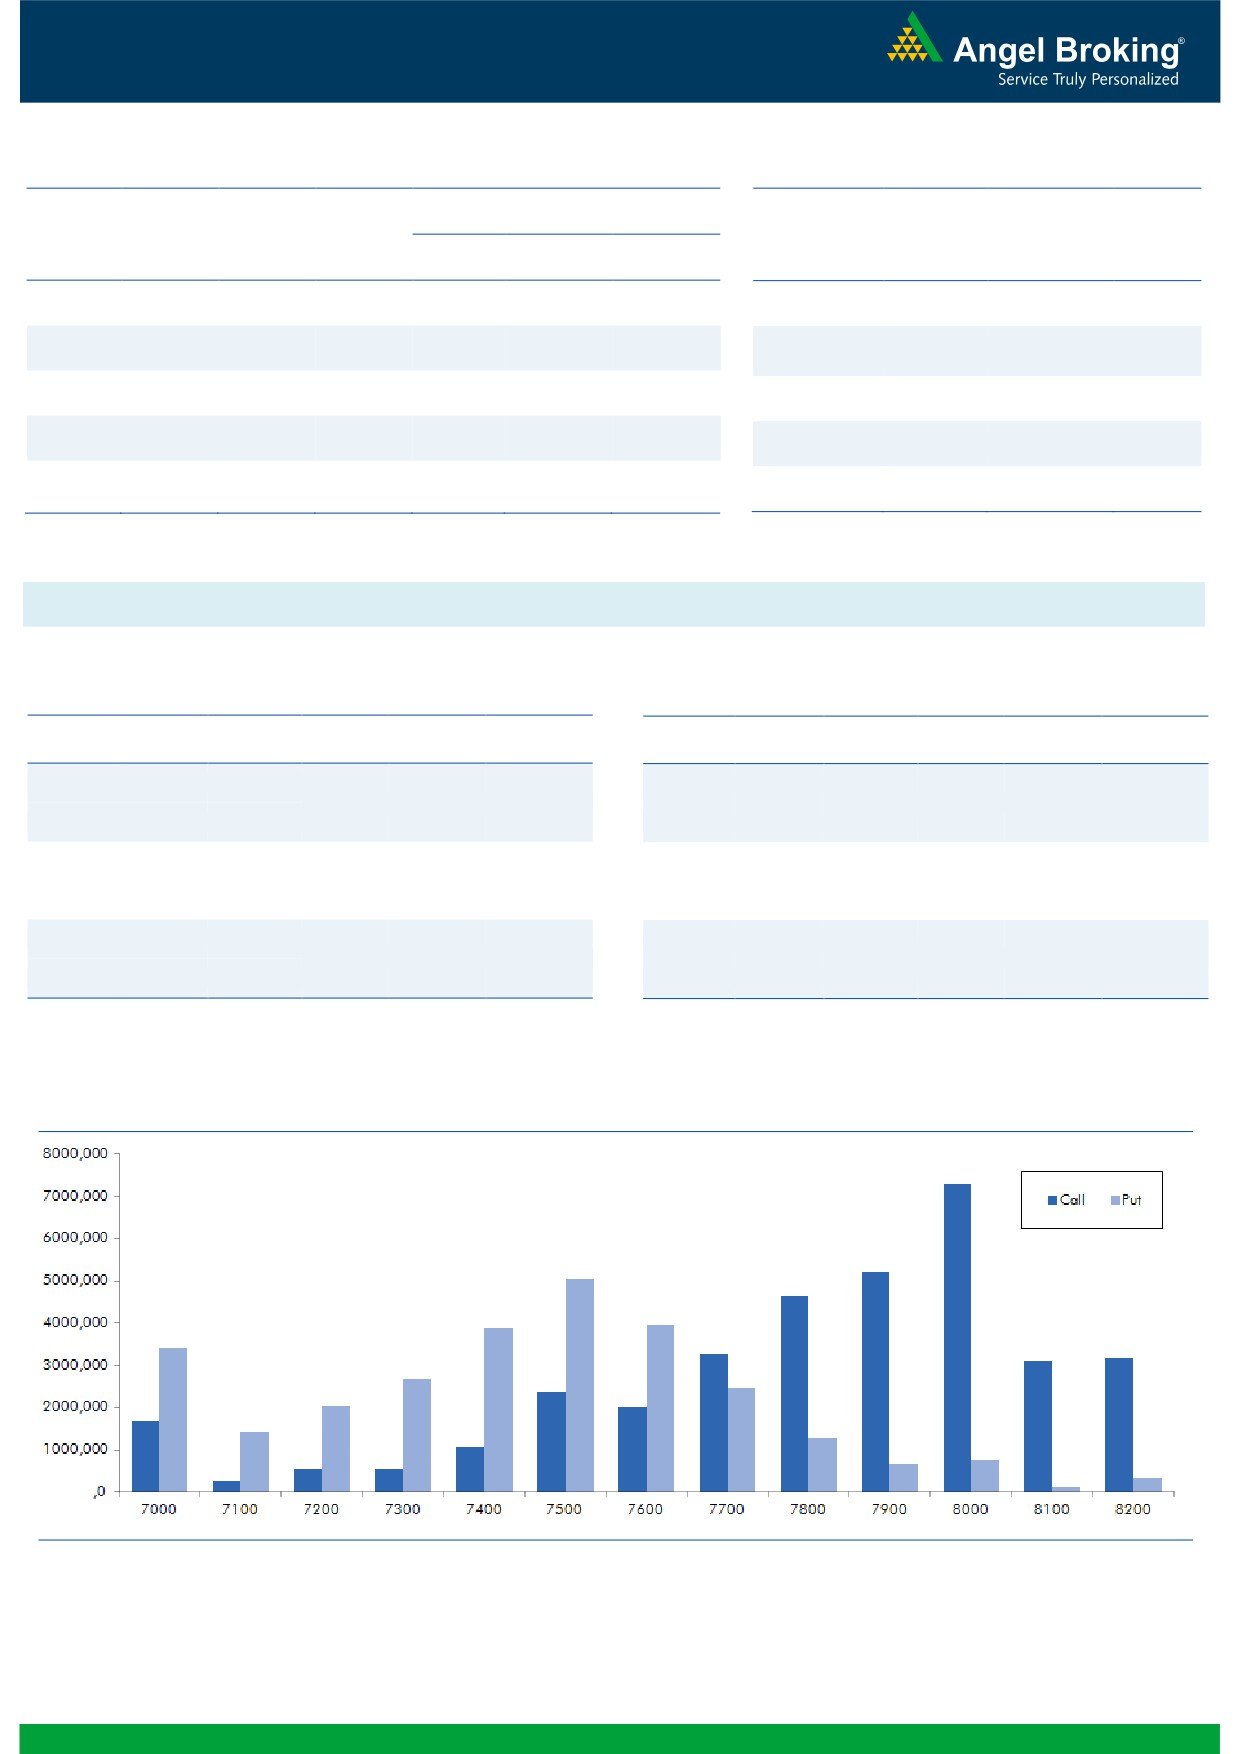
positions in Nifty options, which is mix of long and short.
In call options, 7700 to
8100 strikes added good
OI Losers
amount of build-up. Whereas, in put options,
7600,
OI
PRICE
7400 and 7300 strikes added decent OI. Maximum OI
SCRIP
OI
PRICE
CHG. (%)
CHG. (%)
in current series is visible in 8000 call and 7500 put
TVSMOTOR
3378000
-11.06
314.70
-3.23
options. Yesterday, we saw good amount of profit
DHFL
5744200
-9.47
190.25
-6.40
booking in Nifty by FIIs, while fresh shorts were added in
DLF
29515000
-7.59
113.60
-4.58
BankNifty. We remain negative on banking sector,
KPIT
1288000
-6.94
149.10
-1.29
heavyweight counters like SBIN and YESBANK added
HEXAWARE
3482000
-6.85
251.95
-0.89
good amount of shorts in yesterday’s fall.
Historical Volatility
Put-Call Ratio
SCRIP
HV
SCRIP
PCR-OI
PCR-VOL
BIOCON
42.54
NIFTY
0.79
0.86
EXIDEIND
39.95
BANKNIFTY
0.69
0.76
L&TFH
53.26
SBIN
0.31
0.42
ADANIPORTS
54.56
ICICIBANK
0.39
0.49
NHPC
51.33
LUPIN
0.55
0.69
Strategy Date
Symbol
Strategy
Status
April 04, 2016
TCS
Ratio Bear Put Spread
Active
2
Technical & Derivatives Report
April 06, 2016
FII Statistics for 05-April 2016
Turnover on 05-April 2016
Open Interest
No. of
Turnover
Change
Detail
Buy
Sell
Net
Instrument
Value
Contracts
( in Cr. )
(%)
Contracts
Change (%)
(in Cr.)
INDEX
INDEX
2141.91
3365.99
(1224.08)
243164
13601.61
(2.04)
467463
25053.98
130.76
FUTURES
FUTURES
INDEX
INDEX
41075.99
40548.86
527.13
964452
54431.46
10.91
3799452
215572.45
137.65
OPTIONS
OPTIONS
STOCK
4393.91
4070.25
323.65
976858
44630.32
0.58
STOCK
FUTURES
597173
28351.48
40.81
FUTURES
STOCK
STOCK
2794.13
2888.08
(93.96)
39195
1779.08
42.45
OPTIONS
297988
14453.33
64.13
OPTIONS
TOTAL
50405.93
50873.19
(467.26)
2223669
114442.48
5.06
TOTAL
5162076
283431.23
117.18
Nifty Spot = 7603.20
Lot Size = 75
Bull-Call Spreads
Bear-Put Spreads
Action
Strike
Price
Risk
Reward
BEP
Action
Strike
Price
Risk
Reward
BEP
Buy
7600
137.55
Buy
7600
116.25
49.35
50.65
7649.35
35.70
64.30
7564.30
Sell
7700
88.20
Sell
7500
80.55
Buy
7600
137.55
Buy
7600
116.25
85.70
114.30
7685.70
62.25
137.75
7537.75
Sell
7800
51.85
Sell
7400
54.00
Buy
7700
88.20
Buy
7500
80.55
36.35
63.65
7736.35
26.55
73.45
7473.45
Sell
7800
51.85
Sell
7400
54.00
Note: Above mentioned Bullish or Bearish Spreads in Nifty (April Series) are given as an information and not as a recommendation.
Nifty Put-Call Analysis
3
Technical & Derivatives Report
April 06, 2016
Daily Pivot Levels for Nifty Constituents
Scrips
S2
S1
PIVOT
R1
R2
ACC
1,370
1,380
1,398
1,408
1,426
ADANIPORTS
212
219
231
238
249
AMBUJACEM
222
224
227
230
233
ASIANPAINT
849
859
872
883
896
AUROPHARMA
728
740
753
765
778
AXISBANK
419
426
438
444
456
BAJAJ-AUTO
2,333
2,364
2,417
2,448
2,501
BANKBARODA
138
141
147
150
155
BHEL
109
111
114
116
120
BPCL
869
880
895
906
921
BHARTIARTL
318
324
335
342
353
INFRATEL
365
370
376
381
388
BOSCH
19,433
19,623
19,894
20,085
20,356
CIPLA
492
498
507
512
521
COALINDIA
267
271
278
282
289
DRREDDY
2,963
2,981
3,011
3,029
3,059
EICHERMOT
18,135
18,435
18,942
19,242
19,749
GAIL
332
336
342
346
352
GRASIM
3,785
3,810
3,848
3,874
3,912
HCLTECH
825
834
842
851
858
HDFCBANK
1,042
1,050
1,063
1,071
1,085
HDFC
1,074
1,089
1,100
1,114
1,125
HEROMOTOCO
2,912
2,938
2,975
3,001
3,038
HINDALCO
81
83
86
88
91
HINDUNILVR
851
860
871
880
892
ICICIBANK
217
221
229
234
242
IDEA
106
108
111
112
115
INDUSINDBK
936
944
954
961
972
INFY
1,197
1,208
1,225
1,237
1,254
ITC
321
324
327
330
333
KOTAKBANK
653
661
673
681
693
LT
1,162
1,179
1,207
1,223
1,251
LUPIN
1,430
1,447
1,463
1,480
1,496
M&M
1,192
1,204
1,226
1,238
1,259
MARUTI
3,436
3,495
3,596
3,656
3,756
NTPC
123
125
128
130
134
ONGC
202
204
206
208
210
POWERGRID
137
138
140
140
142
RELIANCE
1,010
1,019
1,031
1,039
1,051
SBIN
176
180
187
192
199
SUNPHARMA
789
795
806
812
823
TCS
2,420
2,442
2,463
2,484
2,506
TATAMTRDVR
261
266
275
280
289
TATAMOTORS
358
364
375
381
392
TATAPOWER
66
66
67
68
69
TATASTEEL
302
307
313
318
324
TECHM
452
457
465
470
478
ULTRACEMCO
3,046
3,073
3,124
3,151
3,202
WIPRO
552
555
561
565
570
YESBANK
802
815
840
854
879
ZEEL
376
380
387
391
398
4
Technical & Derivatives Report
April 06, 2016
Research Team Tel: 022 - 39357800
For Technical Queries
For Derivatives Queries
DISCLAIMER
Angel Broking Private Limited (hereinafter referred to as “Angel”) is a registered Member of National Stock Exchange of India Limited,
Bombay Stock Exchange Limited and MCX Stock Exchange Limited. It is also registered as a Depository Participant with CDSL and
Portfolio Manager with SEBI. It also has registration with AMFI as a Mutual Fund Distributor. Angel Broking Private Limited is a
registered entity with SEBI for Research Analyst in terms of SEBI (Research Analyst) Regulations, 2014 vide registration number
INH000000164. Angel or its associates has not been debarred/ suspended by SEBI or any other regulatory authority for accessing
/dealing in securities Market. Angel or its associates including its relatives/analyst do not hold any financial interest/beneficial
ownership of more than 1% in the company covered by Analyst. Angel or its associates/analyst has not received any compensation /
managed or co-managed public offering of securities of the company covered by Analyst during the past twelve months. Angel/analyst
has not served as an officer, director or employee of company covered by Analyst and has not been engaged in market making activity
of the company covered by Analyst.
This document is solely for the personal information of the recipient, and must not be singularly used as the basis of any investment
decision. Nothing in this document should be construed as investment or financial advice. Each recipient of this document should
make such investigations as they deem necessary to arrive at an independent evaluation of an investment in the securities of the
companies referred to in this document (including the merits and risks involved), and should consult their own advisors to determine
the merits and risks of such an investment.
Reports based on technical and derivative analysis center on studying charts of a stock's price movement, outstanding positions and
trading volume, as opposed to focusing on a company's fundamentals and, as such, may not match with a report on a company's
fundamentals.
The information in this document has been printed on the basis of publicly available information, internal data and other reliable
sources believed to be true, but we do not represent that it is accurate or complete and it should not be relied on as such, as this
document is for general guidance only. Angel Broking Pvt. Limited or any of its affiliates/ group companies shall not be in any way
responsible for any loss or damage that may arise to any person from any inadvertent error in the information contained in this report.
Angel Broking Pvt. Limited has not independently verified all the information contained within this document. Accordingly, we cannot
testify, nor make any representation or warranty, express or implied, to the accuracy, contents or data contained within this document.
While Angel Broking Pvt. Limited endeavors to update on a reasonable basis the information discussed in this material, there may be
regulatory, compliance, or other reasons that prevent us from doing so.
This document is being supplied to you solely for your information, and its contents, information or data may not be reproduced,
redistributed or passed on, directly or indirectly.
Neither Angel Broking Pvt. Limited, nor its directors, employees or affiliates shall be liable for any loss or damage that may arise from
or in connection with the use of this information.
Note: Please refer to the important ‘Stock Holding Disclosure' report on the Angel website (Research Section). Also, please refer to the
latest update on respective stocks for the disclosure status in respect of those stocks. Angel Broking Pvt. Limited and its affiliates may
have investment positions in the stocks recommended in this report.
5