Technical & Derivatives Report
January 06, 2016
Sensex (25580) / Nifty (7785)
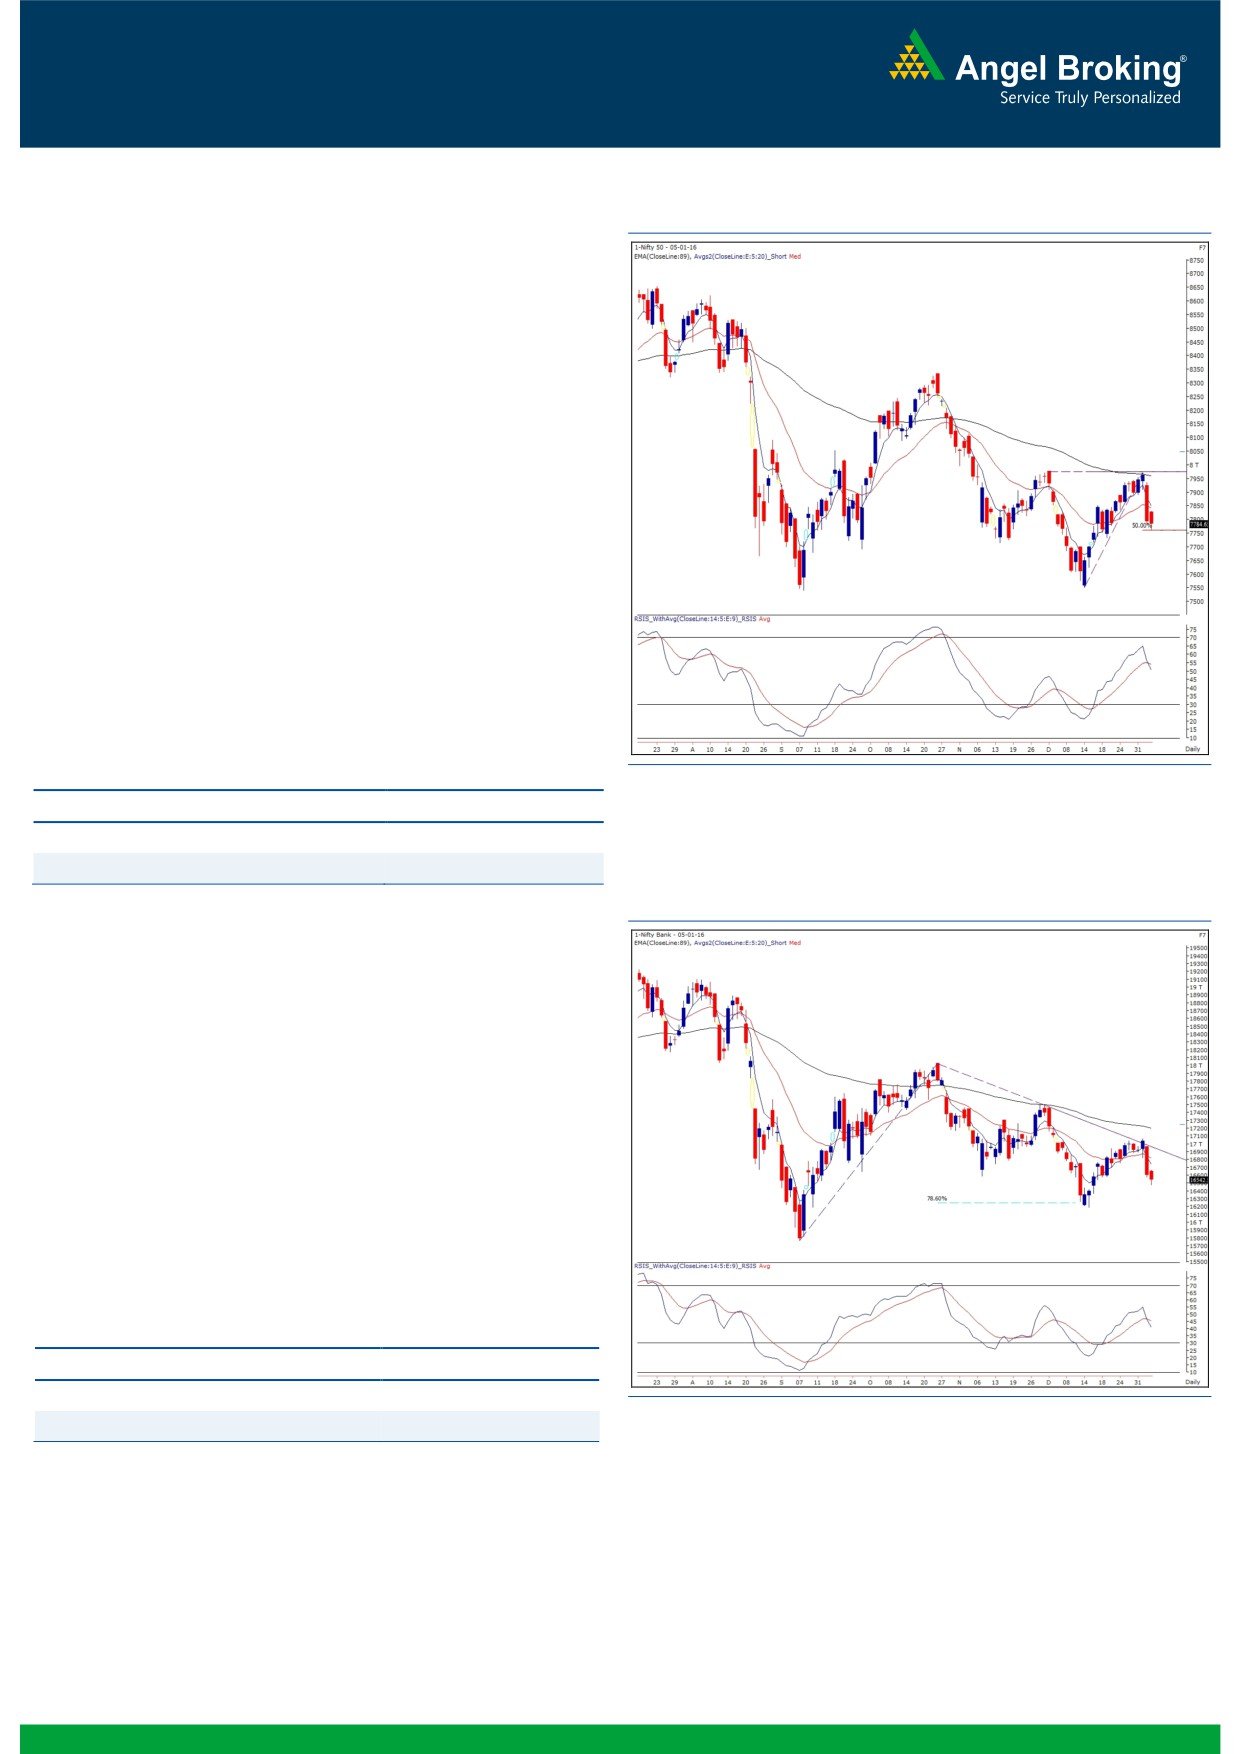
Exhibit 1: Nifty Daily Chart
Monday's massive single day correction was followed by a gap
up opening by a small margin on Tuesday. The index
remained under pressure for most part of the session as the
Chinese markets showed a follow through selling. However,
during the latter part of the day, we witnessed Nifty stabilizing
tad below the 7800 mark.
Fortunately, we did not see repetition of Monday's fall as the
index managed to find a support around the 50% Fibonacci
retracement of the recent up move. We reiterate that, we are
seeing a strong support zone around 7780 - 7750 levels. If
Nifty manages to hold this zone then we may witness an
immediate bounce towards 7850 - 7880 levels. However,
considering the uncertainty in major global bourses, it’s
advisable not to pre-empt any move. In case of an extended
sell off in global markets, we may see Nifty breaking this
mentioned support zone. Traders should stay light on positions
and avoid taking undue risks.
Key Levels
Support 1 - 7780
Resistance 1 - 7850
Support 2 - 7750
Resistance 2 - 7880
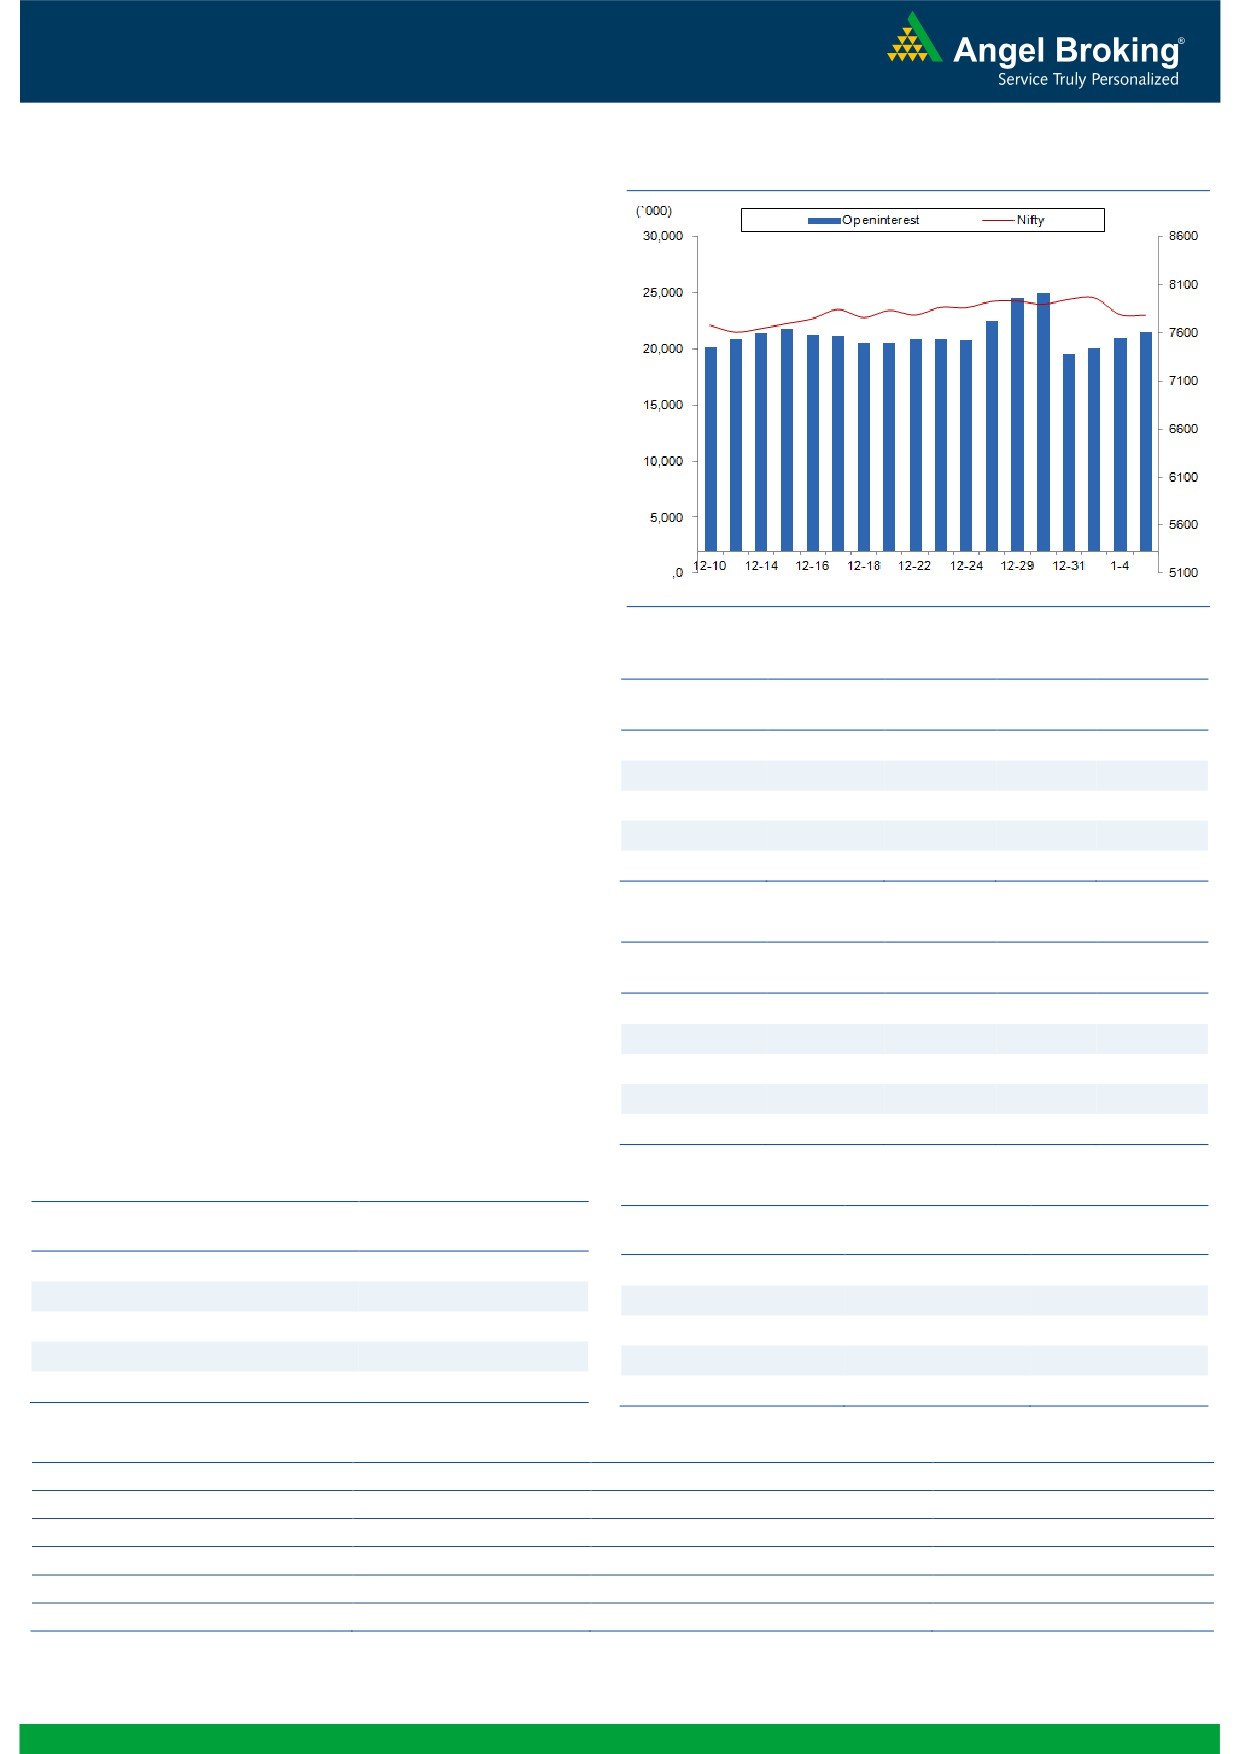
Exhibit 2: Bank Nifty Daily Chart
Bank Nifty Outlook - (16543)
The Nifty Bank index traded with a negative bias in yesterday's
trading session and ended the day with losses of 0.34%. The
Private sector index heavyweights are showing signs of
consolidation with negative bias whereas the PSU banking
space is continuously forming 'Lower Tops Lower Bottoms' with
no signs of reversal yet. We believe the near term weakness
would continue in the PSU space and hence one needs to keep
a stock specific approach within the sector. The immediate
support for the Nifty Bank index is placed around 16420 and
16200 and with the individual stocks showing weakness, the
index could test these support levels in near term. The
immediate resistance for the index is seen around 16800 and
16900.
Key Levels
Support 1 - 16420
Resistance 1 - 16800
Support 2 - 16200
Resistance 2 - 16900
1
Technical & Derivatives Report
January 06, 2016
Comments
Nifty Vs OI
The Nifty futures open interest has increased by 2.76%
BankNifty futures open interest has increased by 8.10%
as market closed at 7784.65 levels.
The Nifty January future closed at a premium of 18.10
points against a premium of 18.50 points. The February
series closed at a premium of 38.70 points.
The Implied Volatility of at the money options has
decreased from 16.02% to 15.51 %.
The total OI of the market is Rs. 2,00,431/- cr. and the
stock futures OI is Rs. 63,762/- cr.
Few of the liquid counters where we have seen high cost
of carry are AJANTPHARM, TATACOMM, JPASSOCIAT,
MARICO and UNITECH
OI Gainers
OI
PRICE
Views
SCRIP
OI
PRICE
CHG. (%)
CHG. (%)
In equity segment FIIs continue to sell to the tune of Rs.
JSWENERGY
10398000
48.63
85.55
-0.12
352 crores. In Index Futures they were marginal buyers
TORNTPHARM
326400
24.58
1443.85
-0.84
with good amount of rise in OI which suggest blend of
DLF
52350000
21.80
119.05
0.04
both long and short in last trading session.
CROMPGREAV
13743000
19.95
199.80
5.13
In Index Options front, they bought of worth Rs. 1163
IGL
2508000
19.50
557.20
6.74
crores with significant amount of rise in open interest.
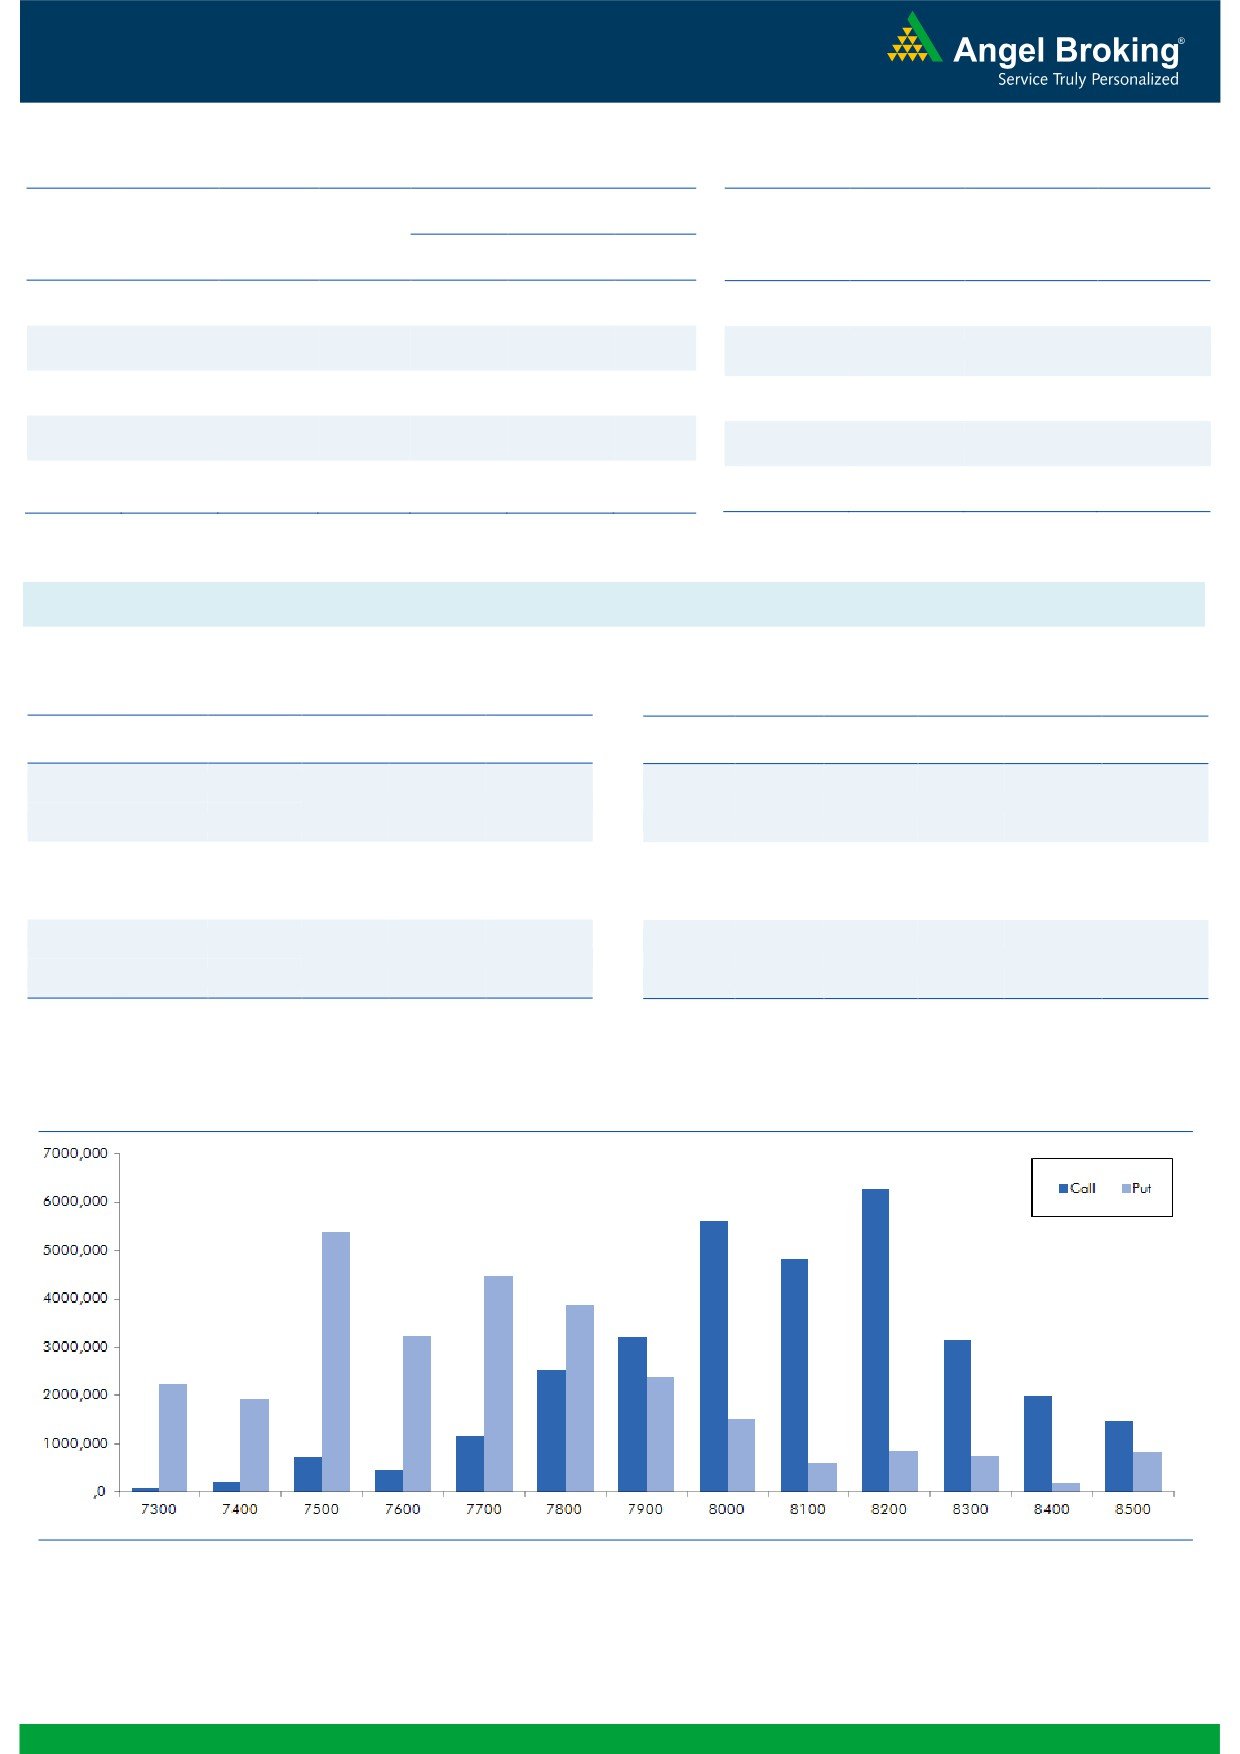
Yesterday we saw good amount of open interest addition
OI Losers
in both call and put options. 7900 - 8000 call options
OI
PRICE
and 7500 & 7700 put options added good amount of
SCRIP
OI
PRICE
CHG. (%)
CHG. (%)
build-up while implied volatility remained more or less
ABIRLANUVO
735750
-7.42
2289.15
5.88
inline. Nifty still has strong support around 7750-7800
ADANIENT
12456000
-5.55
89.00
4.22
levels, we would still suggest avoiding shorting in Nifty at
HINDUNILVR
3141000
-5.37
852.15
-1.06
current levels.
JUSTDIAL
1939500
-5.11
840.35
2.95
GODREJIND
1952600
-4.76
383.15
3.00
Historical Volatility
Put-Call Ratio
SCRIP
HV
SCRIP
PCR-OI
PCR-VOL
ABIRLANUVO
39.86
NIFTY
0.85
0.76
IGL
46.59
BANKNIFTY
1.04
0.93
SAIL
50.08
SBIN
0.46
0.51
HEXAWARE
40.55
LT
0.56
0.60
IOC
29.90
RELIANCE
0.68
0.64
Strategy Date
Symbol
Strategy
Status
January 04, 2016
SBIN
Ratio Bear Put Spread
Active
2
Technical & Derivatives Report
January 06, 2016
FII Statistics for 05-January 2015
Turnover on 05-January 2015
Open Interest
No. of
Turnover
Change
Detail
Buy
Sell
Net
Instrument
Value
Change
Contracts
( in Cr. )
(%)
Contracts
(in Cr.)
(%)
INDEX
INDEX
1725.60
1691.73
33.86
277197
15796.68
4.64
238417
13184.04
-32.28
FUTURES
FUTURES
INDEX
INDEX
20147.14
18983.29
1163.85
876196
50685.68
11.19
2219644
129470.61
-24.28
OPTIONS
OPTIONS
STOCK
3703.64
3882.20
(178.56)
1002845
49777.86
1.50
STOCK
FUTURES
531266
28568.30
-8.97
FUTURES
STOCK
STOCK
1829.16
1838.37
(9.21)
38905
1963.30
15.43
OPTIONS
247341
13875.77
-13.59
OPTIONS
TOTAL
27405.55
26395.60
1009.95
2195143
118223.52
5.81
TOTAL
3236671
185098.94
-22.19
Nifty Spot = 7784.65
Lot Size = 75
Bull-Call Spreads
Bear-Put Spreads
Action
Strike
Price
Risk
Reward
BEP
Action
Strike
Price
Risk
Reward
BEP
Buy
7800
122.35
Buy
7800
122.15
47.55
52.45
7847.55
36.85
63.15
7763.15
Sell
7900
74.80
Sell
7700
85.30
Buy
7800
122.35
Buy
7800
122.15
80.10
119.90
7880.10
64.35
135.65
7735.65
Sell
8000
42.25
Sell
7600
57.80
Buy
7900
74.80
Buy
7700
85.30
32.55
67.45
7932.55
27.50
72.50
7672.50
Sell
8000
42.25
Sell
7600
57.80
Note: Above mentioned Bullish or Bearish Spreads in Nifty (Jan. Series) are given as an information and not as a recommendation.
Nifty Put-Call Analysis
3
Technical & Derivatives Report
January 06, 2016
Daily Pivot Levels for Nifty 50 Stocks
Scrips
S2
S1
PIVOT
R1
R2
ACC
1,329
1,335
1,345
1,352
1,362
ADANIPORTS
251
253
257
259
263
AMBUJACEM
201
202
204
205
206
ASIANPAINT
872
886
896
910
919
AXISBANK
430
433
437
440
443
BAJAJ-AUTO
2,474
2,488
2,506
2,520
2,538
BANKBARODA
143
145
149
152
155
BHARTIARTL
317
320
324
328
332
BHEL
162
164
166
168
170
BOSCHLTD
18,286
18,460
18,745
18,918
19,204
BPCL
869
886
897
914
924
CAIRN
137
139
140
142
143
CIPLA
631
636
643
648
655
COALINDIA
319
322
328
331
336
DRREDDY
3,047
3,059
3,072
3,084
3,097
GAIL
357
364
369
377
382
GRASIM
3,594
3,627
3,659
3,692
3,724
HCLTECH
829
836
843
850
858
HDFC
1,190
1,199
1,216
1,226
1,243
HDFCBANK
1,053
1,058
1,066
1,071
1,080
HEROMOTOCO
2,582
2,600
2,627
2,645
2,673
HINDALCO
79
81
82
84
86
HINDUNILVR
837
843
851
856
864
ICICIBANK
250
253
255
259
261
IDEA
132
134
136
137
139
INDUSINDBK
924
930
938
944
952
INFY
1,051
1,062
1,074
1,086
1,097
ITC
323
324
325
326
327
KOTAKBANK
701
704
709
712
716
LT
1,243
1,250
1,259
1,266
1,276
LUPIN
1,749
1,766
1,790
1,807
1,830
M&M
1,221
1,235
1,254
1,268
1,286
MARUTI
4,531
4,549
4,575
4,593
4,618
NTPC
140
141
143
145
147
ONGC
237
239
242
244
247
PNB
108
109
111
113
115
POWERGRID
136
138
140
141
144
RELIANCE
991
998
1,004
1,011
1,017
SBIN
213
216
219
221
225
VEDL
87
90
92
95
97
SUNPHARMA
785
793
800
808
815
TATAMOTORS
366
370
376
381
387
TATAPOWER
67
68
70
71
72
TATASTEEL
251
262
269
281
288
TCS
2,313
2,331
2,359
2,377
2,404
TECHM
514
518
521
525
527
ULTRACEMCO
2,681
2,707
2,741
2,767
2,801
WIPRO
548
552
559
563
569
YESBANK
692
700
706
714
721
ZEEL
416
421
425
430
435
4
Technical & Derivatives Report
January 06, 2016
Research Team Tel: 022 - 39357800
For Technical Queries
For Derivatives Queries
DISCLAIMER
Angel Broking Private Limited (hereinafter referred to as “Angel”) is a registered Member of National Stock Exchange of India Limited,
Bombay Stock Exchange Limited and MCX Stock Exchange Limited. It is also registered as a Depository Participant with CDSL and
Portfolio Manager with SEBI. It also has registration with AMFI as a Mutual Fund Distributor. Angel Broking Private Limited is a
registered entity with SEBI for Research Analyst in terms of SEBI (Research Analyst) Regulations, 2014 vide registration number
INH000000164. Angel or its associates has not been debarred/ suspended by SEBI or any other regulatory authority for accessing
/dealing in securities Market. Angel or its associates including its relatives/analyst do not hold any financial interest/beneficial
ownership of more than 1% in the company covered by Analyst. Angel or its associates/analyst has not received any compensation /
managed or co-managed public offering of securities of the company covered by Analyst during the past twelve months. Angel/analyst
has not served as an officer, director or employee of company covered by Analyst and has not been engaged in market making activity
of the company covered by Analyst.
This document is solely for the personal information of the recipient, and must not be singularly used as the basis of any investment
decision. Nothing in this document should be construed as investment or financial advice. Each recipient of this document should
make such investigations as they deem necessary to arrive at an independent evaluation of an investment in the securities of the
companies referred to in this document (including the merits and risks involved), and should consult their own advisors to determine
the merits and risks of such an investment.
Reports based on technical and derivative analysis center on studying charts of a stock's price movement, outstanding positions and
trading volume, as opposed to focusing on a company's fundamentals and, as such, may not match with a report on a company's
fundamentals.
The information in this document has been printed on the basis of publicly available information, internal data and other reliable
sources believed to be true, but we do not represent that it is accurate or complete and it should not be relied on as such, as this
document is for general guidance only. Angel Broking Pvt. Limited or any of its affiliates/ group companies shall not be in any way
responsible for any loss or damage that may arise to any person from any inadvertent error in the information contained in this report.
Angel Broking Pvt. Limited has not independently verified all the information contained within this document. Accordingly, we cannot
testify, nor make any representation or warranty, express or implied, to the accuracy, contents or data contained within this document.
While Angel Broking Pvt. Limited endeavors to update on a reasonable basis the information discussed in this material, there may be
regulatory, compliance, or other reasons that prevent us from doing so.
This document is being supplied to you solely for your information, and its contents, information or data may not be reproduced,
redistributed or passed on, directly or indirectly.
Neither Angel Broking Pvt. Limited, nor its directors, employees or affiliates shall be liable for any loss or damage that may arise from
or in connection with the use of this information.
Note: Please refer to the important ‘Stock Holding Disclosure' report on the Angel website (Research Section). Also, please refer to the
latest update on respective stocks for the disclosure status in respect of those stocks. Angel Broking Pvt. Limited and its affiliates may
have investment positions in the stocks recommended in this report.
5