Technical & Derivatives Report
July 05, 2016
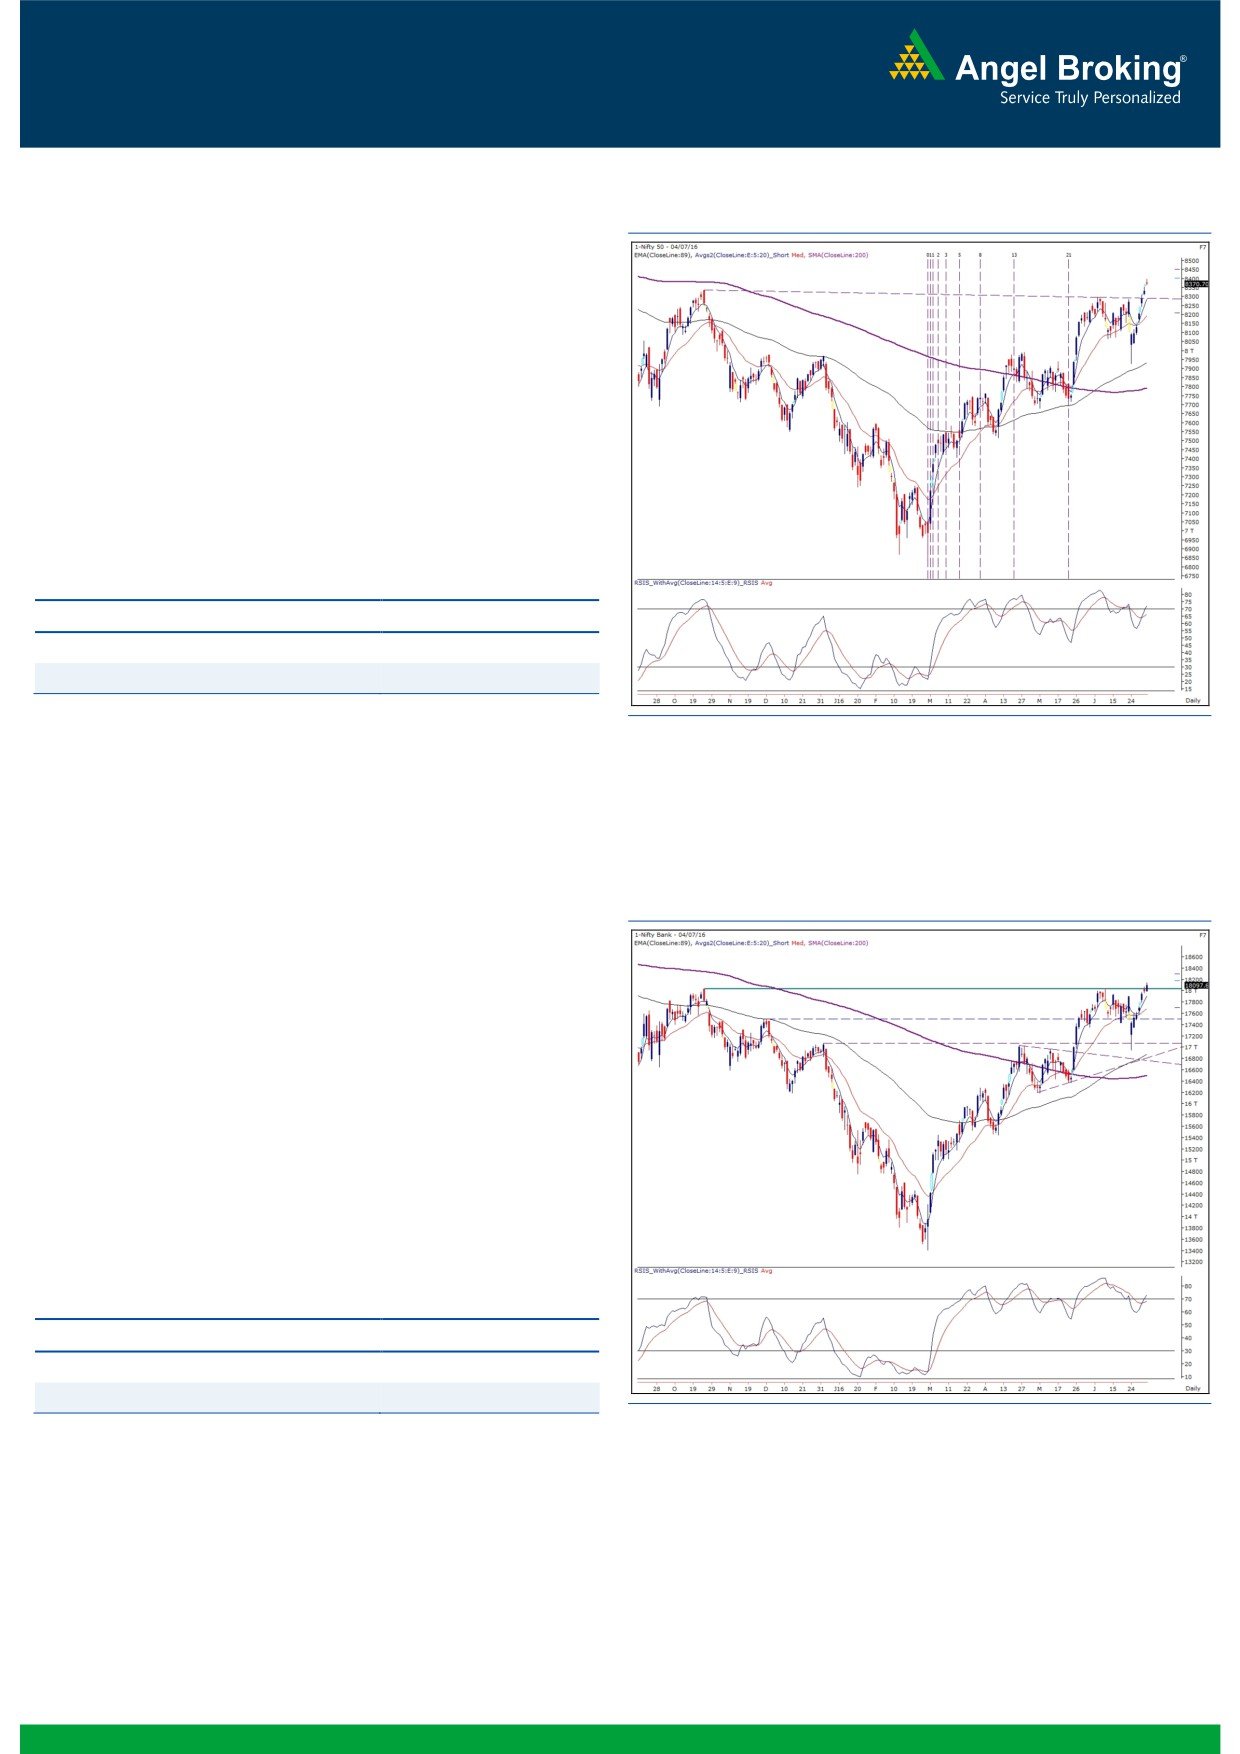
Exhibit 1: Nifty Daily Chart
Sensex (27279) / Nifty (8371)
We have seen a series of gap up opening since last five sessions.
However, unlike previous sessions, the Nifty remained subdued
throughout the session to close with half a percent gains.
After such a v-shaped recovery, it was quite evident to take a
pause and Nifty has done similar yesterday. We expect this
consolidation to continue and in fact, an intraday dip towards
8340 - 8320 could be a buying opportunity. Hence, traders are
advised not create any short positions for minor correction and
stay with the trend. The next resistance would be seen at 8400 -
8450 and support at 8290 - 8250 levels.
Key Levels
Support 1 - 8340
Resistance 1 - 8400
Support 2 - 8320
Resistance 2 - 8450
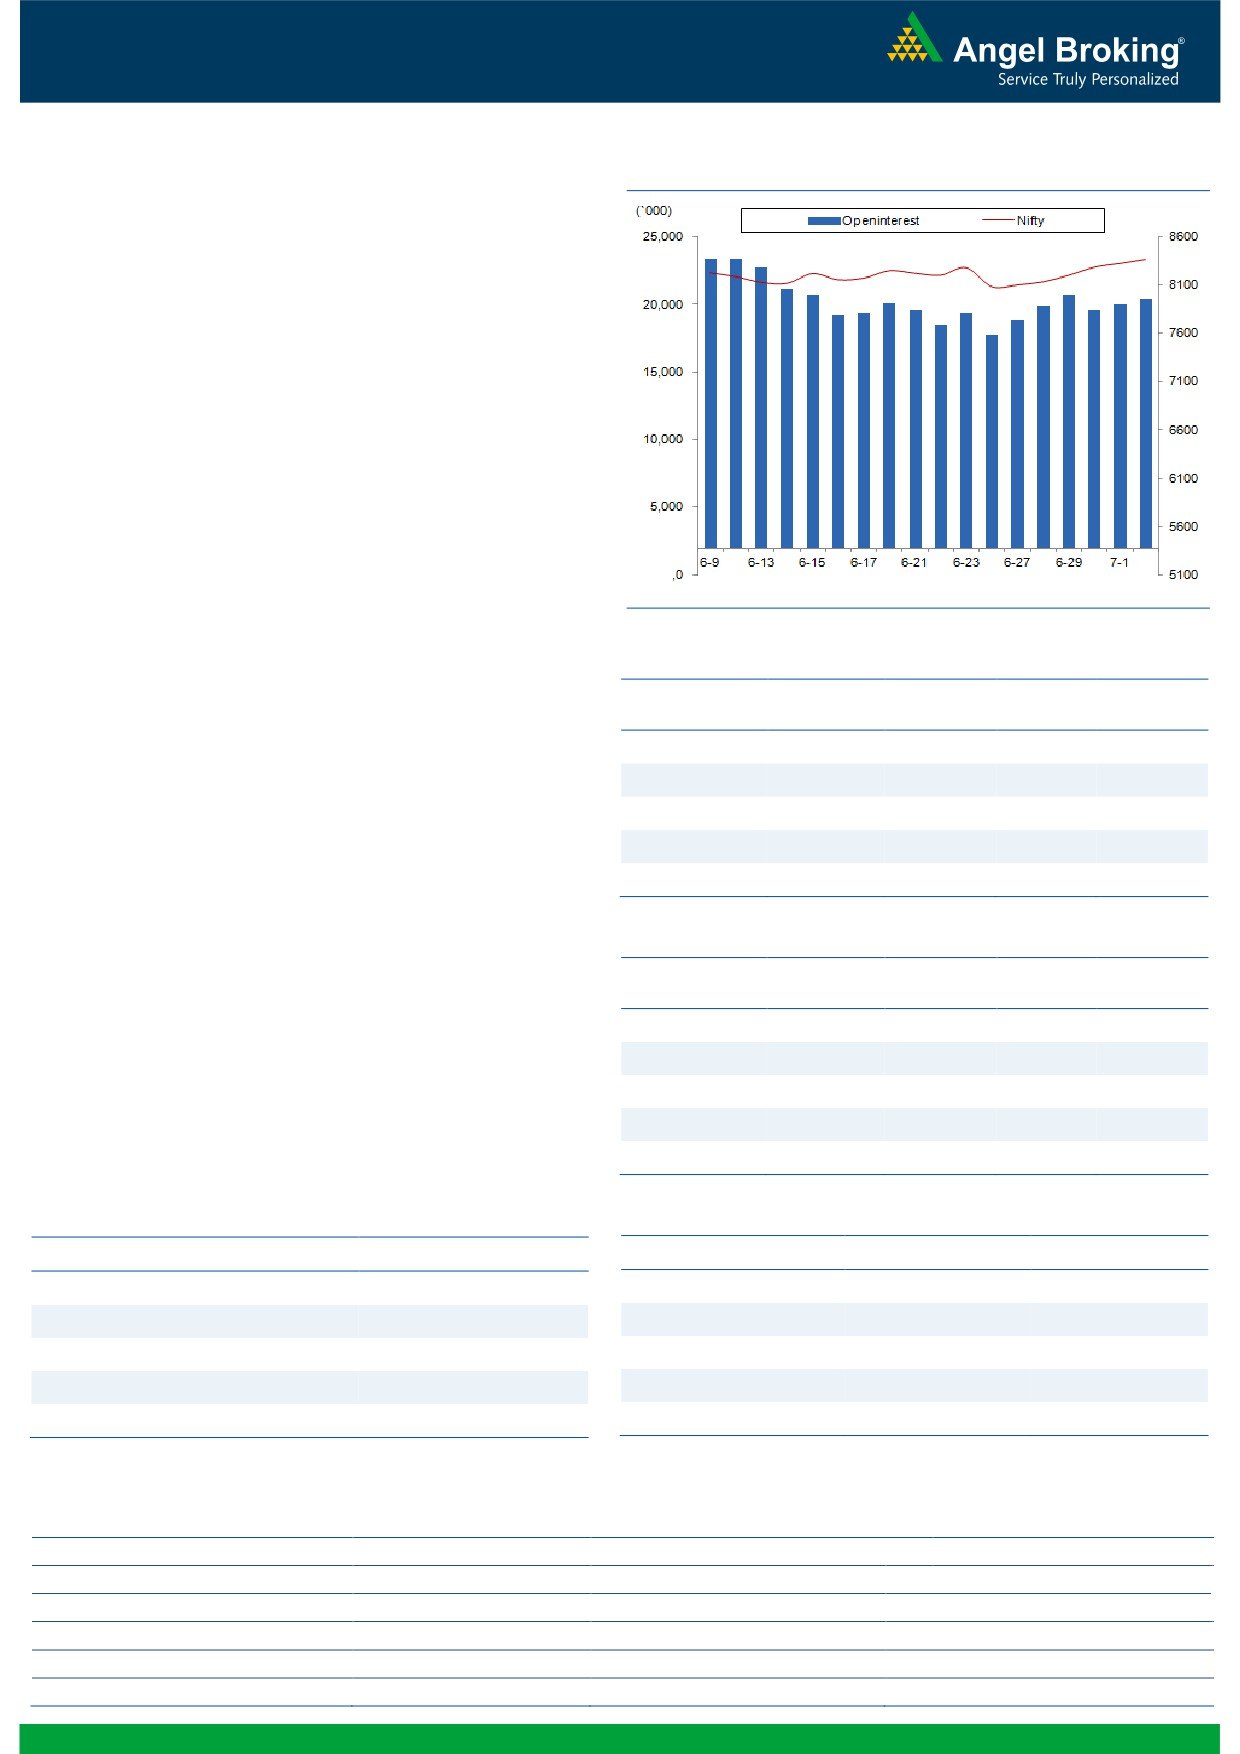
Exhibit 2: Nifty Bank Daily Chart
Nifty Bank Outlook - (18098)
In yesterday's trading session, the Nifty Bank index opened higher
on back of the ongoing positive momentum. However, in the rest
of the session, the index traded range bound and ended the day
with gains of 0.62%.
Although the index traded in a narrow range post gap up
opening, the stock specific moves gave good trading
opportunities to trade with positive bias. With no signs of reversal
on the charts, we continue to advise short term traders to trade
with positive bias. The near term support for the index is placed
around 17940 and 17975 whereas resistances are seen around
18200 and 18350.
Key Levels
Support 1 - 17940
Resistance 1 - 18200
Support 2 - 17975
Resistance 2 - 18350
1
Technical & Derivatives Report
July 05, 2016
Comments
Nifty Vs OI
The Nifty futures open interest has increased by 1.85%
BankNifty futures open interest has increased by 6.05%
as market closed at 8370.70 levels.
The Nifty July future closed with a premium of 16.65
points against a premium of 26.80 points in previous
session. The August series closed at a premium of 49.30
points.
The Implied Volatility of at the money options has
decreased from 14.36% to 14.13%.
The total OI of the market is Rs. 2,04,998/- cr. and the
stock futures OI is Rs. 62,634/- cr.
Few of the liquid counters where we have seen high cost
of carry are UNITECH, JPASSOCIAT, IDFC, SOUTHBANK
and NHPC.
Views
OI Gainers
FIIs were net buyers in both cash market segment and in
OI
PRICE
SCRIP
OI
PRICE
Index Futures. They bought equities to the tune of Rs. 182
CHG. (%)
CHG. (%)
crores. While in Index Futures, they were marginal buyers
HINDZINC
5369600
34.67
186.05
4.35
with good amount of rise in open interest, indicating
SINTEX
7756000
22.57
85.55
1.36
blend of long and short positions in previous trading
NIITTECH
384000
18.89
519.55
1.19
session.
NHPC
24408000
18.32
26.00
3.38
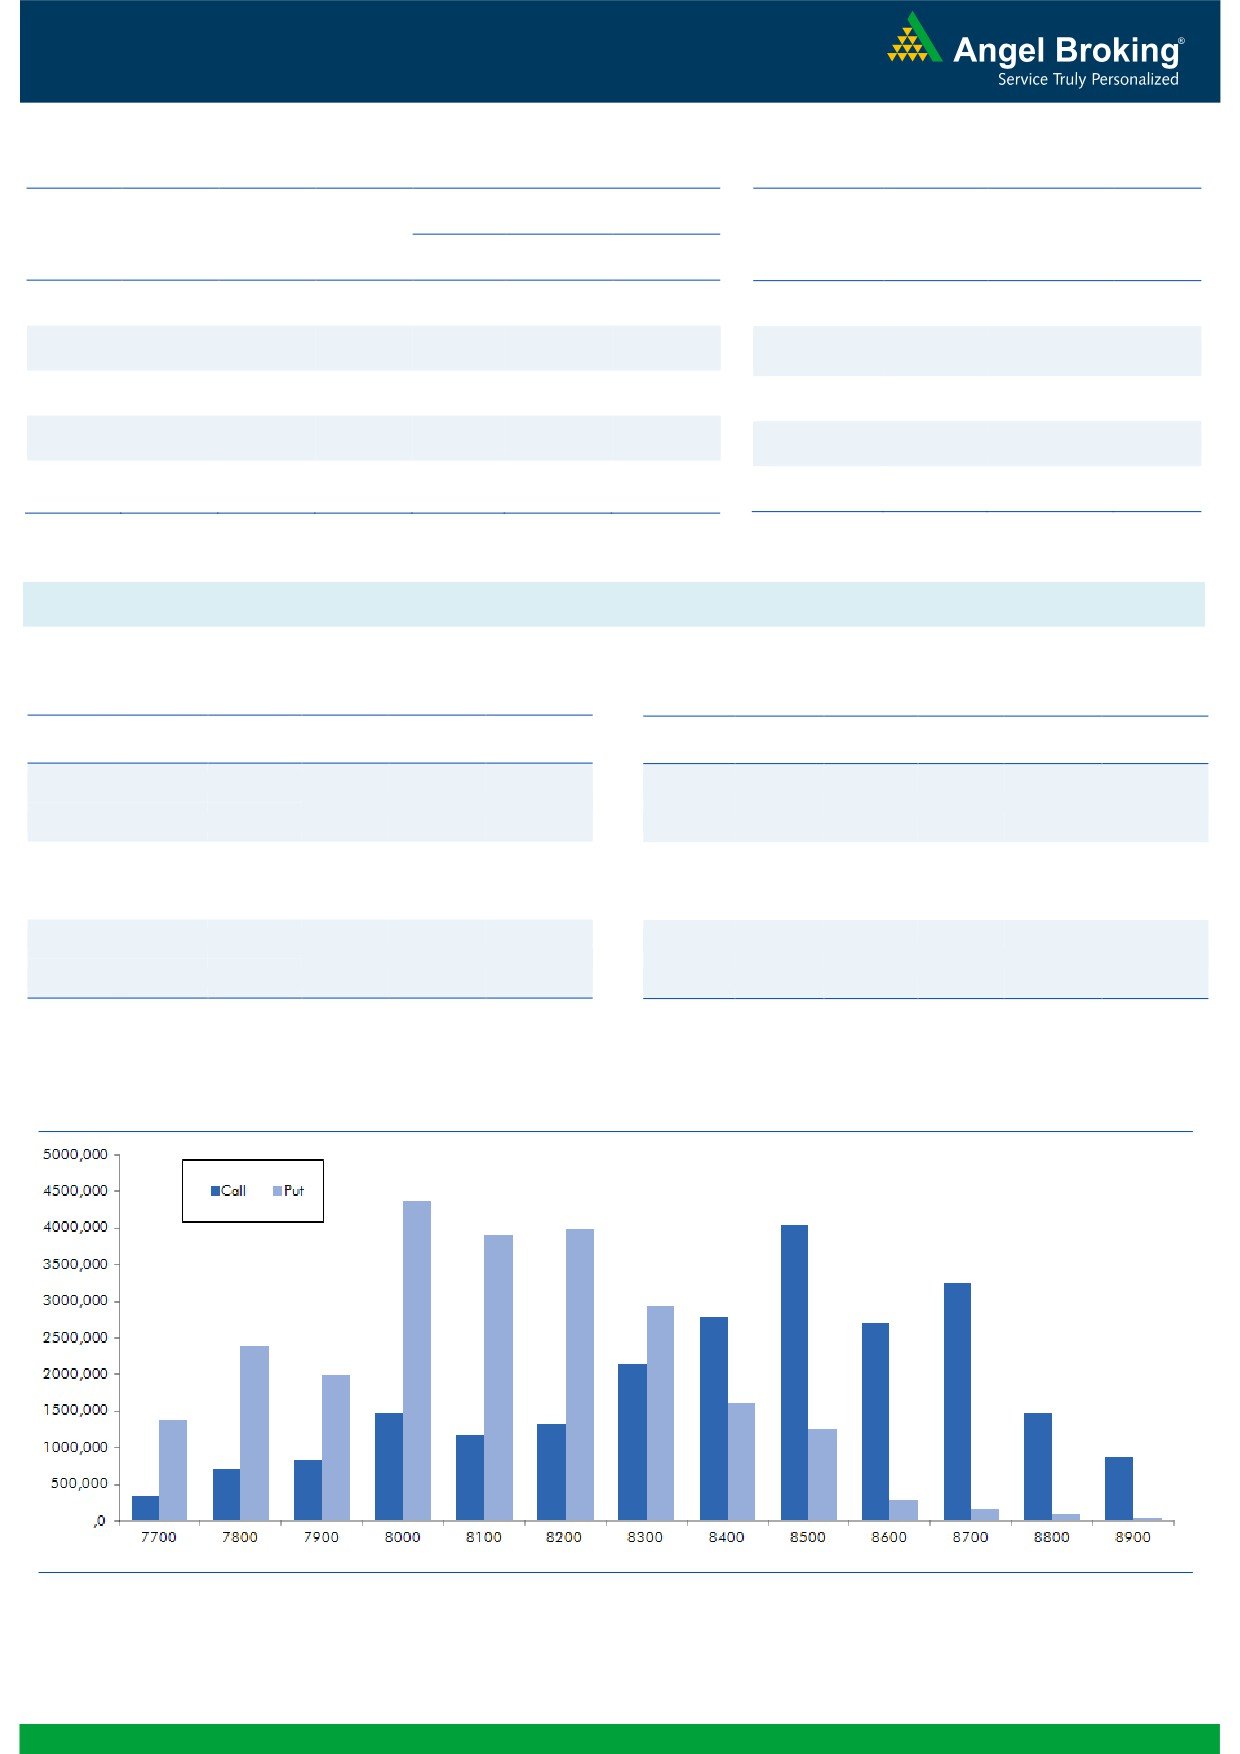
On Index Options front, FIIs bought worth Rs. 733 crores
GODREJCP
431600
18.31
1642.00
0.82
with rise in open interest. In Call options, some OI
addition was seen in 8600 strike. On the other hand in
Put options,
8100-8400 strikes added huge fresh
OI Losers
positions. Maximum open interest in current series is
OI
PRICE
SCRIP
OI
PRICE
CHG. (%)
CHG. (%)
placed at 8500 call and 8000 put strikes.
OIL
863600
-9.77
374.50
2.06
Since, FIIs are continuously buying in index futures; we
HCLTECH
6846700
-6.36
750.00
2.22
are expecting Nifty to continue its upward momentum in
upcoming sessions too. Hence, traders are advised to
ENGINERSIN
2415000
-5.99
211.30
0.40
trade with positive bias.
BOSCHLTD
81800
-5.60
22299.90
-2.00
INFY
10343000
-4.93
1187.00
0.74
Historical Volatility
Put-Call Ratio
SCRIP
HV
SCRIP
PCR-OI
PCR-VOL
ALBK
63.79
NIFTY
1.04
1.06
PNB
55.50
BANKNIFTY
1.34
1.05
MRF
34.38
SBIN
0.69
0.54
SYNDIBANK
49.53
RELIANCE
0.49
0.30
IDBI
48.18
SUNPHARMA
0.37
0.31
Strategy Date
Symbol
Strategy
Status
04-07-2016
RCOM
Ratio Bull Call Spread
Active
2
Technical & Derivatives Report
July 05, 2016
FII Statistics for 04-July 2016
Turnover on 04-July 2016
Open Interest
No. of
Turnover
Change
Detail
Buy
Sell
Net
Instrument
Value
Contracts
( in Cr. )
(%)
Contracts
Change (%)
(in Cr.)
INDEX
INDEX
1309.90
1234.18
75.72
230103
14740.32
3.96
162231
10701.66
-13.29
FUTURES
FUTURES
INDEX
INDEX
16941.29
16207.84
733.44
753058
47431.52
6.64
1819968
119696.72
2.13
OPTIONS
OPTIONS
STOCK
4593.34
4090.16
503.18
768187
48266.22
0.84
STOCK
FUTURES
491361
31951.74
-2.12
FUTURES
STOCK
STOCK
2312.83
2322.65
(9.82)
29814
1916.28
59.60
OPTIONS
231260
15502.41
8.45
OPTIONS
TOTAL
25157.36
23854.83
1302.53
1781162
112354.34
4.29
TOTAL
2704820
177852.53
0.77
Nifty Spot = 8370.70
Lot Size = 75
Bull-Call Spreads
Bear-Put Spreads
Action
Strike
Price
Risk
Reward
BEP
Action
Strike
Price
Risk
Reward
BEP
Buy
8400
113.25
Buy
8300
89.95
46.30
53.70
8446.30
27.90
72.10
8272.10
Sell
8500
66.95
Sell
8200
62.05
Buy
8400
113.25
Buy
8300
89.95
77.15
122.85
8477.15
47.10
152.90
8252.90
Sell
8600
36.10
Sell
8100
42.85
Buy
8500
66.95
Buy
8200
62.05
30.85
69.15
8530.85
19.20
80.80
8180.80
Sell
8600
36.10
Sell
8100
42.85
Note: Above mentioned Bullish or Bearish Spreads in Nifty (July Series) are given as an information and not as a recommendation.
Nifty Put-Call Analysis
3
Technical & Derivatives Report
July 05, 2016
Daily Pivot Levels for Nifty Constituents
Scrips
S2
S1
PIVOT
R1
R2
ACC
1,585
1,595
1,611
1,621
1,636
ADANIPORTS
202
208
211
216
219
AMBUJACEM
250
252
254
255
257
ASIANPAINT
986
993
1,005
1,012
1,024
AUROPHARMA
744
751
757
763
769
AXISBANK
536
540
543
547
551
BAJAJ-AUTO
2,618
2,635
2,663
2,680
2,708
BANKBARODA
155
158
160
162
164
BHEL
131
135
137
140
142
BPCL
1,089
1,097
1,104
1,112
1,119
BHARTIARTL
366
370
373
377
380
INFRATEL
348
351
355
359
363
BOSCH
22,000
22,124
22,250
22,374
22,500
CIPLA
505
508
511
513
516
COALINDIA
309
313
316
321
324
DRREDDY
3,330
3,383
3,471
3,523
3,611
EICHERMOT
19,071
19,281
19,461
19,671
19,851
GAIL
387
391
397
401
407
GRASIM
4,506
4,543
4,606
4,644
4,707
HCLTECH
728
738
744
754
760
HDFCBANK
1,166
1,170
1,175
1,178
1,183
HDFC
1,237
1,247
1,256
1,266
1,276
HEROMOTOCO
3,118
3,139
3,164
3,185
3,211
HINDALCO
125
125
126
127
127
HINDUNILVR
880
886
895
901
909
ICICIBANK
239
244
246
251
253
IDEA
104
105
107
108
109
INDUSINDBK
1,091
1,099
1,113
1,121
1,134
INFY
1,167
1,176
1,185
1,194
1,204
ITC
238
241
248
251
258
KOTAKBANK
732
738
747
753
762
LT
1,536
1,552
1,564
1,581
1,593
LUPIN
1,546
1,558
1,566
1,578
1,586
M&M
1,440
1,453
1,465
1,478
1,490
MARUTI
4,139
4,156
4,173
4,191
4,208
NTPC
152
154
156
158
160
ONGC
226
229
232
235
238
POWERGRID
163
164
166
167
168
RELIANCE
967
977
985
995
1,003
SBIN
221
222
223
224
225
SUNPHARMA
762
766
771
775
779
TCS
2,457
2,476
2,501
2,519
2,545
TATAMTRDVR
292
298
301
307
310
TATAMOTORS
463
466
470
474
478
TATAPOWER
74
74
75
75
76
TATASTEEL
325
328
331
334
337
TECHM
504
512
518
525
531
ULTRACEMCO
3,356
3,383
3,429
3,455
3,502
WIPRO
557
559
562
564
567
YESBANK
1,099
1,108
1,124
1,133
1,149
ZEEL
448
455
459
466
471
4
Technical & Derivatives Report
July 05, 2016
Research Team Tel: 022 - 39357800
For Technical Queries
For Derivatives Queries
DISCLAIMER
Angel Broking Private Limited (hereinafter referred to as “Angel”) is a registered Member of National Stock Exchange of India Limited,
Bombay Stock Exchange Limited and MCX Stock Exchange Limited. It is also registered as a Depository Participant with CDSL and
Portfolio Manager with SEBI. It also has registration with AMFI as a Mutual Fund Distributor. Angel Broking Private Limited is a
registered entity with SEBI for Research Analyst in terms of SEBI (Research Analyst) Regulations, 2014 vide registration number
INH000000164. Angel or its associates has not been debarred/ suspended by SEBI or any other regulatory authority for accessing
/dealing in securities Market. Angel or its associates including its relatives/analyst do not hold any financial interest/beneficial
ownership of more than 1% in the company covered by Analyst. Angel or its associates/analyst has not received any compensation /
managed or co-managed public offering of securities of the company covered by Analyst during the past twelve months. Angel/analyst
has not served as an officer, director or employee of company covered by Analyst and has not been engaged in market making activity
of the company covered by Analyst.
This document is solely for the personal information of the recipient, and must not be singularly used as the basis of any investment
decision. Nothing in this document should be construed as investment or financial advice. Each recipient of this document should
make such investigations as they deem necessary to arrive at an independent evaluation of an investment in the securities of the
companies referred to in this document (including the merits and risks involved), and should consult their own advisors to determine
the merits and risks of such an investment.
Reports based on technical and derivative analysis center on studying charts of a stock's price movement, outstanding positions and
trading volume, as opposed to focusing on a company's fundamentals and, as such, may not match with a report on a company's
fundamentals.
The information in this document has been printed on the basis of publicly available information, internal data and other reliable
sources believed to be true, but we do not represent that it is accurate or complete and it should not be relied on as such, as this
document is for general guidance only. Angel Broking Pvt. Limited or any of its affiliates/ group companies shall not be in any way
responsible for any loss or damage that may arise to any person from any inadvertent error in the information contained in this report.
Angel Broking Pvt. Limited has not independently verified all the information contained within this document. Accordingly, we cannot
testify, nor make any representation or warranty, express or implied, to the accuracy, contents or data contained within this document.
While Angel Broking Pvt. Limited endeavors to update on a reasonable basis the information discussed in this material, there may be
regulatory, compliance, or other reasons that prevent us from doing so.
This document is being supplied to you solely for your information, and its contents, information or data may not be reproduced,
redistributed or passed on, directly or indirectly.
Neither Angel Broking Pvt. Limited, nor its directors, employees or affiliates shall be liable for any loss or damage that may arise from
or in connection with the use of this information.
Note: Please refer to the important ‘Stock Holding Disclosure' report on the Angel website (Research Section). Also, please refer to the
latest update on respective stocks for the disclosure status in respect of those stocks. Angel Broking Pvt. Limited and its affiliates may
have investment positions in the stocks recommended in this report.
5