October 05, 2015
Sensex (26221) / Nifty (7951)
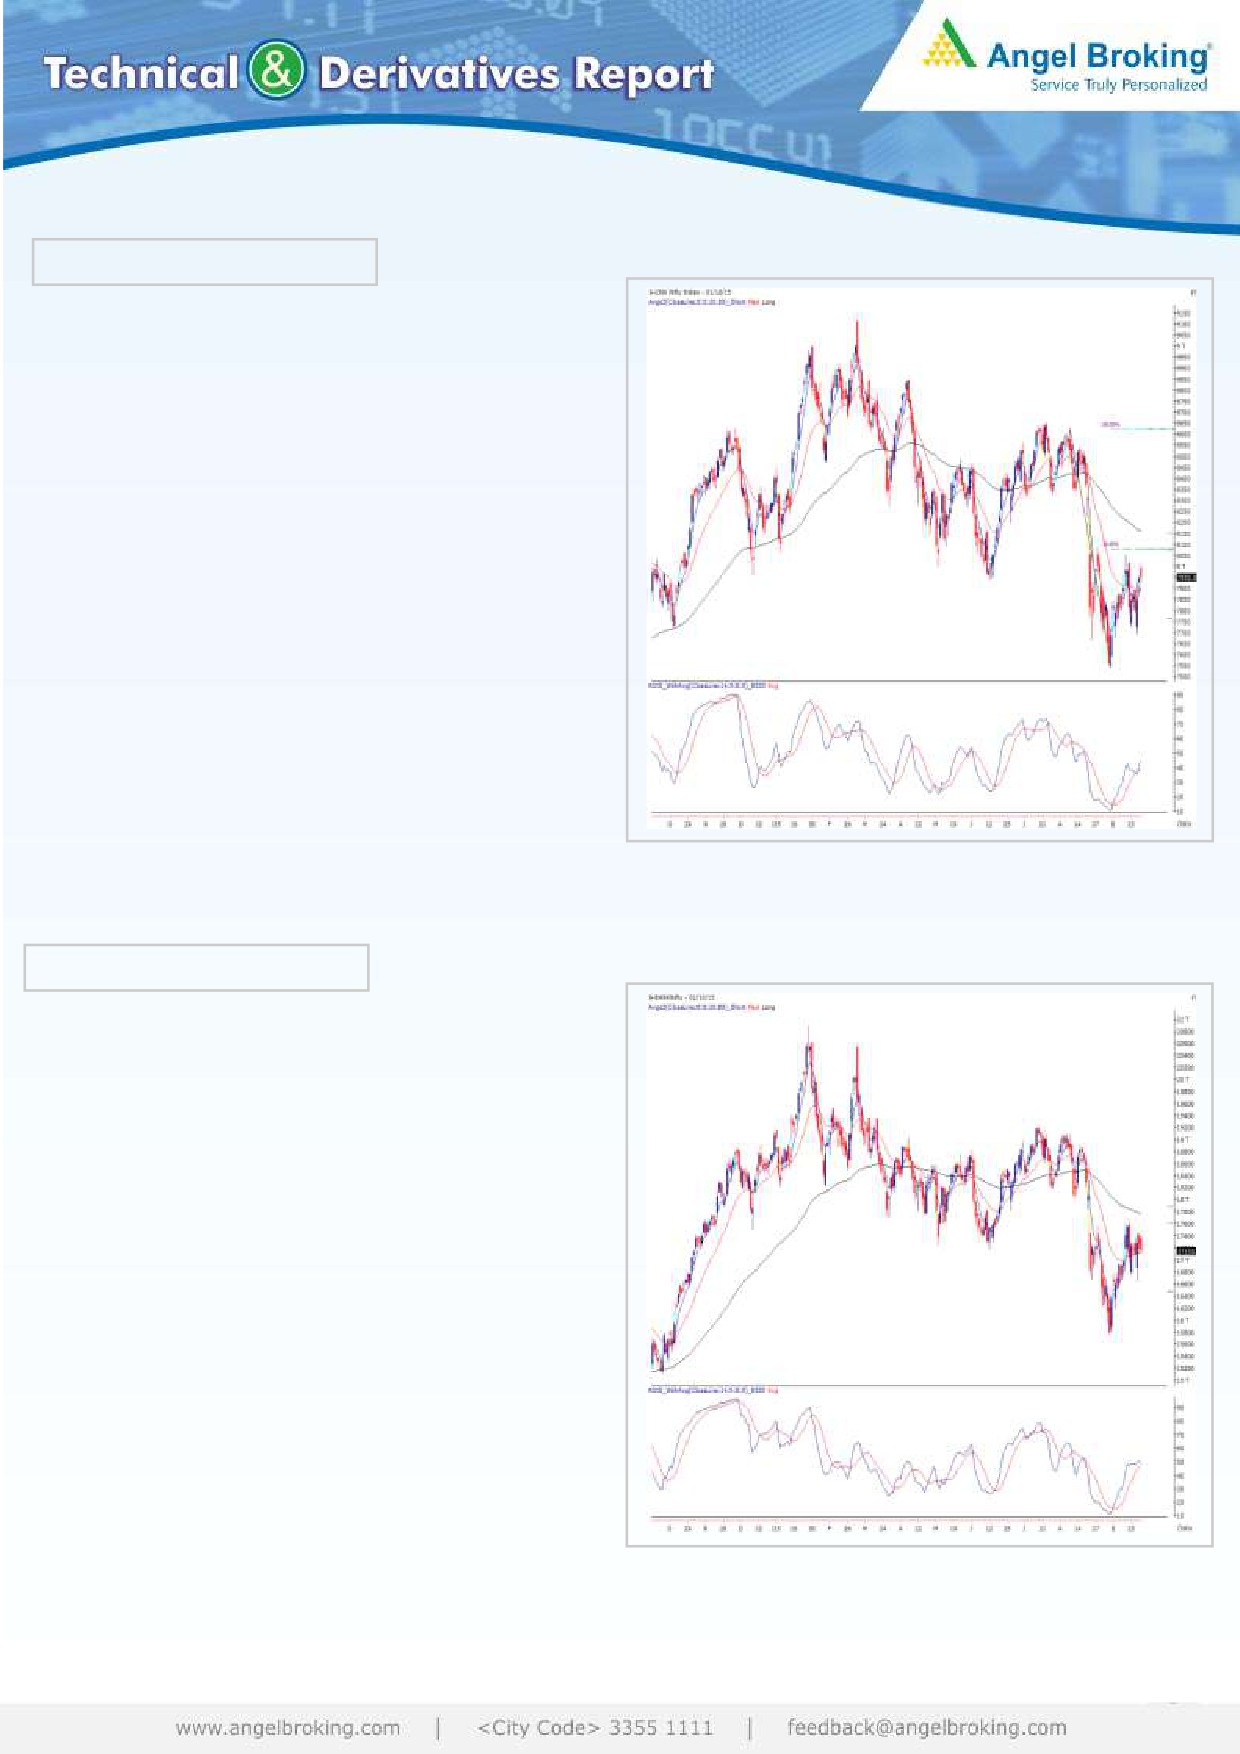
Exhibit 1: Nifty Daily Chart
The concluded week witnessed volatility owing to RBI monetary
policy and ongoing global uncertainty. The price action of last
month has led to the formation of an ‘Inverted Head & Shoulders’
pattern on the daily charts. The said pattern is a trend reversal
pattern which possibly implies positive momentum, but that would
be the case only if the Nifty sustains above the neckline resistance
of 8055. However, if we observe the higher degree weekly chart,
the Nifty had earlier formed a broader ‘Head & Shoulders’
pattern from which it had given a breakdown in the last week of
August. The ongoing up move thus seems to be just a pullback
move if traced on the basis of the weekly charts. Also, the recent
up move in the Nifty from the lows of 7539.50 does not show any
‘Impulsive’ characteristics and thus we believe that it is just a
pullback rally within the corrective downtrend. Thus, 8055 seems
to be a trend deciding level for the near term, and until the same
is crossed, traders should trade in line with the broader trend and
should be vigilant to create aggressive long positions. The failure
of the ‘Inverted Head & Shoulders’ pattern and resumption of the
corrective move could be catastrophic and the Nifty could then
move lower towards 7650-7700 levels in the near term. However,
if the Nifty crosses 8055 in the week ahead, then it can possibly
move upto its next resistance zone which is seen around 8157
(89EMA on daily charts) to 8225 (higher end of the gap area of
24 August 2015).
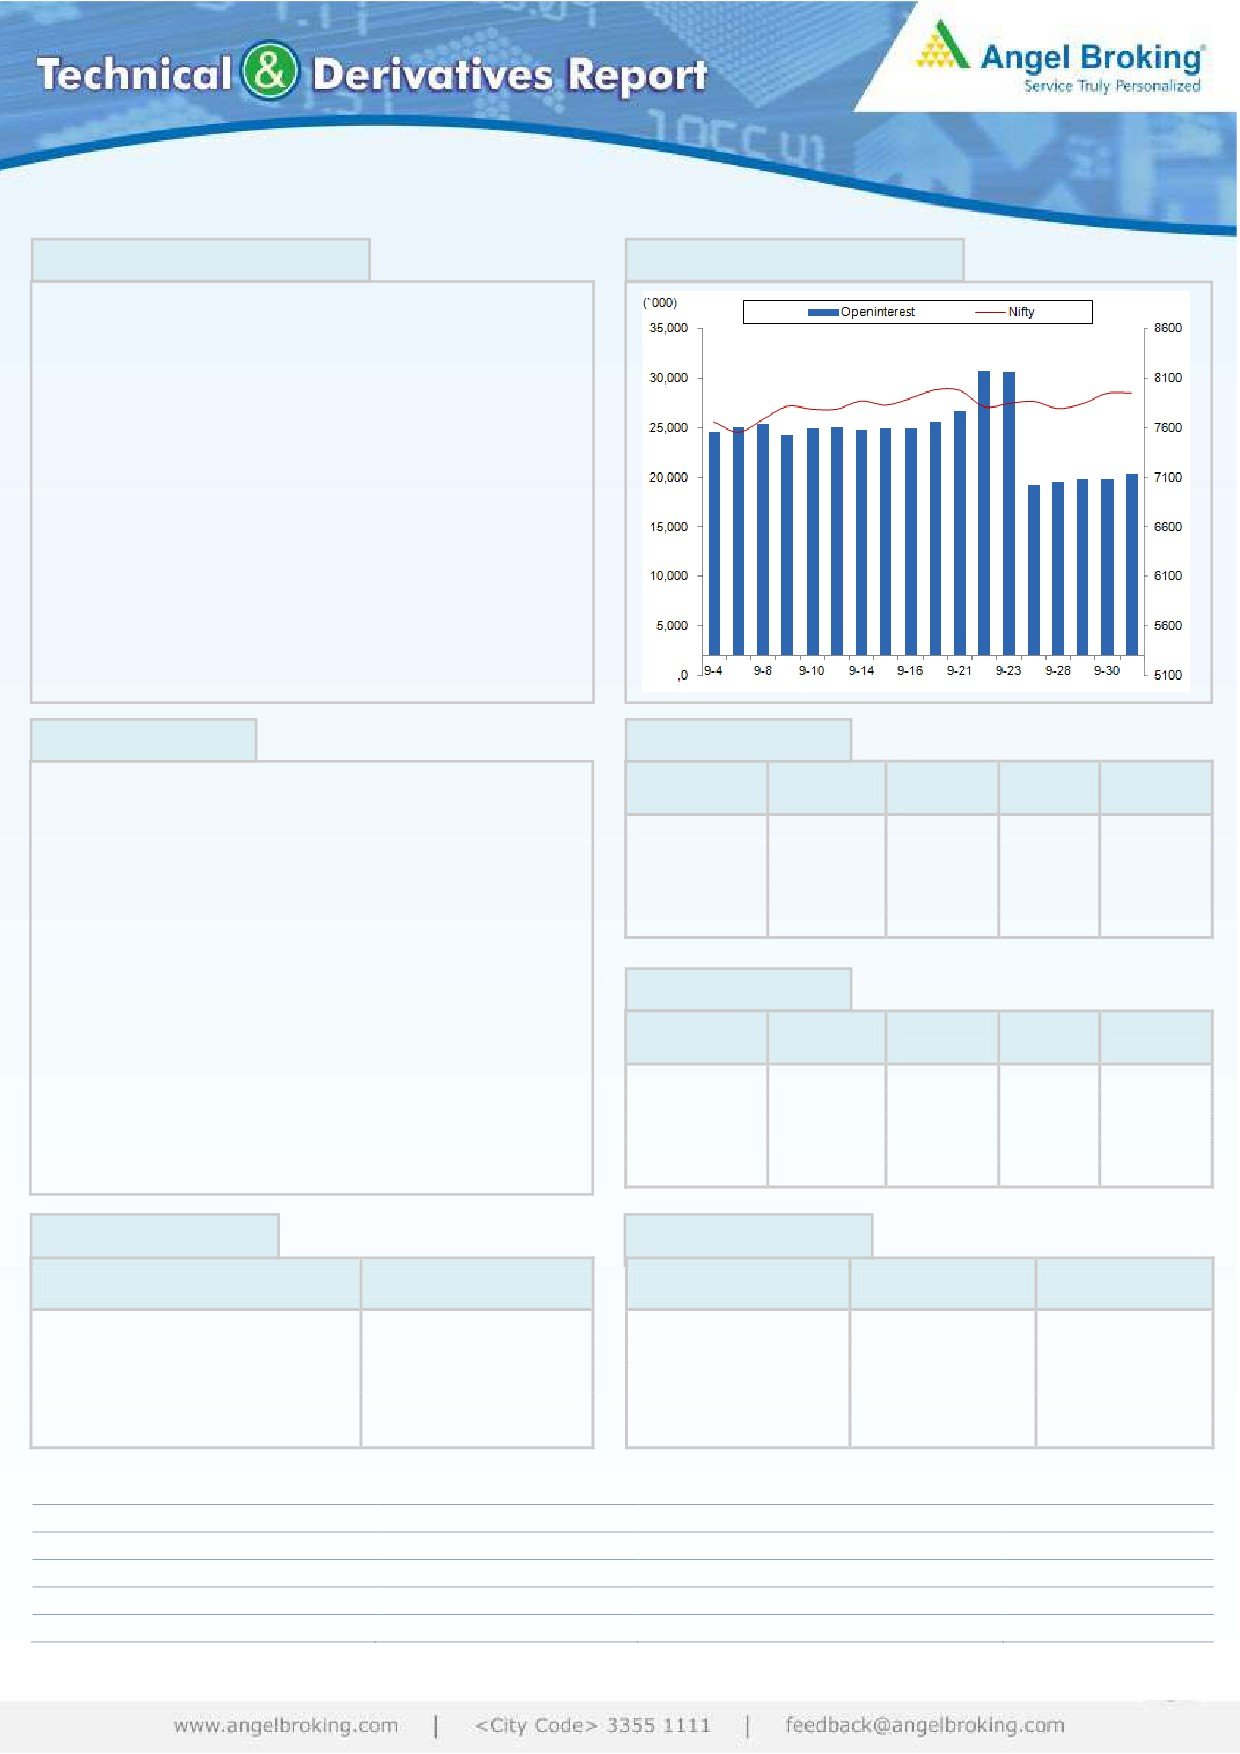
Bank Nifty Outlook - (17150)
Exhibit 2: Bank Nifty Daily Chart
On Thursday, the Bank Nifty started the session with the gains of
more than 140 points in-line with the benchmark indices. But,
once again, the upside gap was not sustainable as the banking
index started falling from the initial trades. The Bank Nifty
continued to make lower lows throughout the sessions and traded
within the range of Wednesday’s trading boundaries. Eventually,
the Bank Nifty ended the concluding session of the week with the
loss of 0.38 percent over its previous close. The lack of positive
momentum post the positive outcome from monetary policy
doesn’t bode well for bulls. Since, the chart structure remains the
same; we continue to maintain our negative stance on the index.
At current juncture, the Bank Nifty is taking support around the
’89 EMA’ in the hourly chart; thus, a minor pull back rally in near
term cannot be ruled out. We advise traders to not get carried
away with the intraday bounces and avoid going aggressive longs
at current levels. Going forward, the Bank Nifty has strong
support at 16960 and 16820 levels; whereas, the immediate
resistance is placed at 17465 and 17655 levels.
1
October 05, 2015
Comments
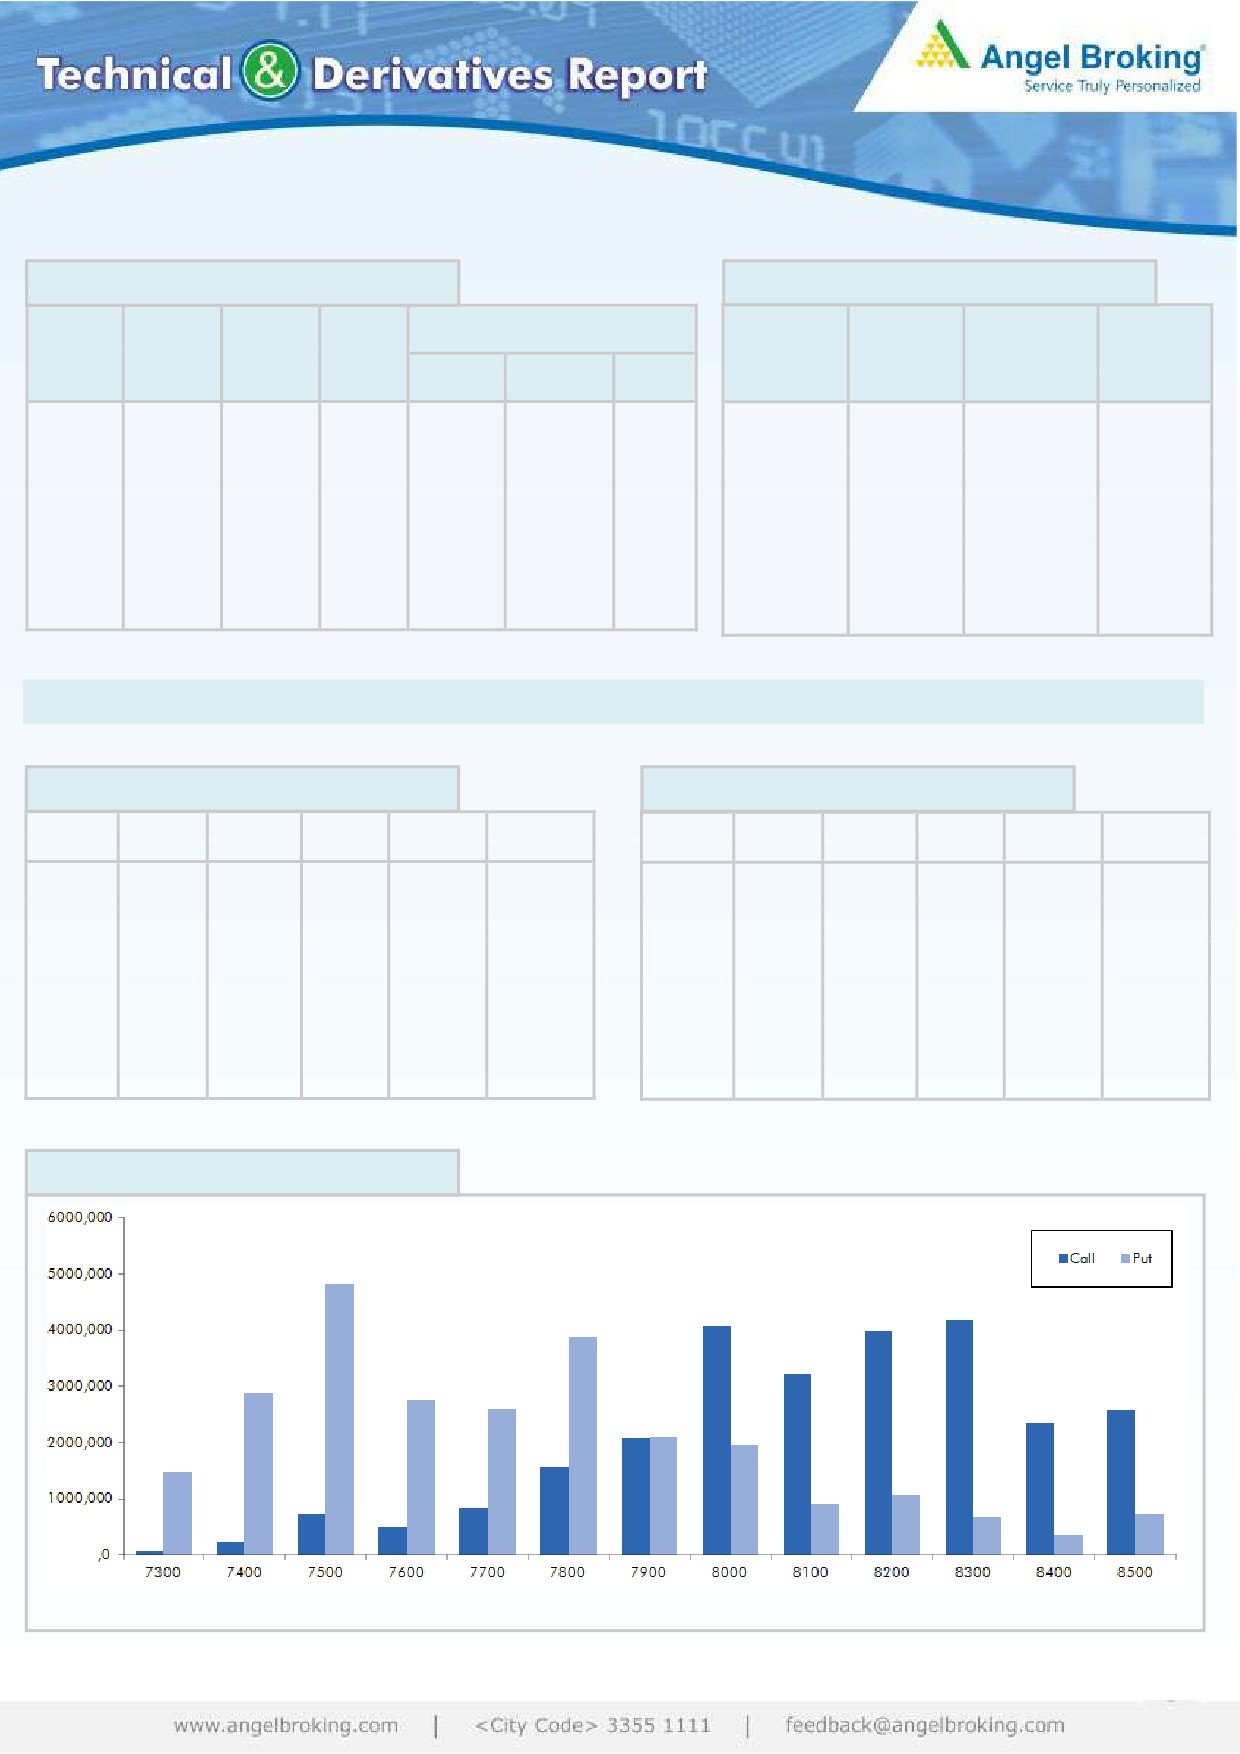
Nifty Vs OI
The Nifty futures open interest has increased by 2.88%
BankNifty futures open interest has decreased by 1.55%
as market closed at 7950.90 levels.
The Nifty September future closed at a premium of
26.05 points against a premium of 32.55 points. The
October series closed at a premium of 62.50 points.
The Implied Volatility of at the money options has
decreased from 20.40% to 17.60%.
Nifty PCR-OI has decreased from 0.92 to 0.91 levels.
The total OI of the market is Rs. 1,90,872/- cr. and the
stock futures OI is Rs. 55,991/- cr.
Views
OI Gainers
OI
PRICE
Thursday, FIIs were net buyer in both cash market
SCRIP
OI
PRICE
CHG. (%)
CHG. (%)
segment and in Index Futures. They bought equities
INFRATEL
1118000
46.76
399.25
11.63
marginally and Index Futures of Rs. 964 crores with rise
CADILAHC
191700
37.72
2114.15
0.37
in OI, suggesting fresh long formation in last trading
TV18BRDCST
6341000
31.34
35.05
-1.41
session.
MARICO
481000
20.13
402.40
-1.17
BEML
82500
17.86
1249.70
-0.04
In Index Options front, they bought marginally with fall
in OI. In call options, decent OI addition was seen in
OI Losers
8100-8400 strikes and in put options, 7500, 7800 &
OI
PRICE
8000 strike added decent OI. Unwinding in 7600 &
SCRIP
OI
PRICE
CHG. (%)
CHG. (%)
7400 put strikes was also visible. Maximum OI is seen in
ENGINERSIN
1261200
-7.54
192.60
0.05
8300 call and 7500 put options. 8150-8200 is a major
DLF
32987000
-6.95
132.95
-2.49
resistance for market; we don’t expect Nifty to surpass
IRB
4768000
-6.63
237.05
-0.46
this level.
HINDZINC
1944000
-5.45
137.50
-1.47
IOB
9404000
-5.41
36.70
2.37
Historical Volatility
Put-Call Ratio
SCRIP
HV
SCRIP
PCR-OI
PCR-VOL
IDFC
74.71
NIFTY
0.91
0.91
HCLTECH
72.13
BANKNIFTY
0.87
0.64
TCS
21.08
SBIN
0.50
0.41
ULTRACEMCO
39.07
RELIANCE
0.72
0.57
TITAN
34.49
TATAMOTORS
0.64
0.61
Strategy Date
Symbol
Strategy
Status
September 28, 2015
NIFTY
Long Strangle
Active
2
October 05, 2015
FII Statistics for 01-October 2015
Turnover on 01-October 2015
Open Interest
No. of
Turnover
Change
Detail
Buy
Sell
Net
Instrument
Contracts
( in Cr. )
(%)
Contracts
Value
Change
INDEX
INDEX
2163.15
1199.49
963.66
803434
17915.01
2.42
625738
16242.38
-15.63
FUTURES
FUTURES
INDEX
INDEX
9893.77
9870.96
22.81
1922747
60142.46
(3.03)
4986565
109884.87
2.83
OPTIONS
OPTIONS
STOCK
2265.14
2395.71
(130.57)
1783689
44988.15
1.19
STOCK
848187
22431.11
-6.92
FUTURES
FUTURES
STOCK
STOCK
1351.13
1371.19
(20.06)
60218
1566.96
18.09
OPTIONS
377079
9874.68
-23.91
OPTIONS
TOTAL
15673.18
14837.34
835.84
4570088
124612.58
(0.24)
TOTAL
6837569
158433.04
-2.91
Nifty Spot = 7950.90
Lot Size = 25
Bull-Call Spreads
Bear-Put Spreads
Action
Strike
Price
Risk
Reward
BEP
Action
Strike
Price
Risk
Reward
BEP
Buy
Buy
8000
141.35
7900
126.70
50.10
49.90
8050.10
30.65
69.35
7869.35
Sell
Sell
8100
91.25
7800
96.05
Buy
Buy
8000
141.35
7900
126.70
85.70
114.30
8085.70
54.60
145.40
7845.40
Sell
Sell
8200
55.65
7700
72.10
Buy
Buy
8100
91.25
7800
96.05
35.60
64.40
8135.60
23.95
76.05
7776.05
Sell
Sell
8200
55.65
7700
72.10
Note: Above mentioned Bullish or Bearish Spreads in Nifty (Oct. Series) are given as an information and not as a recommendation.
Nifty Put-Call Analysis
3
October 05, 2015
Daily Pivot Levels for Nifty 50 Stocks
Scrips
S2
S1
PIVOT
R1
R2
SENSEX
26,011
26,116
26,274
26,379
26,537
NIFTY
7,886
7,918
7,963
7,996
8,041
BANKNIFTY
16,939
17,044
17,217
17,323
17,496
ACC
1,340
1,352
1,363
1,375
1,386
AMBUJACEM
205
208
209
212
213
ASIANPAINT
829
834
842
847
854
AXISBANK
484
490
497
503
509
BAJAJ-AUTO
2,266
2,290
2,309
2,334
2,352
BANKBARODA
177
179
182
184
188
BHARTIARTL
334
337
339
341
343
BHEL
193
196
202
205
211
BOSCHLTD
18,952
19,129
19,389
19,566
19,826
BPCL
835
845
855
865
874
CAIRN
150
152
154
155
157
CIPLA
620
627
638
645
656
COALINDIA
322
325
328
331
334
DRREDDY
4,164
4,199
4,224
4,259
4,284
GAIL
281
287
298
304
315
GRASIM
3,465
3,497
3,534
3,566
3,602
HCLTECH
789
823
869
903
949
HDFC
1,166
1,182
1,207
1,222
1,248
HDFCBANK
1,050
1,059
1,068
1,077
1,086
HEROMOTOCO
2,356
2,384
2,428
2,457
2,501
HINDALCO
69
70
71
72
73
HINDUNILVR
802
809
818
825
834
ICICIBANK
261
264
269
272
276
IDEA
144
147
150
153
157
INDUSINDBK
933
945
954
967
976
INFY
1,139
1,156
1,177
1,194
1,215
ITC
323
326
330
333
337
KOTAKBANK
628
634
644
651
661
LT
1,450
1,470
1,482
1,502
1,515
LUPIN
1,996
2,053
2,090
2,147
2,184
M&M
1,222
1,236
1,257
1,271
1,292
MARUTI
4,472
4,526
4,624
4,678
4,776
NMDC
92
93
94
95
95
NTPC
121
122
124
125
127
ONGC
225
229
231
235
237
PNB
130
131
133
134
136
POWERGRID
128
129
132
133
135
RELIANCE
850
858
866
873
881
SBIN
230
232
237
240
245
VEDL
80
82
84
86
88
SUNPHARMA
865
878
886
900
908
TATAMOTORS
287
292
297
302
307
TATAPOWER
65
65
66
67
67
TATASTEEL
207
210
213
215
218
TCS
2,571
2,608
2,629
2,666
2,687
TECHM
526
545
556
574
585
ULTRACEMCO
2,630
2,702
2,741
2,812
2,851
WIPRO
588
594
603
610
619
YESBANK
703
716
728
740
752
ZEEL
384
388
392
396
400
4
October 05, 2015
Research Team Tel: 022 - 39357800
DISCLAIMER
Angel Broking Private Limited (hereinafter referred to as “Angel”) is a registered Member of National Stock Exchange of India Limited,
Bombay Stock Exchange Limited and MCX Stock Exchange Limited. It is also registered as a Depository Participant with CDSL and
Portfolio Manager with SEBI. It also has registration with AMFI as a Mutual Fund Distributor. Angel Broking Private Limited is a
registered entity with SEBI for Research Analyst in terms of SEBI (Research Analyst) Regulations, 2014 vide registration number
INH000000164. Angel or its associates has not been debarred/ suspended by SEBI or any other regulatory authority for accessing
/dealing in securities Market. Angel or its associates including its relatives/analyst do not hold any financial interest/beneficial
ownership of more than 1% in the company covered by Analyst. Angel or its associates/analyst has not received any compensation /
managed or co-managed public offering of securities of the company covered by Analyst during the past twelve months. Angel/analyst
has not served as an officer, director or employee of company covered by Analyst and has not been engaged in market making activity
of the company covered by Analyst.
This document is solely for the personal information of the recipient, and must not be singularly used as the basis of any investment
decision. Nothing in this document should be construed as investment or financial advice. Each recipient of this document should
make such investigations as they deem necessary to arrive at an independent evaluation of an investment in the securities of the
companies referred to in this document (including the merits and risks involved), and should consult their own advisors to determine
the merits and risks of such an investment.
Reports based on technical and derivative analysis center on studying charts of a stock's price movement, outstanding positions and
trading volume, as opposed to focusing on a company's fundamentals and, as such, may not match with a report on a company's
fundamentals.
The information in this document has been printed on the basis of publicly available information, internal data and other reliable
sources believed to be true, but we do not represent that it is accurate or complete and it should not be relied on as such, as this
document is for general guidance only. Angel Broking Pvt. Limited or any of its affiliates/ group companies shall not be in any way
responsible for any loss or damage that may arise to any person from any inadvertent error in the information contained in this report.
Angel Broking Pvt. Limited has not independently verified all the information contained within this document. Accordingly, we cannot
testify, nor make any representation or warranty, express or implied, to the accuracy, contents or data contained within this document.
While Angel Broking Pvt. Limited endeavors to update on a reasonable basis the information discussed in this material, there may be
regulatory, compliance, or other reasons that prevent us from doing so.
This document is being supplied to you solely for your information, and its contents, information or data may not be reproduced,
redistributed or passed on, directly or indirectly.
Neither Angel Broking Pvt. Limited, nor its directors, employees or affiliates shall be liable for any loss or damage that may arise from
or in connection with the use of this information.
Note: Please refer to the important ‘Stock Holding Disclosure' report on the Angel website (Research Section). Also, please refer to the
latest update on respective stocks for the disclosure status in respect of those stocks. Angel Broking Pvt. Limited and its affiliates may
have investment positions in the stocks recommended in this report.
5