Technical & Derivatives Report
November 04, 2015
Sensex (26591) / Nifty (8061)
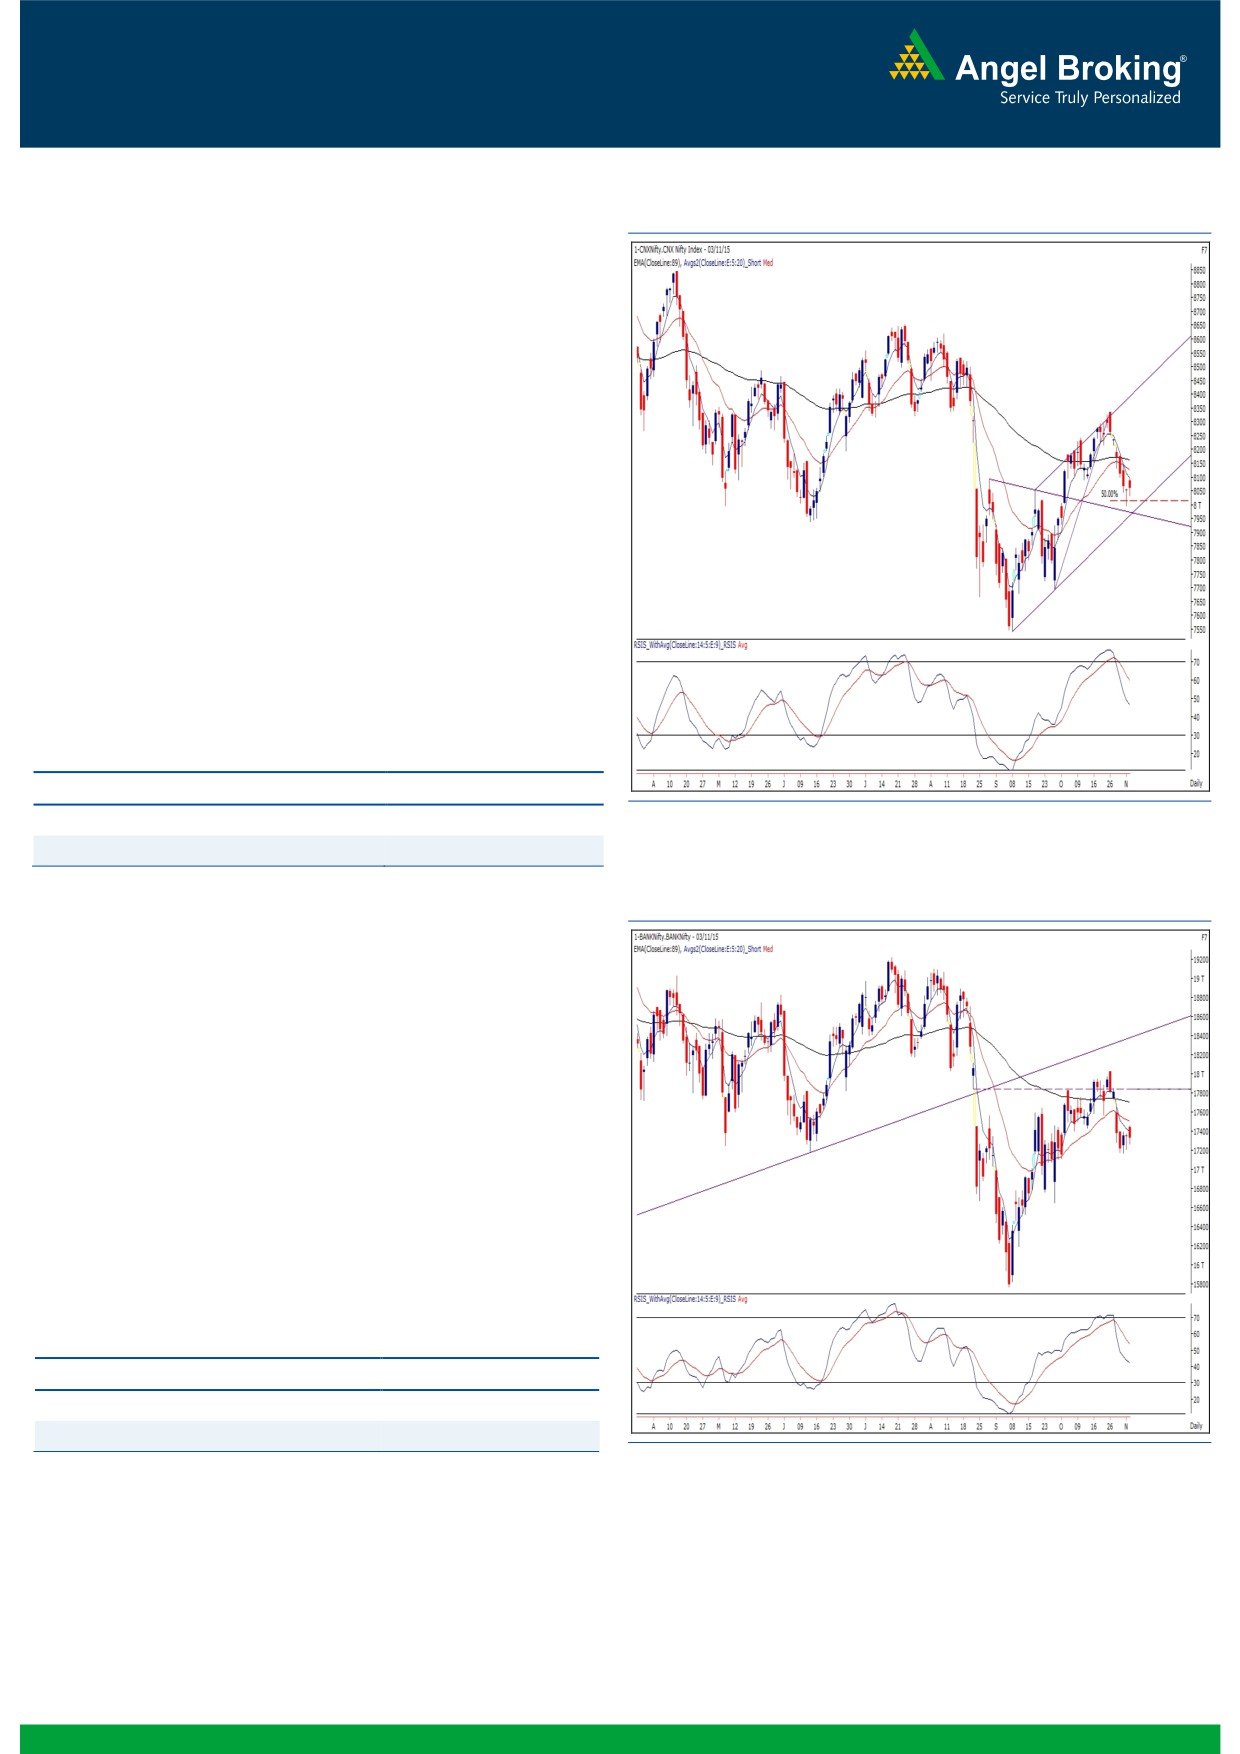
Exhibit 1: Nifty Daily Chart
Yesterday, our benchmark index opened slightly higher in-line
with cheerful global bourses. However, the bulls failed to keep the
momentum going as we witnessed a gradual slide within a
narrow range to close tad above the 8050 mark.
Monday’s recovery in the latter half led to a formation of
‘Dragonfly Doji’ pattern on the daily chart. As a result, the index
started the session on a positive note; however, the follow up
buying was clearly missing. Despite this, we maintain our opinion
that the index may still give a minor bounce back towards 8120 -
8180. Since, this can be termed as a pullback of the recent fall;
we would advise not to trade aggressively on the long side. On
the flipside, a sustainable move below
7950 may trigger
pessimism in the market, which may result in a continuation of
this downward move towards 7850 - 7800 levels. At this juncture,
for next few days, we expect a range bound action within 200
points before confirming next direction of the market. Traders can
focus on stock specific moves by following proper exit strategy.
Key Levels
Support 1 - 7995
Resistance 1 - 8120
Support 2 - 7950
Resistance 2 - 8180
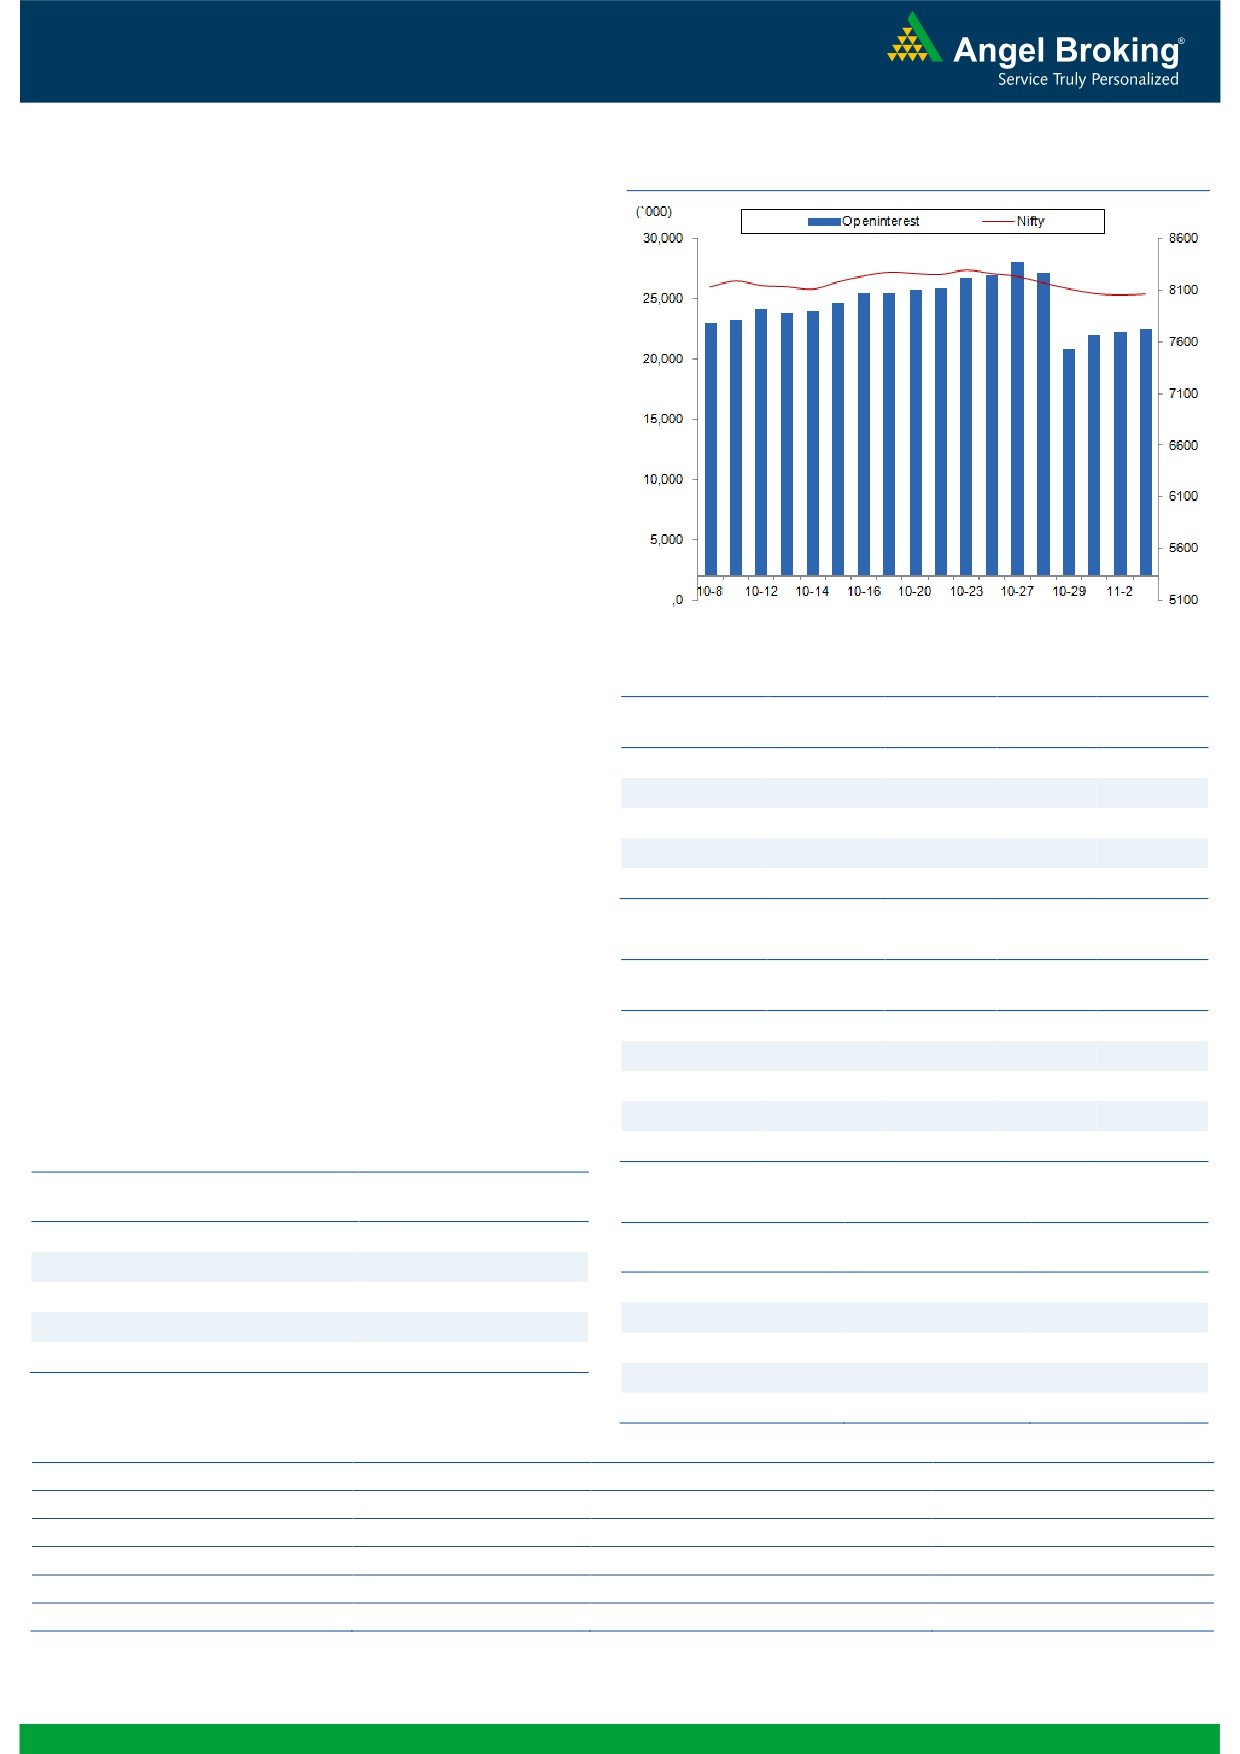
Exhibit 2: Bank Nifty Daily Chart
Bank Nifty Outlook - (17326)
In yesterday's trading session, the Bank Nifty index traded in a
narrow range and ended the session on a flat note. During last
week, the index gave a breakdown from a rising trend line
support with a gap down opening. As per the gap theory in
technical analysis, the breakaway gap created last week should
now act as a resistance on pullback moves. The gap area seen
last week is in a range of 17682 - 17738 and hence, we may see
a pull back move towards the mentioned resistance zone in near
term. Going forward, the intraday resistance for the index is
placed at 17565 and 17682 levels. On the flip side, the
immediate support in the index is placed around 17260 and
17170 levels.
Key Levels
Support 1 - 17260
Resistance 1 - 17565
Support 2 - 17170
Resistance 2 - 17682
1
Technical & Derivatives Report
November 04, 2015
Comments
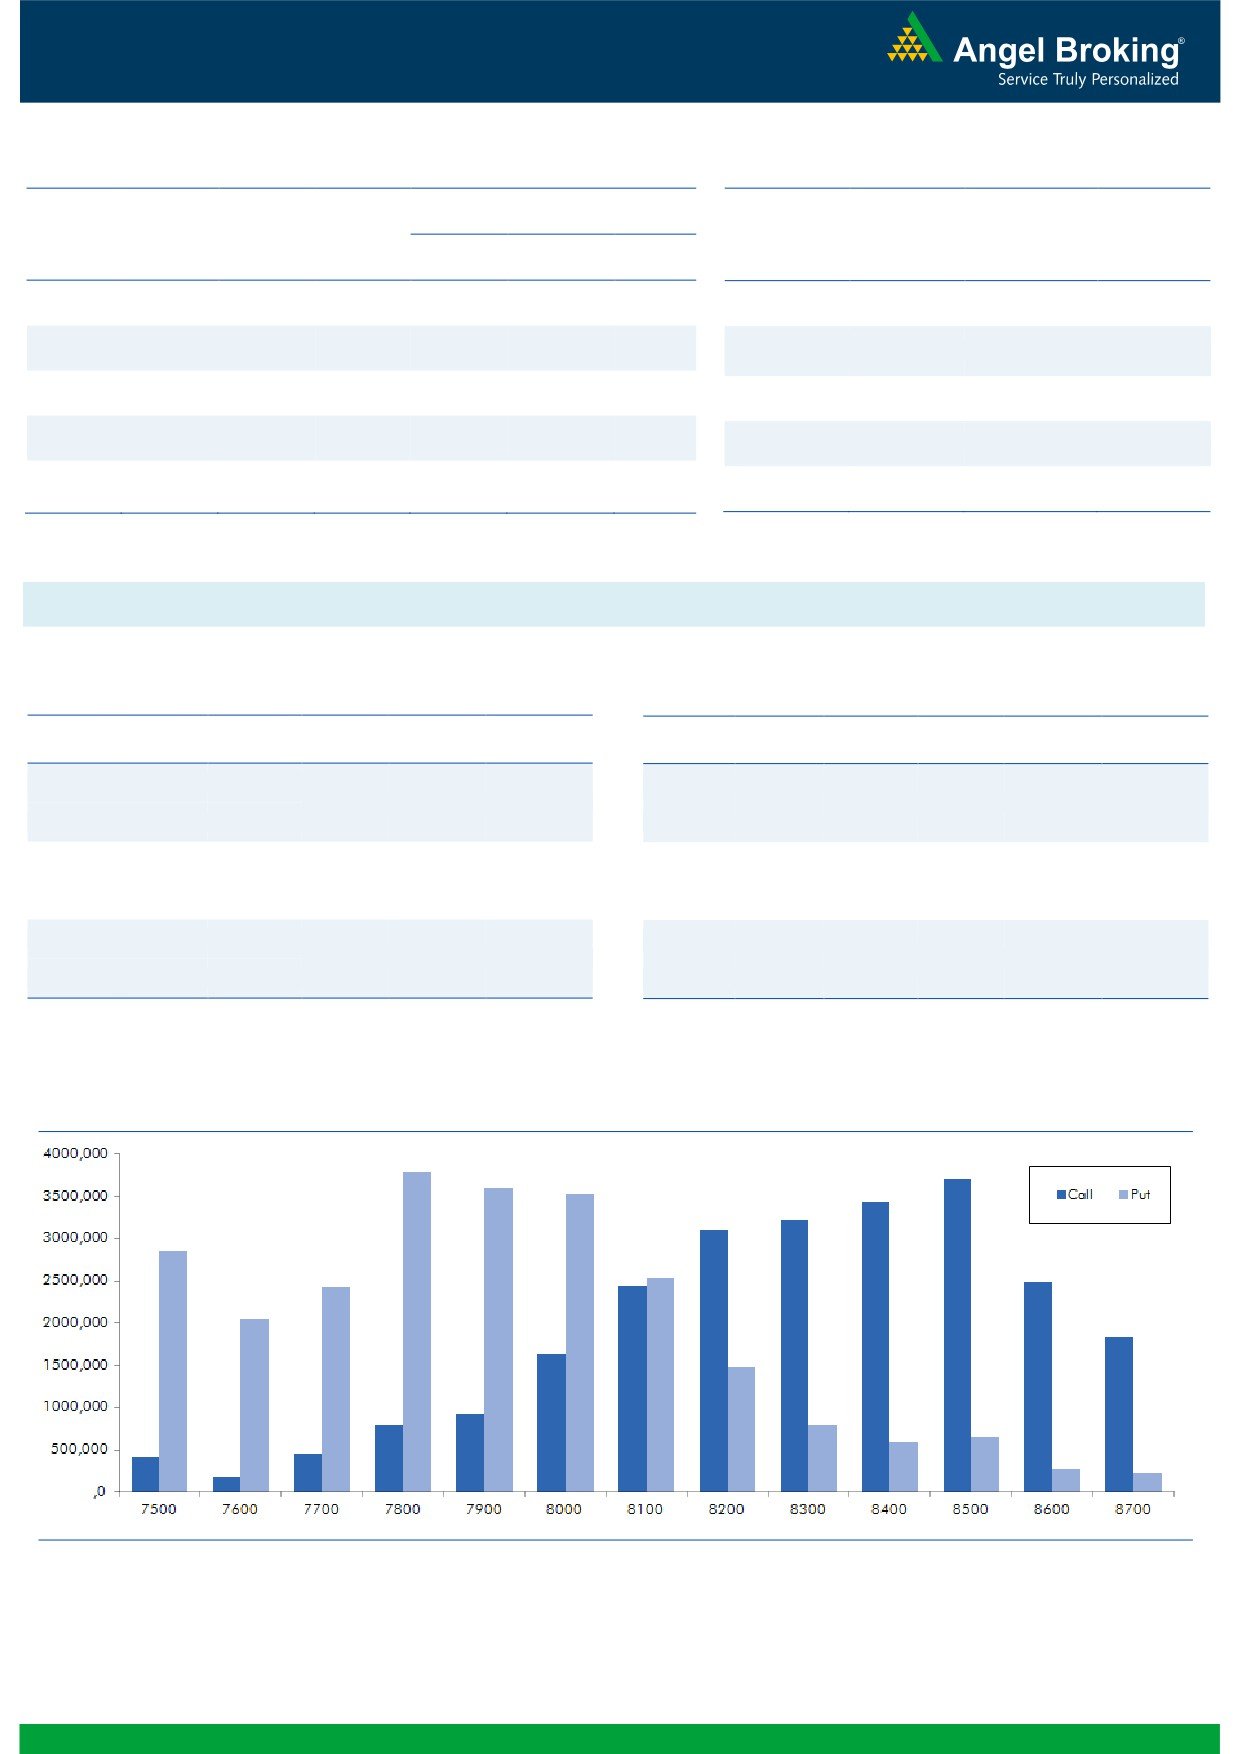
Nifty Vs OI
The Nifty futures open interest has increased by 0.54%
BankNifty futures open interest has increased by 3.20%
as market closed at 8060.70 levels.
The Nifty November future closed at a premium of 26.55
points against a premium of
25.35 points. The
December series closed at a premium of 69.05 points.
The Implied Volatility of at the money options has
increased from 17.42% to 17.89%.
The total OI of the market is Rs. 1,95,391/- cr. and the
stock futures OI is Rs. 59,883/- cr.
Few of the liquid counters where we have seen high cost
of carry are NHPC, GMRINFRA, TV18BRDCST, L&TFH
and UNITECH.
Views
OI Gainers
OI
PRICE
FIIs were net sellers in cash market segment to the tune
SCRIP
OI
PRICE
CHG. (%)
CHG. (%)
of Rs. 445 crores. While in Index Futures they bought of
MARICO
1359800
55.42
389.05
1.20
Rs. 402 crores with marginal change in OI, suggesting
APOLLOTYRE
10626000
17.71
165.65
-3.07
blend of both long formation and short covering in last
BATAINDIA
3835000
15.41
477.65
-1.67
trading session.
HEXAWARE
5348000
15.36
232.60
0.37
In Index Options front, they bought of worthnRs.b244ng.co
ACC
1232625
12.07
1428.20
1.70
crores with good amount of rise in OI. In call options,
8200-8500 call options added decent open interest.
OI Losers
While in put options, some OI addition was seen in 7900
OI
PRICE
and 8000 strikes. Maximum OI is seen in 8500 call and
SCRIP
OI
PRICE
CHG. (%)
CHG. (%)
8000 put options. Seeing the global data, we believe
CADILAHC
2287500
-11.54
424.45
2.76
Nifty may show strength, one should trade with a positive
ORIENTBANK
9633000
-8.96
143.75
-2.01
bias for today.
UBL
727500
-8.20
955.95
-1.04
APOLLOHOSP
691200
-6.80
1351.35
0.53
SKSMICRO
8365000
-5.24
454.35
1.67
Historical Volatility
SCRIP
HV
Put-Call Ratio
PETRONET
32.69
SCRIP
PCR-OI
PCR-VOL
ACC
22.24
NIFTY
0.90
0.76
DIVISLAB
34.40
BANKNIFTY
0.78
0.77
OFSS
26.73
LT
0.40
0.39
CADILAHC
38.57
AXISBANK
0.37
0.38
ICICIBANK
0.61
0.41
Strategy Date
Symbol
Strategy
Status
November 02, 2015
RELIANCE
Short Strangle
Active
2
Technical & Derivatives Report
November 04, 2015
FII Statistics for 03-November 2015
Turnover on 03-November 2015
Open Interest
No. of
Turnover
Change
Detail
Buy
Sell
Net
Instrument
Value
Change
Contracts
( in Cr. )
(%)
Contracts
(in Cr.)
(%)
INDEX
INDEX
1411.35
1009.00
402.35
281750
16797.79
(0.04)
206306
11747.52
-2.31
FUTURES
FUTURES
INDEX
INDEX
12172.20
11927.83
244.37
990721
59487.55
5.24
1449551
87233.68
-10.39
OPTIONS
OPTIONS
STOCK
2858.44
2741.05
117.39
918903
46198.09
0.73
STOCK
FUTURES
424688
21864.48
-9.23
FUTURES
STOCK
STOCK
1247.50
1244.54
2.97
43706
2191.99
14.90
OPTIONS
186334
9894.81
-12.46
OPTIONS
TOTAL
17689.49
16922.42
767.07
2235080
124675.42
2.83
TOTAL
2266880
130740.58
-9.68
Nifty Spot = 8060.70
Lot Size = 25
Bull-Call Spreads
Bear-Put Spreads
Action
Strike
Price
Risk
Reward
BEP
Action
Strike
Price
Risk
Reward
BEP
Buy
8100
133.55
Buy
8000
111.15
47.25
52.75
8147.25
28.70
71.30
7971.30
Sell
8200
86.30
Sell
7900
82.45
Buy
8100
133.55
Buy
8000
111.15
81.80
118.20
8181.80
50.05
149.95
7949.95
Sell
8300
51.75
Sell
7800
61.10
Buy
8200
86.30
Buy
7900
82.45
34.55
65.45
8234.55
21.35
78.65
7878.65
Sell
8300
51.75
Sell
7800
61.10
Note: Above mentioned Bullish or Bearish Spreads in Nifty (Nov. Series) are given as an information and not as a recommendation.
Nifty Put-Call Analysis
3
Technical & Derivatives Report
November 04, 2015
Daily Pivot Levels for Nifty 50 Stocks
Scrips
S2
S1
PIVOT
R1
R2
ACC
1,426
1,393
1,409
1,422
1,438
ADANIPORTS
291
283
287
294
298
AMBUJACEM
210
194
202
217
224
ASIANPAINT
814
799
807
820
827
AXISBANK
475
467
471
477
481
BAJAJ-AUTO
2,425
2,390
2,407
2,429
2,446
BANKBARODA
162
159
161
163
164
BHARTIARTL
348
341
344
349
352
BHEL
201
197
199
201
203
BOSCHLTD
20,700
20,440
20,570
20,730
20,860
BPCL
877
858
867
876
885
CAIRN
155
152
154
155
156
CIPLA
675
663
669
678
684
COALINDIA
326
323
324
326
328
DRREDDY
4,335
4,281
4,308
4,326
4,354
GAIL
307
292
300
308
315
GRASIM
3,699
3,670
3,685
3,702
3,717
HCLTECH
876
870
873
877
881
HDFC
1,221
1,205
1,213
1,223
1,232
HDFCBANK
1,085
1,073
1,079
1,085
1,092
HEROMOTOCO
2,583
2,511
2,547
2,572
2,608
HINDALCO
82
80
81
83
84
HINDUNILVR
804
797
801
805
808
ICICIBANK
279
276
278
280
282
IDEA
139
137
138
140
141
INDUSINDBK
912
901
907
914
919
INFY
1,146
1,126
1,136
1,143
1,153
ITC
335
329
332
336
338
KOTAKBANK
683
669
676
683
690
LT
1,373
1,350
1,362
1,379
1,391
LUPIN
1,875
1,838
1,856
1,884
1,902
M&M
1,233
1,201
1,217
1,226
1,242
MARUTI
4,483
4,433
4,458
4,490
4,514
NTPC
136
131
133
136
138
ONGC
251
243
247
249
253
PNB
130
128
129
131
132
POWERGRID
132
129
131
131
132
RELIANCE
967
957
962
966
971
SBIN
236
232
234
237
239
SUNPHARMA
98
95
97
99
100
TATAMOTORS
869
855
862
870
877
TATAPOWER
382
374
378
385
389
TATASTEEL
69
68
68
69
70
TCS
236
230
233
238
241
TECHM
2,543
2,507
2,525
2,537
2,555
ULTRACEMCO
557
542
549
556
564
VEDL
2,926
2,894
2,910
2,934
2,950
WIPRO
574
567
571
575
579
YESBANK
779
761
770
776
785
ZEEL
413
401
407
411
417
4
Technical & Derivatives Report
November 04, 2015
Research Team Tel: 022 - 39357800
For Technical Queries
For Derivatives Queries
DISCLAIMER
Angel Broking Private Limited (hereinafter referred to as “Angel”) is a registered Member of National Stock Exchange of India Limited,
Bombay Stock Exchange Limited and MCX Stock Exchange Limited. It is also registered as a Depository Participant with CDSL and
Portfolio Manager with SEBI. It also has registration with AMFI as a Mutual Fund Distributor. Angel Broking Private Limited is a
registered entity with SEBI for Research Analyst in terms of SEBI (Research Analyst) Regulations, 2014 vide registration number
INH000000164. Angel or its associates has not been debarred/ suspended by SEBI or any other regulatory authority for accessing
/dealing in securities Market. Angel or its associates including its relatives/analyst do not hold any financial interest/beneficial
ownership of more than 1% in the company covered by Analyst. Angel or its associates/analyst has not received any compensation /
managed or co-managed public offering of securities of the company covered by Analyst during the past twelve months. Angel/analyst
has not served as an officer, director or employee of company covered by Analyst and has not been engaged in market making activity
of the company covered by Analyst.
This document is solely for the personal information of the recipient, and must not be singularly used as the basis of any investment
decision. Nothing in this document should be construed as investment or financial advice. Each recipient of this document should
make such investigations as they deem necessary to arrive at an independent evaluation of an investment in the securities of the
companies referred to in this document (including the merits and risks involved), and should consult their own advisors to determine
the merits and risks of such an investment.
Reports based on technical and derivative analysis center on studying charts of a stock's price movement, outstanding positions and
trading volume, as opposed to focusing on a company's fundamentals and, as such, may not match with a report on a company's
fundamentals.
The information in this document has been printed on the basis of publicly available information, internal data and other reliable
sources believed to be true, but we do not represent that it is accurate or complete and it should not be relied on as such, as this
document is for general guidance only. Angel Broking Pvt. Limited or any of its affiliates/ group companies shall not be in any way
responsible for any loss or damage that may arise to any person from any inadvertent error in the information contained in this report.
Angel Broking Pvt. Limited has not independently verified all the information contained within this document. Accordingly, we cannot
testify, nor make any representation or warranty, express or implied, to the accuracy, contents or data contained within this document.
While Angel Broking Pvt. Limited endeavors to update on a reasonable basis the information discussed in this material, there may be
regulatory, compliance, or other reasons that prevent us from doing so.
This document is being supplied to you solely for your information, and its contents, information or data may not be reproduced,
redistributed or passed on, directly or indirectly.
Neither Angel Broking Pvt. Limited, nor its directors, employees or affiliates shall be liable for any loss or damage that may arise from
or in connection with the use of this information.
Note: Please refer to the important ‘Stock Holding Disclosure' report on the Angel website (Research Section). Also, please refer to the
latest update on respective stocks for the disclosure status in respect of those stocks. Angel Broking Pvt. Limited and its affiliates may
have investment positions in the stocks recommended in this report.
5