Technical & Derivatives Report
October 04, 2016
Sensex (28243) / Nifty (8738)
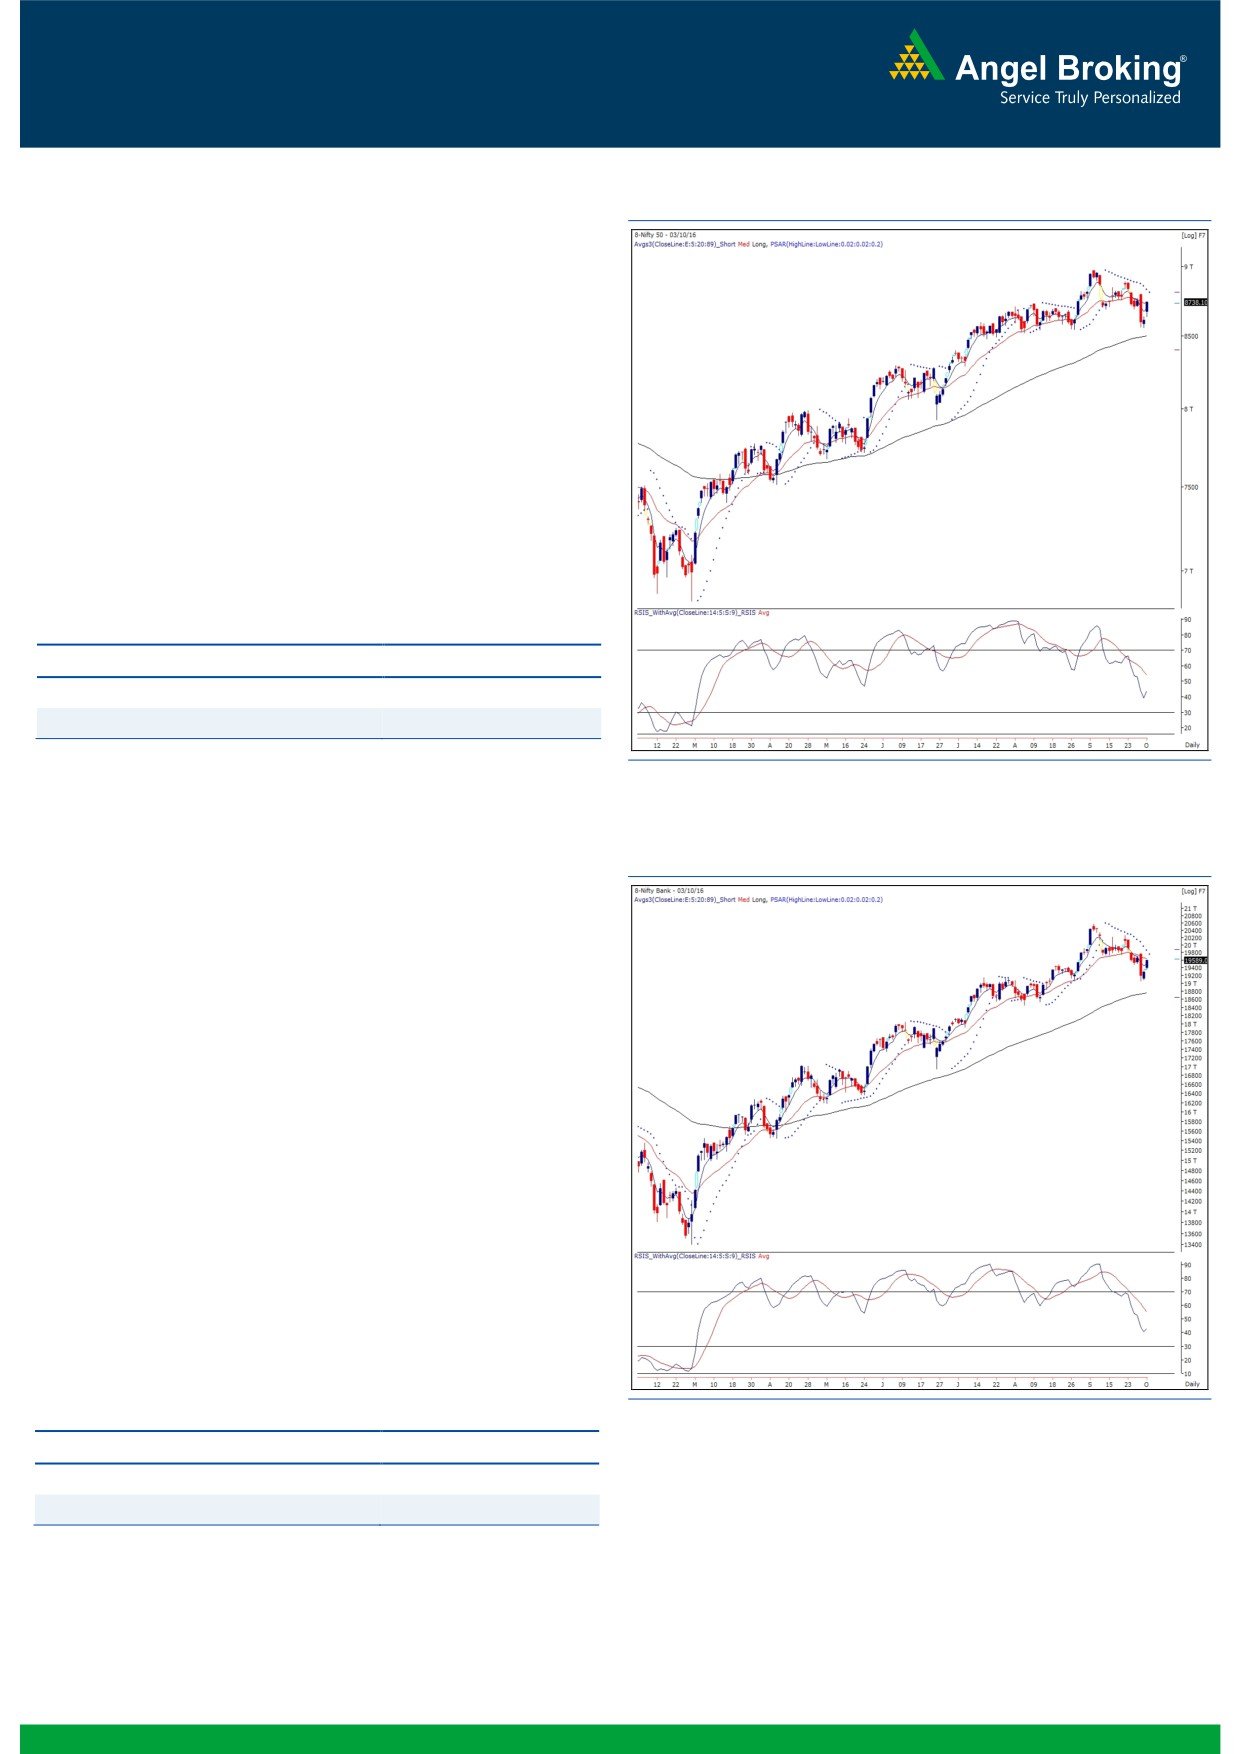
Exhibit 1: Nifty Daily Chart
The Nifty index opened the day on a positive note yesterday and
rallied higher to end the session with gains of 1.47 percent.
Although the Nifty index showed a pullback move yesterday, the
higher degree charts shows no signs of reversal and hence, there
is higher probability of the ongoing pullback move getting sold
into. The resistance for the Nifty index is seen around
8810,
which is 61.8% retracement of the recent corrective move. Due to
the RBI's Monetary Policy scheduled today, the volatility is
expected to remain higher. Hence, traders are advised to trade
with proper risk management strategy. The intraday support for
the Nifty index is placed around 8690 and 8615 whereas
resistances are seen around 8810 and 8880.
Key Levels
Support 1 - 8690
Resistance 1 - 8810
Support 2 - 8615
Resistance 2 - 8880
Exhibit 2: Nifty Bank Daily Chart
Nifty Bank Outlook - (19589)
The Nifty Bank index opened gap up yesterday and rallied
throughout the session to end the day with gains of 1.57 percent
over its previous session's close.
The index continued with Friday's positive momentum and rallied
significantly which was unexpected by us, to an extent. However,
on daily charts, the trend following indicators viz. 'SuperTrend'
and the 'Parabolic SAR' have not yet shown any reversal signs.
This coupled with the recent gap down opening which has not
been crossed yet, indicates probability of this upmove being a
pullback move rather than resumption of uptrend. Hence, we
would still wait for further development of the charts and stay
cautious on the market. Owing to the RBI's Monetary Policy
scheduled today, there could be higher volatility and thus, traders
are advised to follow proper risk management. The near term
support for the index is placed in range of 19365-19330;
whereas, resistances are seen around 19760 and 19860.
Key Levels
Support 1 - 19365
Resistance 1 - 19760
Support 2 - 19330
Resistance 2 - 19860
1
Technical & Derivatives Report
October 04, 2016
Comments
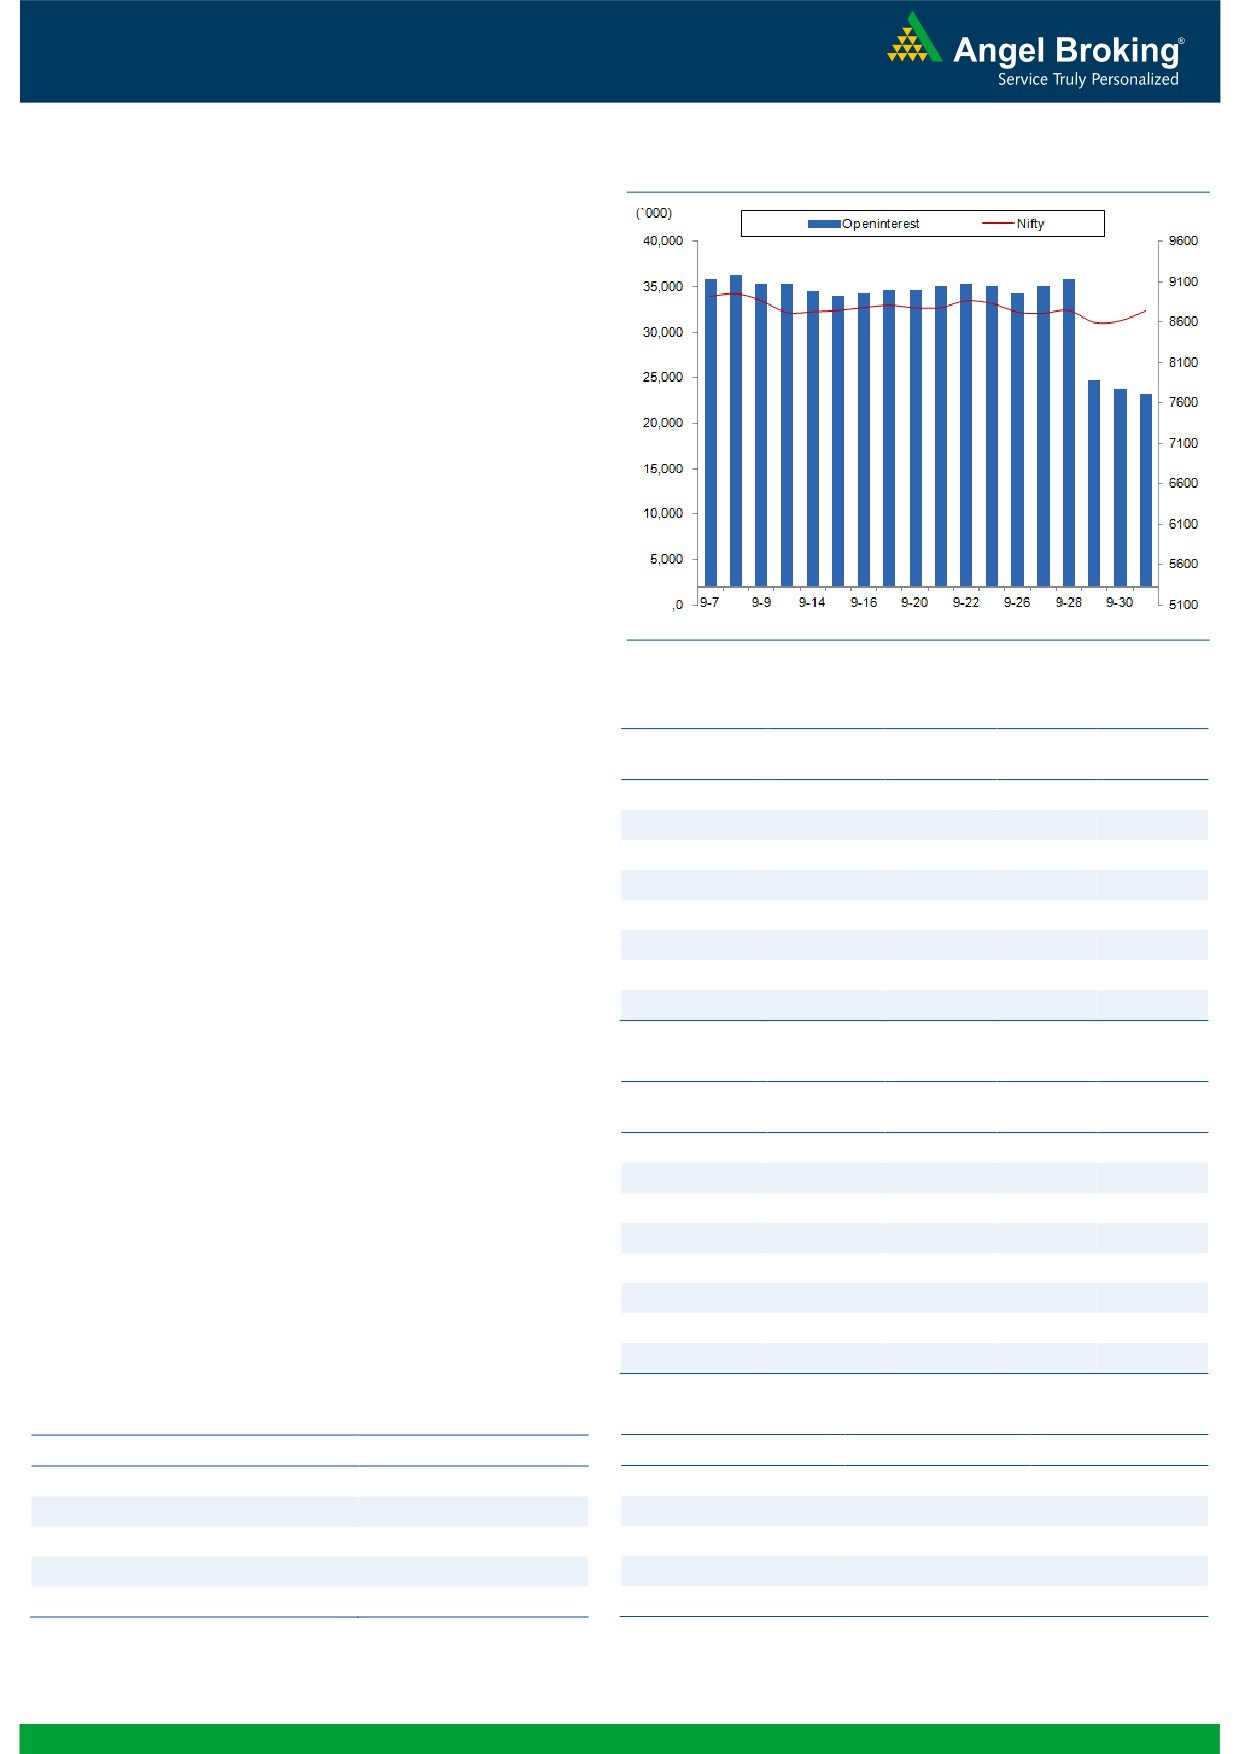
Nifty Vs OI
The Nifty futures open interest has decreased by 2.48%
BankNifty futures open interest has decreased by 1.57%
as market closed at 8738.10 levels.
The Nifty October future closed with a premium of 41.00
against the premium of 29.50 points in last trading
session. The November series closed at a premium of
81.30 points.
The Implied Volatility of at the money options has
decreased from 15.82% to 13.89%. At the same time,
the PCR-OI of Nifty remained unchanged at 0.94.
The total OI of the market is Rs. 2,37,704/- cr. and the
stock futures OI is Rs. 76,751/- cr.
Few of the liquid counters where we have seen high cost
of carry are SOUTHBANK, JPASSOCIAT, HEXAWARE,
DCBBANK and ALBK.
Views
OI Gainers
FIIs activity in cash market segment was subdued. While,
OI
PRICE
SCRIP
OI
PRICE
in index future they were net sellers of worth Rs. 159
CHG. (%)
CHG. (%)
crores with marginal change in OI, indicating some long
DCBBANK
625500
230.95
128.30
1.79
unwinding in last trading session.
TORNTPOWER
462000
123.19
181.55
-0.11
On Index Options front, FIIs sold to the tune of Rs. 293
IDFCBANK
9792000
67.44
79.25
-1.31
www.angelbroking.com
crores with decent amount of rise in OI. In call options,
HINDZINC
5184000
41.73
255.85
9.08
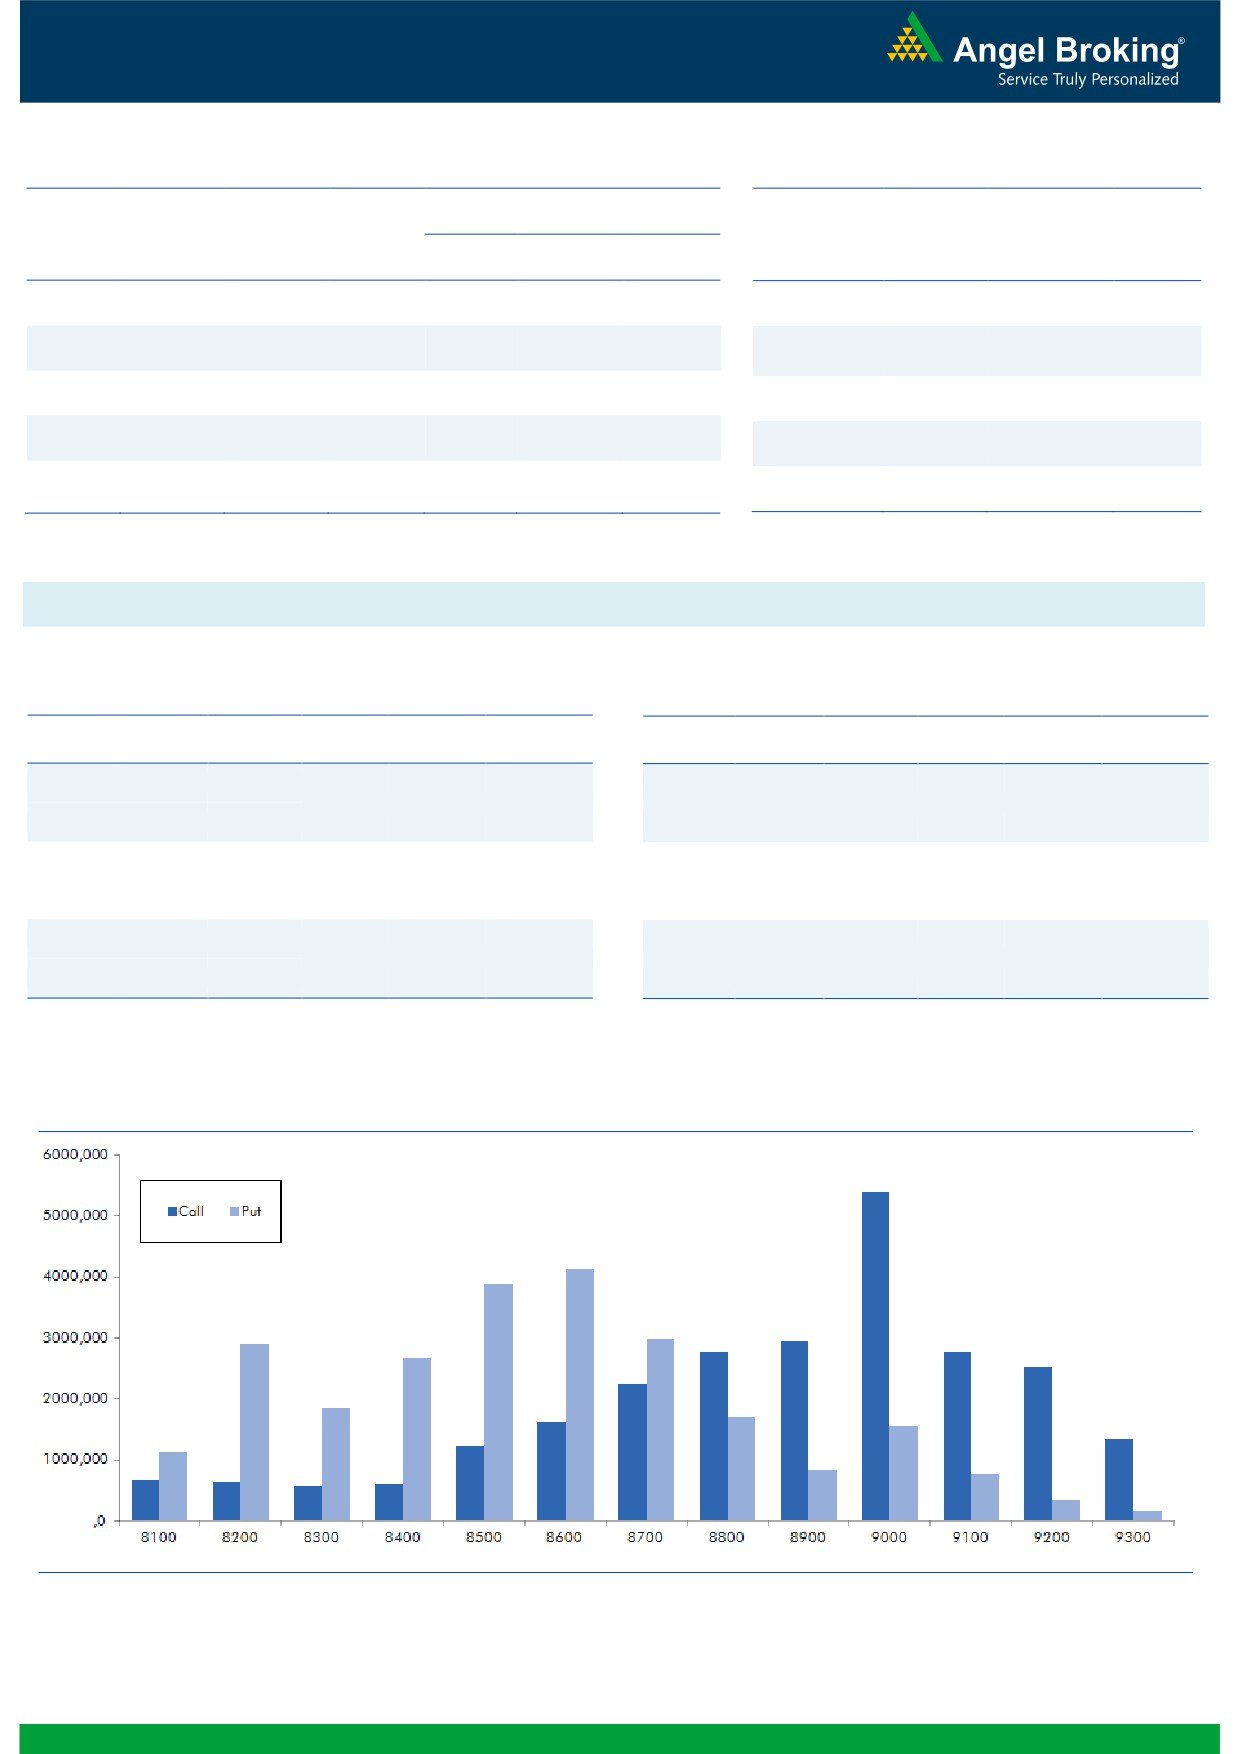
9000 strike was active and also added some buildup.
SRF
458500
38.52
1918.60
7.43
On the other hand in put options, we saw good amount
ARVIND
4950000
22.77
356.25
5.03
of open interest adittion in 8600 and 8700 strikes. We
GODREJIND
1483500
17.74
448.25
3.52
believe, these are long formation in the hopes of market
OIL
936700
16.99
417.85
3.70
correcting to 8600 level. Highest OI in October series is
placed at 9000 call and 8600 put option.
OI Losers
We witnessed continuation of long unwinding in October
OI
PRICE
SCRIP
OI
PRICE
series too. In Index Options as well FIIs are forming fresh
CHG. (%)
CHG. (%)
longs in out of the money put options. Hence, the above
PIDILITIND
2479000
-8.73
726.70
6.02
data suggests, market may remain under pressure and
ASHOKLEY
82117000
-6.47
83.35
4.38
may test its support zone of 8550-8600 in near term.
GAIL
7995000
-6.44
386.65
2.90
Thus, traders are suggested to avoid bottom fishing in
UNIONBANK
12804000
-4.90
143.75
4.09
this market. We would also recommend buying 8700 put
UBL
987000
-4.67
910.85
0.21
options of October series to trade for short term
PAGEIND
37700
-3.33
15563.20
2.31
correction.
LT
7708000
-3.32
1475.15
2.54
SYNDIBANK
15813000
-3.20
75.85
2.92
Historical Volatility
Put-Call Ratio
SCRIP
HV
SCRIP
PCR-OI
PCR-VOL
HINDZINC
52.25
NIFTY
0.94
1.00
PIDILITIND
38.53
BANKNIFTY
0.98
0.90
ZEEL
38.42
RELIANCE
0.55
0.52
OIL
26.12
ICICIBANK
0.43
0.42
M&MFIN
48.38
INFY
0.60
0.50
2
Technical & Derivatives Report
October 04, 2016
FII Statistics for 03, October 2016
Turnover on 03, October 2016
Open Interest
No. of
Turnover
Change
Detail
Buy
Sell
Net
Instrument
Value
Change
Contracts
( in Cr. )
(%)
Contracts
(in Cr.)
(%)
INDEX
INDEX
2160.00
2319.12
(159.13)
257268
17298.55
(0.31)
245710
17076.04
-12.00
FUTURES
FUTURES
INDEX
INDEX
33970.47
34263.68
(293.20)
893753
59526.89
3.05
2837510
200465.61
-0.91
OPTIONS
OPTIONS
STOCK
7715.10
7052.24
662.86
847813
56617.90
0.68
STOCK
FUTURES
573646
41855.34
2.27
FUTURES
STOCK
STOCK
3517.95
3432.11
85.84
43531
2992.23
27.74
OPTIONS
281053
20630.68
0.98
OPTIONS
TOTAL
47363.51
47067.15
296.36
2042365
136435.57
2.04
TOTAL
3937919
280027.67
-1.07
Nifty Spot = 8738.10
Lot Size = 75
Bull-Call Spreads
Bear-Put Spreads
Action
Strike
Price
Risk
Reward
BEP
Action
Strike
Price
Risk
Reward
BEP
Buy
8800
113.20
Buy
8700
96.60
44.90
55.10
8844.90
27.95
72.05
8672.05
Sell
8900
68.30
Sell
8600
68.65
Buy
8800
113.20
Buy
8700
96.60
75.10
124.90
8875.10
48.45
151.55
8651.55
Sell
9000
38.10
Sell
8500
48.15
Buy
8900
68.30
Buy
8600
68.65
30.20
69.80
8930.20
20.50
79.50
8579.50
Sell
9000
38.10
Sell
8500
48.15
Note: Above mentioned Bullish or Bearish Spreads in Nifty (October Series) are given as an information and not as a recommendation.
Nifty Put-Call Analysis
3
Technical & Derivatives Report
October 04, 2016
Daily Pivot Levels for Nifty Constituents
Scrips
S2
S1
PIVOT
R1
R2
ACC
1,591
1,612
1,625
1,646
1,659
ADANIPORTS
256
260
264
268
272
AMBUJACEM
251
255
257
261
264
ASIANPAINT
1,152
1,173
1,186
1,206
1,219
AUROPHARMA
854
862
868
876
882
AXISBANK
539
545
549
555
558
BAJAJ-AUTO
2,795
2,838
2,873
2,916
2,951
BANKBARODA
166
168
169
170
172
BHEL
134
136
137
138
139
BPCL
609
618
624
634
640
BHARTIARTL
312
315
318
321
324
INFRATEL
351
357
363
369
375
BOSCH
22,427
22,590
22,859
23,021
23,290
CIPLA
578
583
588
593
597
COALINDIA
319
323
326
331
333
DRREDDY
3,083
3,122
3,153
3,192
3,224
EICHERMOT
24,811
25,304
25,636
26,129
26,462
GAIL
366
376
382
392
398
GRASIM
4,820
4,860
4,896
4,936
4,971
HCLTECH
787
798
805
816
823
HDFCBANK
1,271
1,279
1,285
1,293
1,298
HDFC
1,370
1,398
1,414
1,442
1,458
HEROMOTOCO
3,395
3,458
3,499
3,562
3,603
HINDALCO
151
153
154
155
157
HINDUNILVR
851
860
869
878
887
ICICIBANK
248
252
254
259
261
IDEA
78
80
81
82
83
INDUSINDBK
1,176
1,205
1,222
1,251
1,268
INFY
1,021
1,029
1,035
1,043
1,049
ITC
240
241
243
244
245
KOTAKBANK
778
783
788
793
798
LT
1,421
1,446
1,460
1,485
1,500
LUPIN
1,473
1,483
1,495
1,505
1,517
M&M
1,380
1,412
1,432
1,464
1,484
MARUTI
5,589
5,635
5,678
5,723
5,766
NTPC
147
149
150
152
153
ONGC
249
254
258
264
268
POWERGRID
173
177
180
184
187
RELIANCE
1,060
1,075
1,092
1,107
1,123
SBIN
251
253
255
257
259
SUNPHARMA
745
751
756
762
767
TCS
2,367
2,389
2,423
2,446
2,480
TATAMTRDVR
340
343
346
349
352
TATAMOTORS
535
538
542
545
549
TATAPOWER
75
76
76
77
78
TATASTEEL
373
378
381
386
390
TECHM
415
418
421
424
428
ULTRACEMCO
3,824
3,876
3,906
3,958
3,987
WIPRO
472
475
478
481
484
YESBANK
1,252
1,261
1,272
1,281
1,292
ZEEL
531
555
573
596
614
4
Technical & Derivatives Report
October 04, 2016
Research Team Tel: 022 - 39357800
For Technical Queries
For Derivatives Queries
DISCLAIMER
Angel Broking Private Limited (hereinafter referred to as “Angel”) is a registered Member of National Stock Exchange of India Limited,
Bombay Stock Exchange Limited and Metropolitan Stock Exchange Limited. It is also registered as a Depository Participant with CDSL
and Portfolio Manager with SEBI. It also has registration with AMFI as a Mutual Fund Distributor. Angel Broking Private Limited is a
registered entity with SEBI for Research Analyst in terms of SEBI (Research Analyst) Regulations, 2014 vide registration number
INH000000164. Angel or its associates has not been debarred/ suspended by SEBI or any other regulatory authority for accessing
/dealing in securities Market. Angel or its associates/analyst has not received any compensation / managed or co-managed public
offering of securities of the company covered by Analyst during the past twelve months.
This document is solely for the personal information of the recipient, and must not be singularly used as the basis of any investment
decision. Nothing in this document should be construed as investment or financial advice. Each recipient of this document should
make such investigations as they deem necessary to arrive at an independent evaluation of an investment in the securities of the
companies referred to in this document (including the merits and risks involved), and should consult their own advisors to determine
the merits and risks of such an investment.
Reports based on technical and derivative analysis center on studying charts of a stock's price movement, outstanding positions and
trading volume, as opposed to focusing on a company's fundamentals and, as such, may not match with a report on a company's
fundamentals. Investors are advised to refer the Fundamental and Technical Research Reports available on our website to evaluate the
contrary view, if any.
The information in this document has been printed on the basis of publicly available information, internal data and other reliable
sources believed to be true, but we do not represent that it is accurate or complete and it should not be relied on as such, as this
document is for general guidance only. Angel Broking Pvt. Limited or any of its affiliates/ group companies shall not be in any way
responsible for any loss or damage that may arise to any person from any inadvertent error in the information contained in this report.
Angel Broking Pvt. Limited has not independently verified all the information contained within this document. Accordingly, we cannot
testify, nor make any representation or warranty, express or implied, to the accuracy, contents or data contained within this document.
While Angel Broking Pvt. Limited endeavors to update on a reasonable basis the information discussed in this material, there may be
regulatory, compliance, or other reasons that prevent us from doing so.
This document is being supplied to you solely for your information, and its contents, information or data may not be reproduced,
redistributed or passed on, directly or indirectly.
Neither Angel Broking Pvt. Limited, nor its directors, employees or affiliates shall be liable for any loss or damage that may arise from
or in connection with the use of this information.
5