Technical & Derivatives Report
August 04, 2016
Sensex (27698) / Nifty (8545)
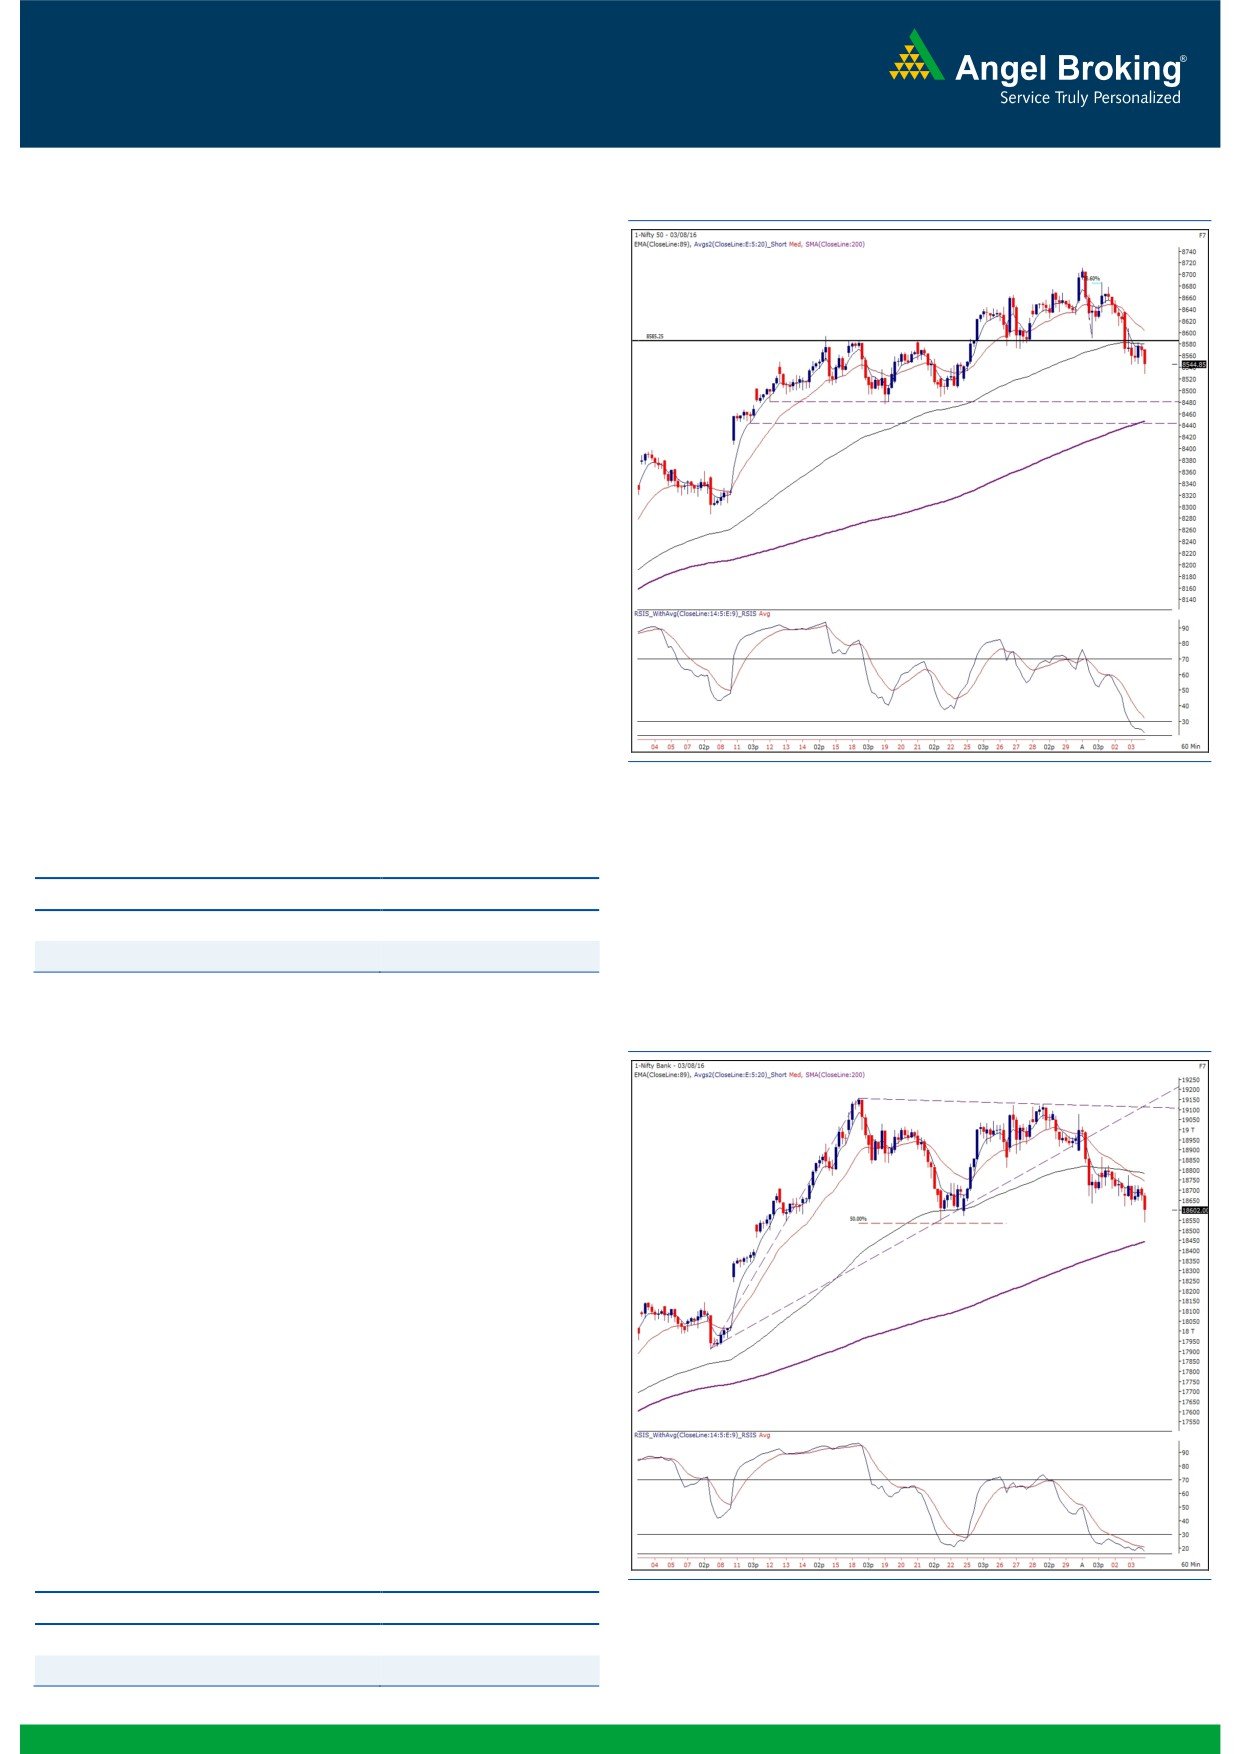
Exhibit 1: Nifty Hourly Chart
Yesterday, our markets opened tad higher; however, this early
morning lead was very short lived as the index posted a open
high and started trading lower. As expected, we saw gradual
decline towards 8572 in initial hours. In fact, due to excessive
selling pressure, the Nifty went on to break this support and
eventually ended the session below the 8550 mark.
Now, technically speaking, we are seeing some signs of
weakness. Firstly, the lower top lower bottom in hourly chart
along with negative crossover in 'RSI- Smoothened' on daily chart.
Going by these evidences, a possibility of further corrective move
towards the strong support zone of 8480 - 8440 cannot be ruled
out. However, traders should now keep in mind an important
overnight development on the domestic front. The Rajya Sabha
has finally passed much awaited GST Constitutional Amendment
Bill and thus, we may see some volatility in the market. Today,
first hour move would be crucial for the market as failure to
sustain above 8570 - 8610 may lead to some weakness, whereas
on the other hand, if Nifty manages to surpass the
8610
convincingly then we may expect some immediate bounce in the
market.
Key Levels
Support 1 - 8480
Resistance 1 - 8570
Support 2 - 8440
Resistance 2 - 8610
Nifty Bank Outlook - (18602)
Exhibit 2: Nifty Bank Hourly Chart
Post flat opening, the Nifty Bank index traded in a narrow range
during initial hour yesterday. However, the index gradually
declined during later half and ended the session with loss of 0.57
percent over its previous close.
In last three trading sessions, the Nifty Bank index has shown
some signs of weakness and hence, we have been advising
traders to remain light on positions. Although the SGX Nifty is
indicating positive opening tracking the GST development, it
would be crucial to watch whether the banking index manages to
sustain at higher levels post opening. On hourly chart, the
resistances for the index are seen around 18720 and 18850. If
the index fails to show a sustained up move post initial hour of
trading, then the index could correct and test the support placed
around 18450 (200 SMA on hourly chart). The volatility is
expected to remain high and thus traders are advised to trade
according the moves post initial hour of trading.
Key Levels
Support 1 - 18450
Resistance 1 - 18720
Support 2 - 18300
Resistance 2 - 18850
1
Technical & Derivatives Report
August 04, 2016
Comments
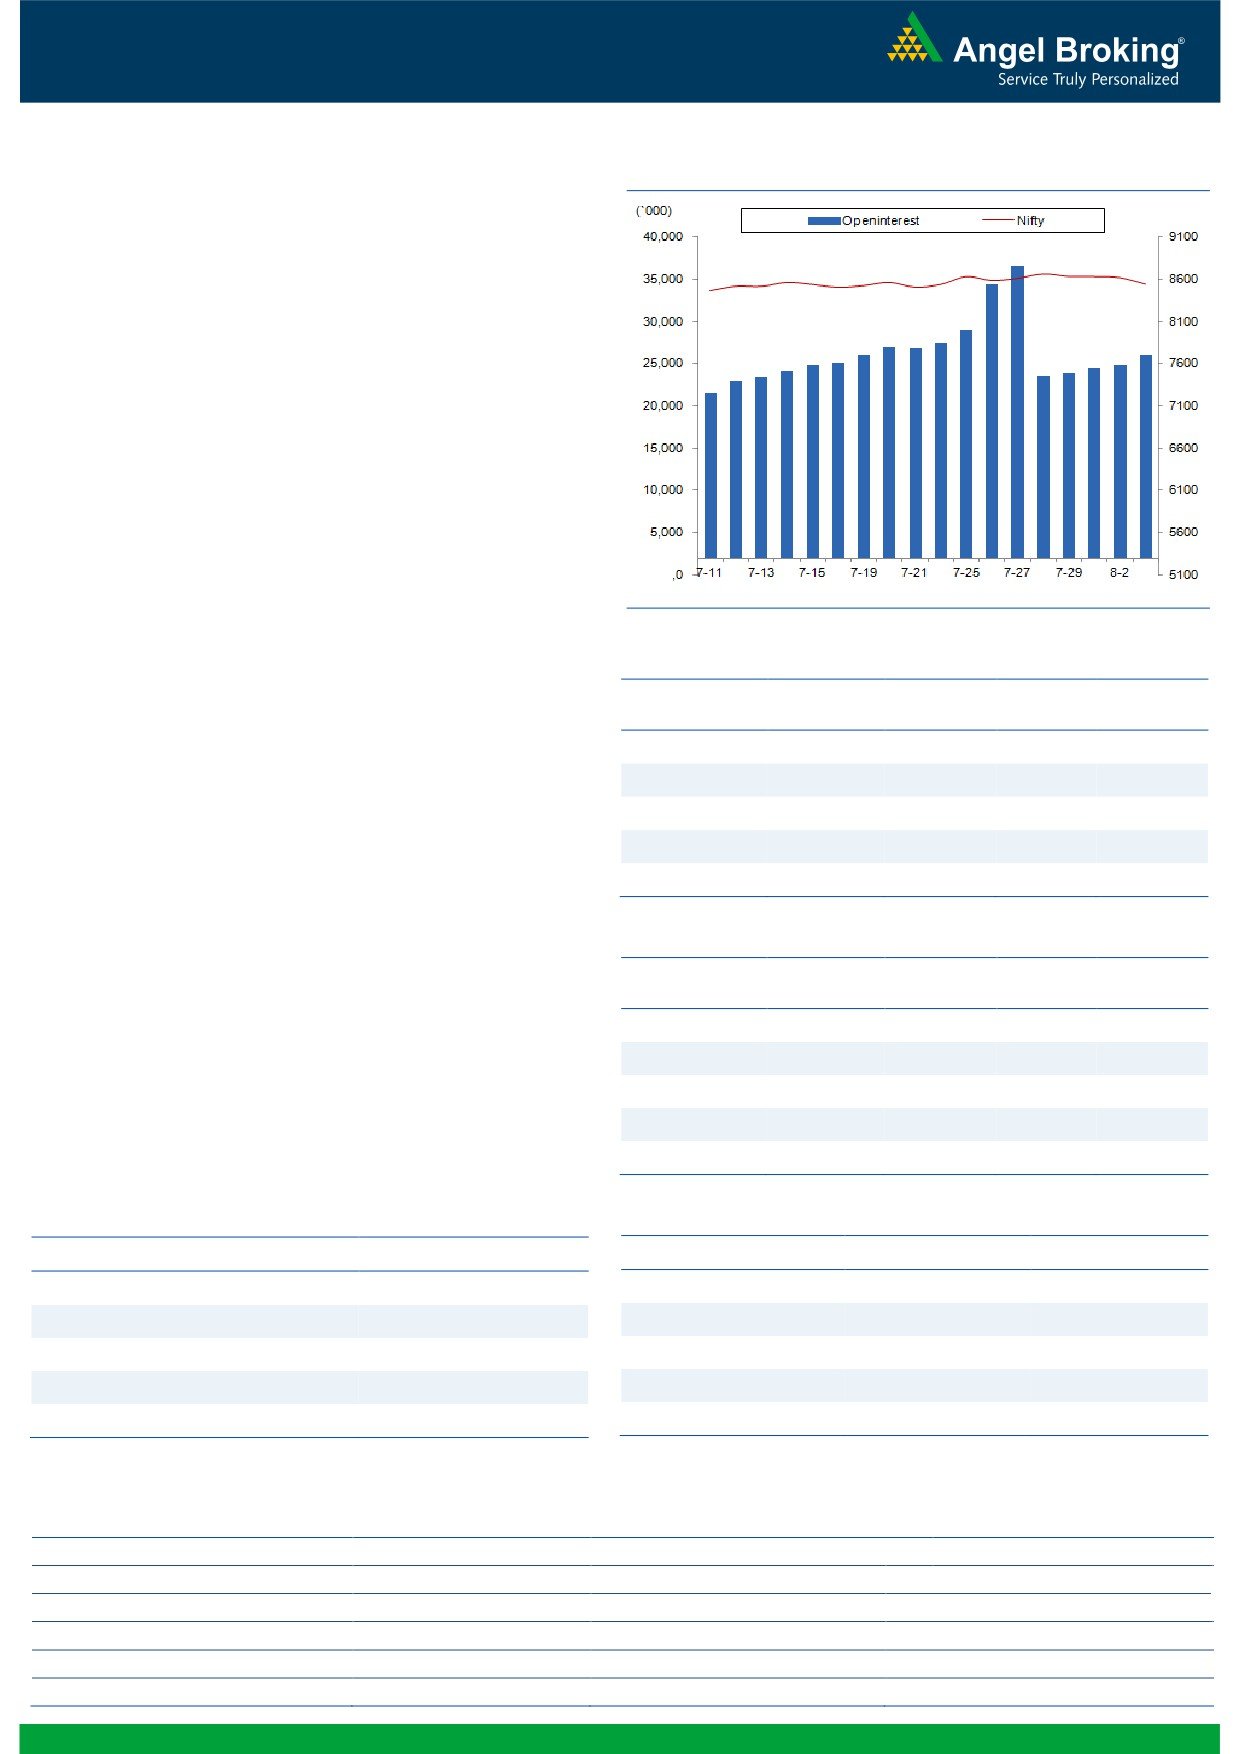
Nifty Vs OI
The Nifty futures open interest has increased by 5.19%
BankNifty futures open interest has increased by 2.50%
as market closed at 8544.85 levels.
The Nifty August future closed with a premium of 37.70
points against a premium of 37.40 points in previous
session. The September series closed at a premium of
86.45 points.
The Implied Volatility of at the money options has
increased from 14.64% to 15.18%.
The total OI of the market is Rs. 2,47,570/- cr. and the
stock futures OI is Rs. 71,326/- cr.
Few of the liquid counters where we have seen high cost
of carry are JPASSOCIAT, GMRINFRA, HDFCBANK,
FEDERALBNK and AMBUJACEM.
Views
OI Gainers
FIIs were net buyer in cash market segment to the tune of
OI
PRICE
Rs.
578 crores. While, in Index Futures they were
SCRIP
OI
PRICE
CHG. (%)
CHG. (%)
marginal sellers with rise in open interest, indicating
GODREJIND
1473000
18.60
411.50
-4.88
blend of both long and short build-up.
PCJEWELLER
525000
15.13
402.25
-6.03
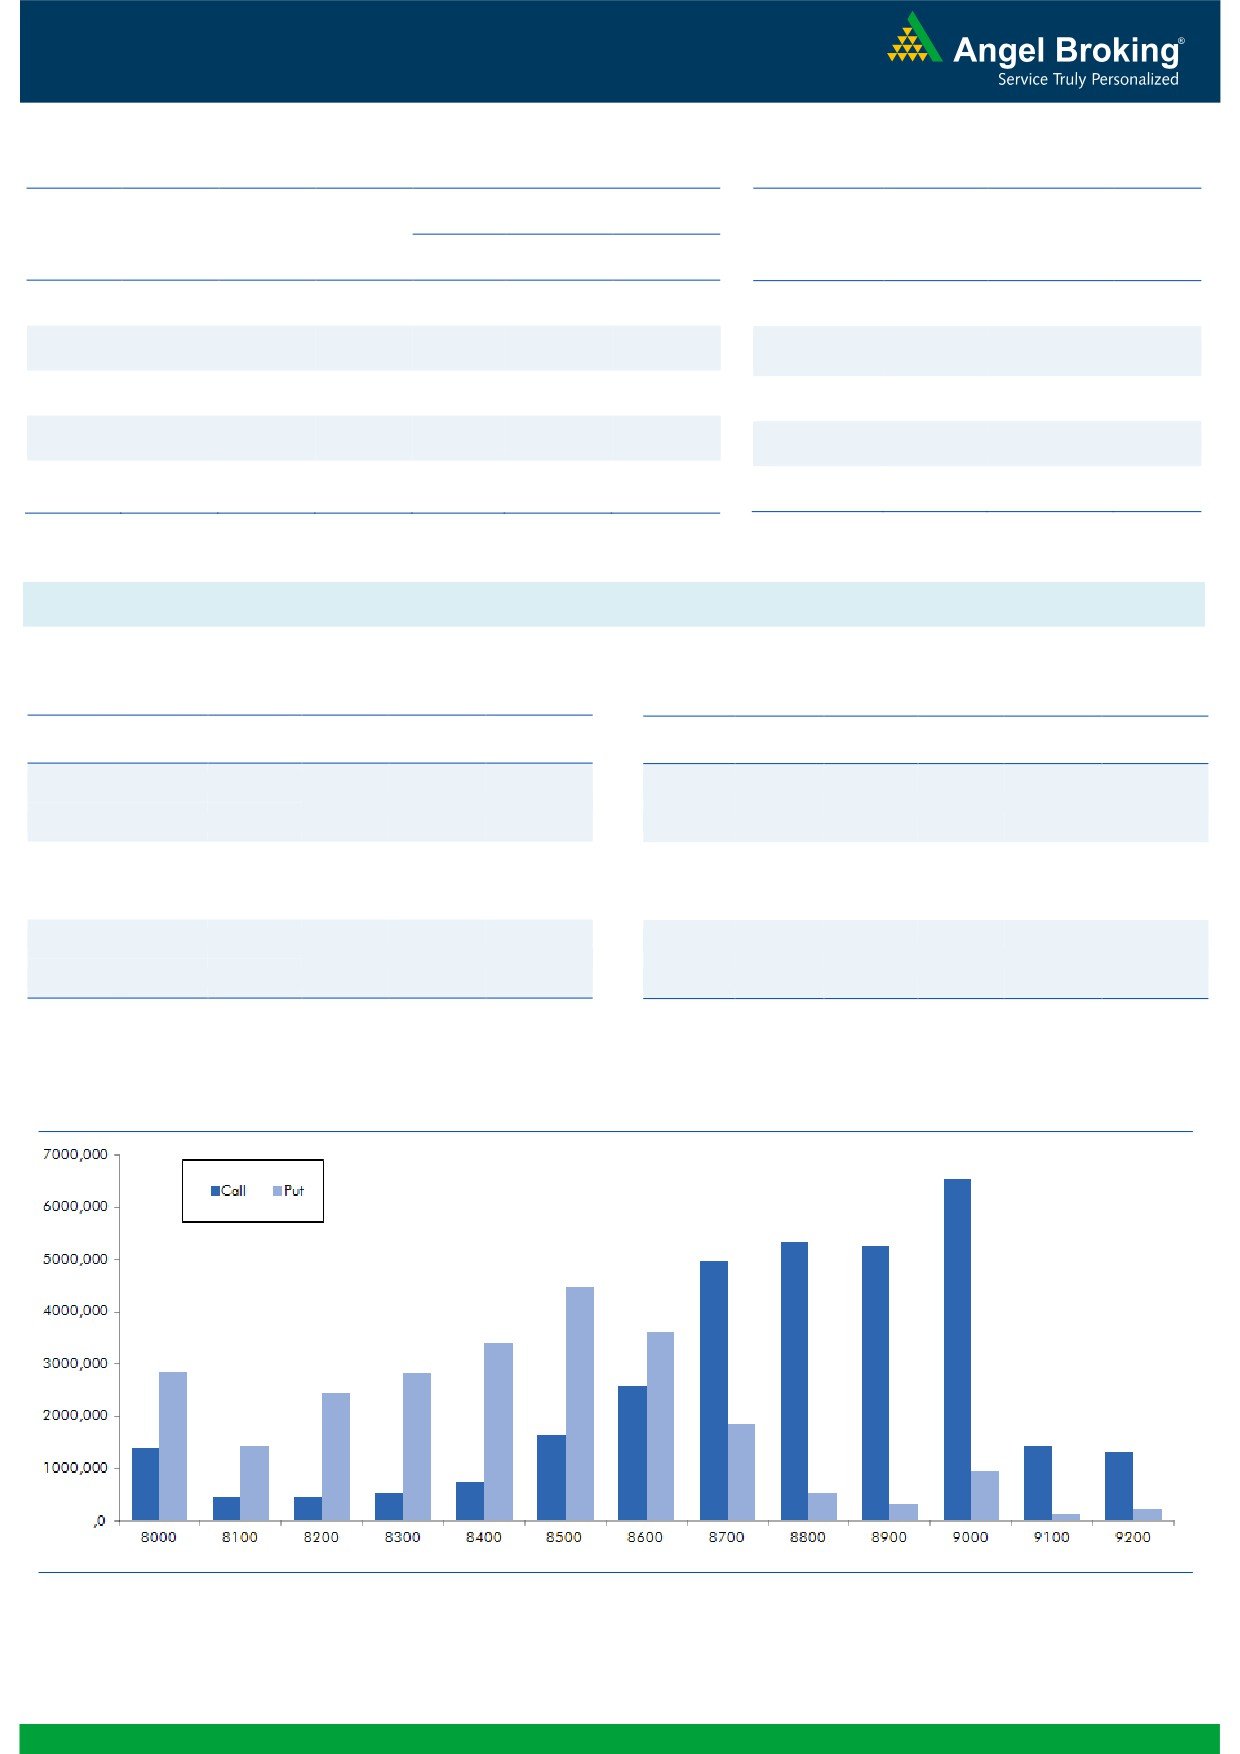
In Index Options segment, FIIs bought worth Rs. 432
crores with rise in OI. In call options, 8600-9000 strikes
ABIRLANUVO
3235500
12.84
1504.10
2.60
added good amount of build-up. We have been
EICHERMOT
207150
12.25
21515.15
-2.14
continuously observing FIIs writing out of the money call
MCDOWELL-N
2637500
10.96
2330.65
-3.09
strikes 8800-9000, indicating wall of resistance near
8800-8850 levels. While, 8300-8400 put strikes were
OI Losers
active and they also added some fresh OI. Highest build-
OI
PRICE
SCRIP
OI
PRICE
up is placed at 9000 call and 8500 put options.
CHG. (%)
CHG. (%)
Since, FIIs are continuously buying in both cash & index
JETAIRWAYS
6209000
-6.52
595.00
2.38
futures and yet there is no sign of reversal seen on
ALBK
11540000
-5.18
75.85
-0.72
derivative data; we advise traders to trade with positive
IDFC
68257200
-5.05
57.05
-1.89
bias and use declines to initiate fresh positions. Support
TVSMOTOR
5858000
-4.90
298.60
-1.04
for Nifty is placed at
8500
-
8550 levels; while,
CROMPGREAV
17268000
-4.89
75.10
-3.03
resistance is at 8800 - 8850.
Historical Volatility
Put-Call Ratio
SCRIP
HV
SCRIP
PCR-OI
PCR-VOL
GODREJIND
38.53
NIFTY
0.87
0.79
VOLTAS
45.04
BANKNIFTY
0.49
0.60
COLPAL
27.19
ICICIBANK
0.36
0.33
BAJFINANCE
73.65
LT
0.49
0.52
PAGEIND
46.20
INFY
0.29
0.34
Strategy Date
Symbol
Strategy
Status
01-08-2016
RELIANCE
Ratio Bear Put Spread
Active
2
Technical & Derivatives Report
August 04, 2016
FII Statistics for 03-August 2016
Turnover on 03-August 2016
Open Interest
No. of
Turnover
Change
Detail
Buy
Sell
Net
Instrument
Value
Contracts
( in Cr. )
(%)
Contracts
Change (%)
(in Cr.)
INDEX
INDEX
2440.74
2473.45
(32.71)
304506
19940.55
1.77
252904
17107.98
36.15
FUTURES
FUTURES
INDEX
INDEX
44614.32
44182.63
431.69
875218
56472.36
5.34
3341977
233629.89
30.39
OPTIONS
OPTIONS
STOCK
5719.11
7027.14
(1308.03)
832516
53274.37
2.15
STOCK
FUTURES
578456
39384.27
-4.11
FUTURES
STOCK
STOCK
3618.39
3686.03
(67.64)
56397
3682.38
17.16
OPTIONS
302611
20994.72
-4.10
OPTIONS
TOTAL
56392.56
57369.25
(976.69)
2068637
133369.66
3.79
TOTAL
4475948
311116.86
22.15
Nifty Spot = 8544.85
Lot Size = 75
Bull-Call Spreads
Bear-Put Spreads
Action
Strike
Price
Risk
Reward
BEP
Action
Strike
Price
Risk
Reward
BEP
Buy
8600
119.75
Buy
8500
93.70
42.90
57.10
8642.90
31.20
68.80
8468.80
Sell
8700
76.85
Sell
8400
62.50
Buy
8600
119.75
Buy
8500
93.70
73.80
126.20
8673.80
52.85
147.15
8447.15
Sell
8800
45.95
Sell
8300
40.85
Buy
8700
76.85
Buy
8400
62.50
30.90
69.10
8730.90
21.65
78.35
8378.35
Sell
8800
45.95
Sell
8300
40.85
Note: Above mentioned Bullish or Bearish Spreads in Nifty (August Series) are given as an information and not as a recommendation.
Nifty Put-Call Analysis
3
Technical & Derivatives Report
August 04, 2016
Daily Pivot Levels for Nifty Constituents
Scrips
S2
S1
PIVOT
R1
R2
ACC
1,648
1,658
1,672
1,682
1,695
ADANIPORTS
217
220
224
227
231
AMBUJACEM
256
259
263
266
270
ASIANPAINT
1,115
1,129
1,138
1,152
1,161
AUROPHARMA
711
729
758
776
805
AXISBANK
536
542
548
555
560
BAJAJ-AUTO
2,673
2,694
2,726
2,747
2,780
BANKBARODA
144
146
151
153
157
BHEL
129
131
135
137
141
BPCL
559
566
575
581
590
BHARTIARTL
350
355
358
362
365
INFRATEL
383
390
394
401
405
BOSCH
24,084
24,419
24,659
24,994
25,234
CIPLA
507
518
527
538
546
COALINDIA
319
323
326
329
332
DRREDDY
2,902
2,920
2,949
2,967
2,996
EICHERMOT
20,669
21,019
21,590
21,939
22,511
GAIL
366
369
374
377
381
GRASIM
4,887
4,928
4,969
5,009
5,051
HCLTECH
792
809
834
851
876
HDFCBANK
1,222
1,231
1,240
1,250
1,259
HDFC
1,302
1,314
1,328
1,340
1,354
HEROMOTOCO
3,165
3,198
3,253
3,287
3,342
HINDALCO
132
134
136
137
139
HINDUNILVR
899
907
917
924
934
ICICIBANK
237
239
243
246
250
IDEA
102
103
105
106
107
INDUSINDBK
1,163
1,171
1,182
1,190
1,201
INFY
1,064
1,075
1,081
1,091
1,097
ITC
246
249
255
258
263
KOTAKBANK
749
753
758
762
768
LT
1,442
1,460
1,489
1,507
1,535
LUPIN
1,646
1,663
1,691
1,708
1,735
M&M
1,423
1,435
1,452
1,464
1,482
MARUTI
4,749
4,811
4,916
4,978
5,083
NTPC
155
156
158
159
161
ONGC
215
217
220
222
225
POWERGRID
171
173
176
179
182
RELIANCE
977
986
1,000
1,008
1,023
SBIN
223
225
228
230
232
SUNPHARMA
810
825
836
851
862
TCS
2,618
2,637
2,668
2,687
2,718
TATAMTRDVR
302
308
318
323
333
TATAMOTORS
460
469
484
493
508
TATAPOWER
70
71
72
72
73
TATASTEEL
348
353
360
365
371
TECHM
487
492
498
503
509
ULTRACEMCO
3,623
3,645
3,673
3,695
3,722
WIPRO
542
545
550
553
558
YESBANK
1,205
1,221
1,233
1,248
1,260
ZEEL
483
488
494
498
504
4
Technical & Derivatives Report
August 04, 2016
Research Team Tel: 022 - 39357800
For Technical Queries
For Derivatives Queries
DISCLAIMER
Angel Broking Private Limited (hereinafter referred to as “Angel”) is a registered Member of National Stock Exchange of India Limited,
Bombay Stock Exchange Limited and Metropolitan Stock Exchange Limited. It is also registered as a Depository Participant with CDSL
and Portfolio Manager with SEBI. It also has registration with AMFI as a Mutual Fund Distributor. Angel Broking Private Limited is a
registered entity with SEBI for Research Analyst in terms of SEBI (Research Analyst) Regulations, 2014 vide registration number
INH000000164. Angel or its associates has not been debarred/ suspended by SEBI or any other regulatory authority for accessing
/dealing in securities Market. Angel or its associates/analyst has not received any compensation / managed or co-managed public
offering of securities of the company covered by Analyst during the past twelve months.
This document is solely for the personal information of the recipient, and must not be singularly used as the basis of any investment
decision. Nothing in this document should be construed as investment or financial advice. Each recipient of this document should
make such investigations as they deem necessary to arrive at an independent evaluation of an investment in the securities of the
companies referred to in this document (including the merits and risks involved), and should consult their own advisors to determine
the merits and risks of such an investment.
Reports based on technical and derivative analysis center on studying charts of a stock's price movement, outstanding positions and
trading volume, as opposed to focusing on a company's fundamentals and, as such, may not match with a report on a company's
fundamentals. Investors are advised to refer the Fundamental and Technical Research Reports available on our website to evaluate the
contrary view, if any.
The information in this document has been printed on the basis of publicly available information, internal data and other reliable
sources believed to be true, but we do not represent that it is accurate or complete and it should not be relied on as such, as this
document is for general guidance only. Angel Broking Pvt. Limited or any of its affiliates/ group companies shall not be in any way
responsible for any loss or damage that may arise to any person from any inadvertent error in the information contained in this report.
Angel Broking Pvt. Limited has not independently verified all the information contained within this document. Accordingly, we cannot
testify, nor make any representation or warranty, express or implied, to the accuracy, contents or data contained within this document.
While Angel Broking Pvt. Limited endeavors to update on a reasonable basis the information discussed in this material, there may be
regulatory, compliance, or other reasons that prevent us from doing so.
This document is being supplied to you solely for your information, and its contents, information or data may not be reproduced,
redistributed or passed on, directly or indirectly.
Neither Angel Broking Pvt. Limited, nor its directors, employees or affiliates shall be liable for any loss or damage that may arise from
or in connection with the use of this information.
5