Technical & Derivatives Report
July 04, 2016
Sensex (27145) / Nifty (8328)
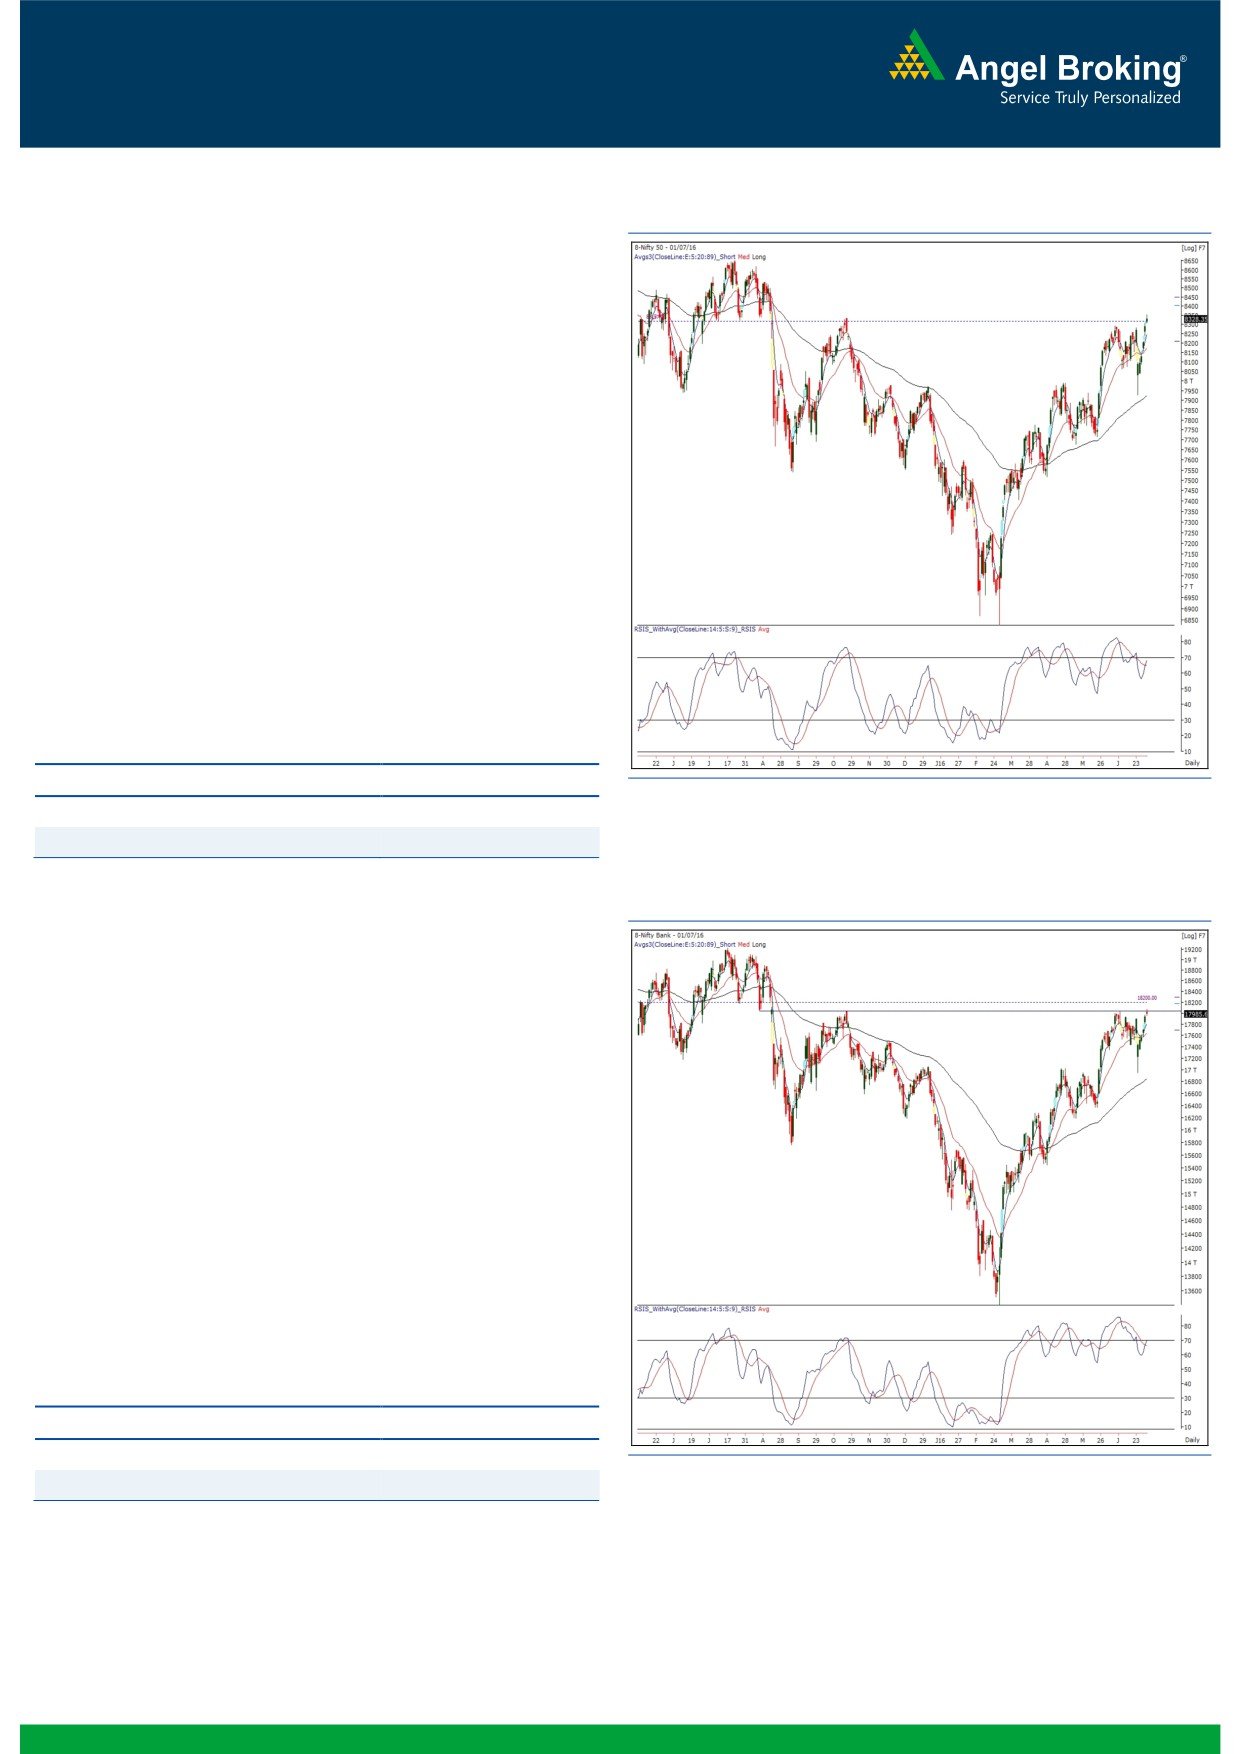
Exhibit 1: Nifty Daily Chart
We saw a clear outperformance by our market in the concluded
week post the unfolding of the BREXIT event. In fact, the strength
in the momentum led the Nifty to breakout beyond the 8300
mark on a closing basis and post its highest closing of the
calendar year 2016.
Now if we meticulously observe the daily as well as the weekly
charts, the next major resistance stands as far as 8654.75 (July
2015 high). In addition, one of the noteworthy observations is
that the ‘RSI-Smoothened’ oscillator on the weekly chart has just
crossed the 70 mark, which certainly bodes well for the market in
the near term. Thus, looking at the ongoing strong up trend, we
expect the Nifty to gradually move towards this next hurdle.
Going forward, 8240 - 8200 are now seen as immediate support
levels and resistance would be seen at 8420 - 8510 for the
forthcoming week. Meanwhile, traders can continue to follow a
stock-centric approach to find potential trades.
Key Levels
Support 1 - 8240
Resistance 1 - 8420
Support 2 - 8200
Resistance 2 - 8510
Exhibit 2: Nifty Bank Daily Chart
Nifty Bank Outlook - (17986)
Post the ‘Brexit’ referendum, the Nifty Bank index posted positive
close for five consecutive sessions. In the week gone by, the Nifty
Bank index rallied smartly and gained 3.21% over its last weeks
close.
Since last few day's, banking index has move higher and has
closed near its strong resistance zone of 18050 - 18200. It would
be crucial to watch whether the index continues this trend and if
the index breaches the mentioned resistance on closing basis,
then the rally could continue upto 18600 - 18800 levels in near
term. The individual stock charts are indicating a positive structure
and hence traders should trade with positive bias and avoid
taking any contra position at current juncture. The intraday
support for the index is placed around 17890 and 17730
whereas resistance are seen around 18075 and 18200.
Key Levels
Support 1 - 17890
Resistance 1 - 18075
Support 2 - 17730
Resistance 2 - 18200
1
Technical & Derivatives Report
July 04, 2016
Comments
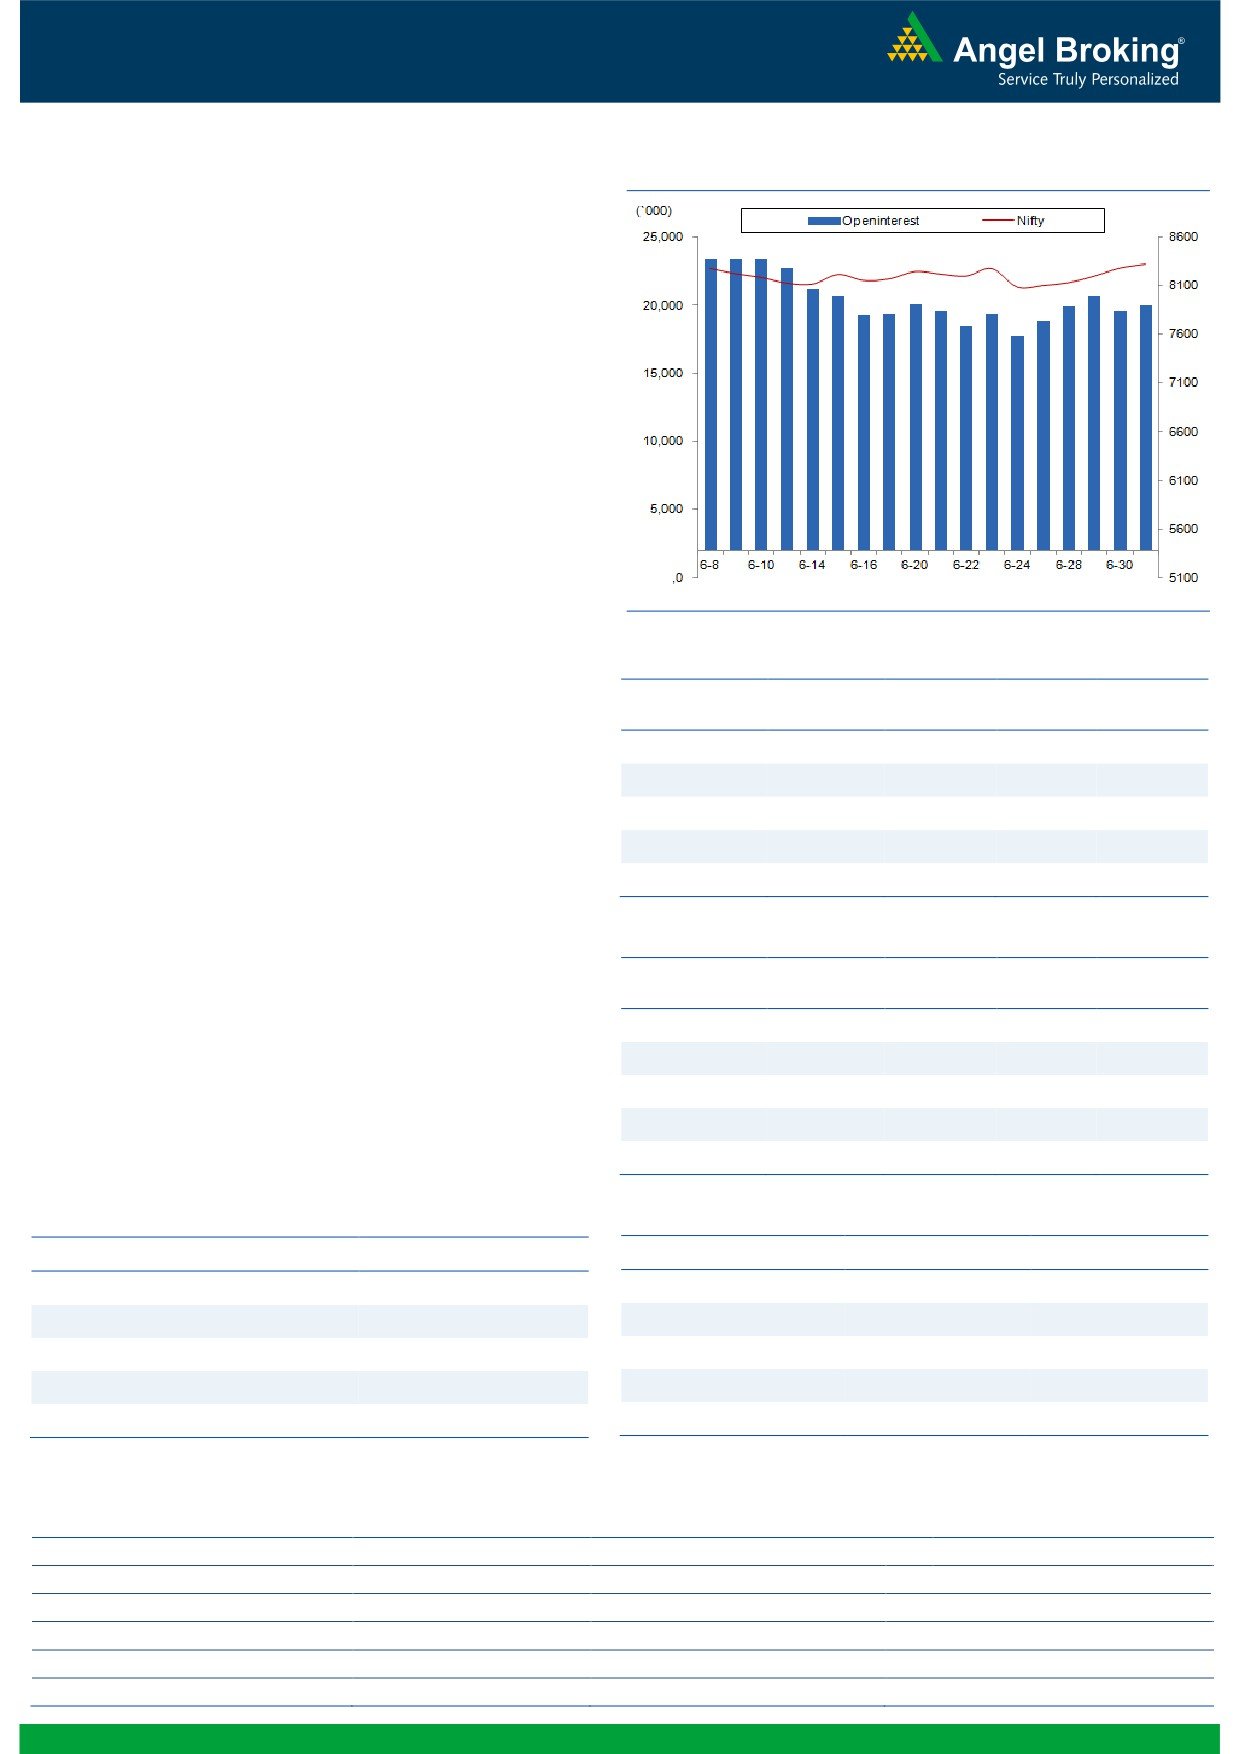
Nifty Vs OI
The Nifty futures open interest has increased by 2.15%
BankNifty futures open interest has increased by 0.08%
as market closed at 8328.35 levels.
The Nifty July future closed with a premium of 26.80
points against a premium of 33.30 points in previous
session. The August series closed at a premium of 57.95
points.
The Implied Volatility of at the money options has
decreased from 14.76% to 14.36%.
The total OI of the market is Rs. 1,92,806/- cr. and the
stock futures OI is Rs. 61,460/- cr.
Few of the liquid counters where we have seen high cost
of carry are UNITECH, JPASSOCIAT, SOUTHBANK, IDFC
and IFCI.
Views
OI Gainers
Despite the upmove in the Nifty, FIIs were marginal
OI
PRICE
SCRIP
OI
PRICE
sellers in cash market segment on Friday. While in Index
CHG. (%)
CHG. (%)
Futures, they were net buyers worth Rs. 254 crores with
KPIT
4188000
103.30
158.40
-14.77
rise in open interest, indicating formation of long
ITC
36626400
40.08
254.15
-31.49
positions in previous trading session.
MCLEODRUSS
3207000
37.23
211.35
9.42
On Index Options front, FIIs bought worth Rs. 901 crores
HINDZINC
3987200
22.04
178.30
-1.49
with significant rise in open interest.
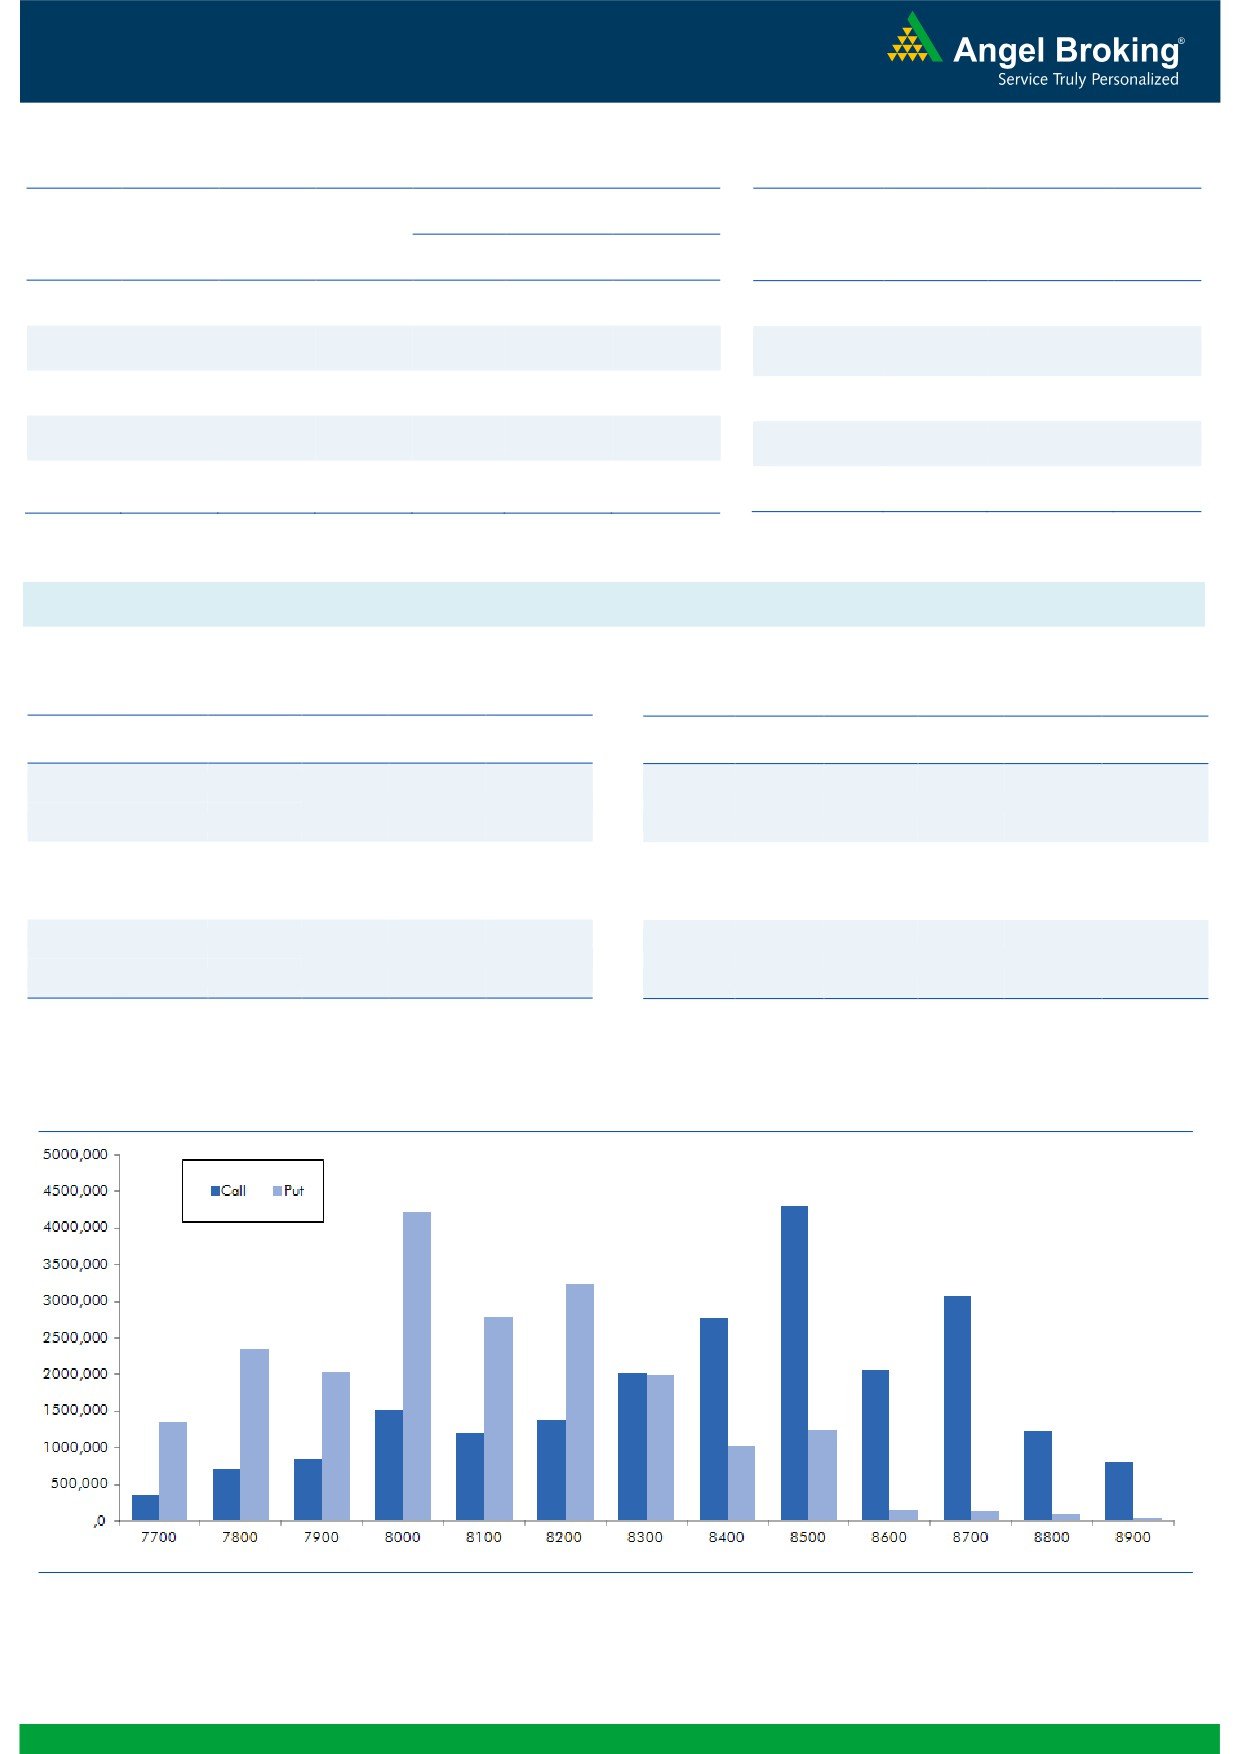
In Call options,
VOLTAS
3900000
21.34
319.90
-1.17
good amount of OI addition was seen in 8500 - 8600
strikes, followed by some build-up in 8700 and 8900
strikes. On the other hand in Put options, 8200 and
OI Losers
8300 strikes added huge fresh positions. Maximum open
OI
PRICE
SCRIP
OI
PRICE
CHG. (%)
CHG. (%)
interest in current series is placed at 8500 call and 8000
TORNTPHARM
172800
-8.28
1399.25
1.17
put.
BOSCHLTD
86650
-5.82
22754.55
-0.14
Since, FIIs are continuously buying in index futures; we
are expecting Nifty to continue its upward momentum in
CAIRN
13013000
-3.60
142.25
2.74
upcoming sessions too. Hence, traders are advised to
GRASIM
913200
-3.40
4651.85
-0.45
trade with positive bias.
UPL
8928000
-3.31
562.35
1.45
Historical Volatility
Put-Call Ratio
SCRIP
HV
SCRIP
PCR-OI
PCR-VOL
IOC
43.21
NIFTY
0.98
0.97
MCLEODRUSS
56.50
BANKNIFTY
1.20
0.98
TATACHEM
26.11
SBIN
0.67
0.64
CASTROLIND
28.68
RELIANCE
0.56
0.34
PFC
37.23
SUNPHARMA
0.38
0.33
Strategy Date
Symbol
Strategy
Status
2
Technical & Derivatives Report
July 04, 2016
FII Statistics for 01-July 2016
Turnover on 01-July 2016
Open Interest
No. of
Turnover
Change
Detail
Buy
Sell
Net
Instrument
Value
Contracts
( in Cr. )
(%)
Contracts
Change (%)
(in Cr.)
INDEX
INDEX
1188.85
934.54
254.32
221329
14117.61
2.97
187758
12341.28
-64.29
FUTURES
FUTURES
INDEX
INDEX
17792.86
16891.37
901.49
706172
44213.29
5.54
1797763
117203.87
-81.11
OPTIONS
OPTIONS
STOCK
5099.21
5080.41
18.80
761764
47378.28
1.39
STOCK
FUTURES
505787
32644.59
-59.44
FUTURES
STOCK
STOCK
1789.94
1675.13
114.81
18680
1175.98
1280.64
OPTIONS
214572
14295.13
-49.96
OPTIONS
TOTAL
25870.87
24581.46
1289.41
1707945
106885.16
4.35
TOTAL
2705880
176484.88
-76.90
Nifty Spot = 8328.35
Lot Size = 75
Bull-Call Spreads
Bear-Put Spreads
Action
Strike
Price
Risk
Reward
BEP
Action
Strike
Price
Risk
Reward
BEP
Buy
8400
105.25
Buy
8300
107.70
40.80
59.20
8440.80
31.85
68.15
8268.15
Sell
8500
64.45
Sell
8200
75.85
Buy
8400
105.25
Buy
8300
107.70
68.60
131.40
8468.60
55.05
144.95
8244.95
Sell
8600
36.65
Sell
8100
52.65
Buy
8500
64.45
Buy
8200
75.85
27.80
72.20
8527.80
23.20
76.80
8176.80
Sell
8600
36.65
Sell
8100
52.65
Note: Above mentioned Bullish or Bearish Spreads in Nifty (July Series) are given as an information and not as a recommendation.
Nifty Put-Call Analysis
3
Technical & Derivatives Report
July 04, 2016
Daily Pivot Levels for Nifty Constituents
Scrips
S2
S1
PIVOT
R1
R2
ACC
1,604
1,611
1,618
1,625
1,633
ADANIPORTS
201
203
205
207
209
AMBUJACEM
249
251
254
256
259
ASIANPAINT
987
995
1,003
1,011
1,019
AUROPHARMA
737
742
747
752
757
AXISBANK
531
537
541
547
552
BAJAJ-AUTO
2,631
2,651
2,685
2,706
2,740
BANKBARODA
152
154
156
158
160
BHEL
127
130
131
134
135
BPCL
1,052
1,072
1,087
1,107
1,122
BHARTIARTL
358
363
368
373
378
INFRATEL
341
346
350
354
358
BOSCH
22,309
22,497
22,698
22,886
23,087
CIPLA
496
502
506
512
516
COALINDIA
307
308
311
313
316
DRREDDY
3,398
3,441
3,473
3,517
3,549
EICHERMOT
18,819
18,987
19,218
19,387
19,618
GAIL
382
389
393
399
404
GRASIM
4,601
4,622
4,649
4,670
4,696
HCLTECH
726
729
733
736
740
HDFCBANK
1,164
1,169
1,177
1,182
1,190
HDFC
1,223
1,232
1,248
1,258
1,273
HEROMOTOCO
3,143
3,165
3,181
3,203
3,219
HINDALCO
122
123
124
126
127
HINDUNILVR
878
888
896
906
915
ICICIBANK
238
239
241
242
244
IDEA
105
105
106
107
108
INDUSINDBK
1,113
1,118
1,123
1,129
1,134
INFY
1,164
1,168
1,174
1,178
1,184
ITC
234
243
252
261
269
KOTAKBANK
742
748
757
763
772
LT
1,485
1,514
1,529
1,558
1,574
LUPIN
1,534
1,544
1,551
1,561
1,568
M&M
1,414
1,439
1,457
1,481
1,499
MARUTI
4,088
4,127
4,171
4,209
4,253
NTPC
154
155
156
158
159
ONGC
210
218
224
231
237
POWERGRID
161
163
165
167
168
RELIANCE
967
970
973
977
980
SBIN
218
219
220
221
222
SUNPHARMA
758
760
765
768
772
TCS
2,450
2,475
2,520
2,546
2,590
TATAMTRDVR
286
289
293
296
300
TATAMOTORS
449
453
459
464
469
TATAPOWER
73
74
74
75
75
TATASTEEL
324
326
328
331
333
TECHM
501
506
511
517
522
ULTRACEMCO
3,335
3,375
3,425
3,465
3,515
WIPRO
552
556
560
564
568
YESBANK
1,096
1,113
1,123
1,140
1,151
ZEEL
445
449
454
458
464
4
Technical & Derivatives Report
July 04, 2016
Research Team Tel: 022 - 39357800
For Technical Queries
For Derivatives Queries
DISCLAIMER
Angel Broking Private Limited (hereinafter referred to as “Angel”) is a registered Member of National Stock Exchange of India Limited,
Bombay Stock Exchange Limited and MCX Stock Exchange Limited. It is also registered as a Depository Participant with CDSL and
Portfolio Manager with SEBI. It also has registration with AMFI as a Mutual Fund Distributor. Angel Broking Private Limited is a
registered entity with SEBI for Research Analyst in terms of SEBI (Research Analyst) Regulations, 2014 vide registration number
INH000000164. Angel or its associates has not been debarred/ suspended by SEBI or any other regulatory authority for accessing
/dealing in securities Market. Angel or its associates including its relatives/analyst do not hold any financial interest/beneficial
ownership of more than 1% in the company covered by Analyst. Angel or its associates/analyst has not received any compensation /
managed or co-managed public offering of securities of the company covered by Analyst during the past twelve months. Angel/analyst
has not served as an officer, director or employee of company covered by Analyst and has not been engaged in market making activity
of the company covered by Analyst.
This document is solely for the personal information of the recipient, and must not be singularly used as the basis of any investment
decision. Nothing in this document should be construed as investment or financial advice. Each recipient of this document should
make such investigations as they deem necessary to arrive at an independent evaluation of an investment in the securities of the
companies referred to in this document (including the merits and risks involved), and should consult their own advisors to determine
the merits and risks of such an investment.
Reports based on technical and derivative analysis center on studying charts of a stock's price movement, outstanding positions and
trading volume, as opposed to focusing on a company's fundamentals and, as such, may not match with a report on a company's
fundamentals.
The information in this document has been printed on the basis of publicly available information, internal data and other reliable
sources believed to be true, but we do not represent that it is accurate or complete and it should not be relied on as such, as this
document is for general guidance only. Angel Broking Pvt. Limited or any of its affiliates/ group companies shall not be in any way
responsible for any loss or damage that may arise to any person from any inadvertent error in the information contained in this report.
Angel Broking Pvt. Limited has not independently verified all the information contained within this document. Accordingly, we cannot
testify, nor make any representation or warranty, express or implied, to the accuracy, contents or data contained within this document.
While Angel Broking Pvt. Limited endeavors to update on a reasonable basis the information discussed in this material, there may be
regulatory, compliance, or other reasons that prevent us from doing so.
This document is being supplied to you solely for your information, and its contents, information or data may not be reproduced,
redistributed or passed on, directly or indirectly.
Neither Angel Broking Pvt. Limited, nor its directors, employees or affiliates shall be liable for any loss or damage that may arise from
or in connection with the use of this information.
Note: Please refer to the important ‘Stock Holding Disclosure' report on the Angel website (Research Section). Also, please refer to the
latest update on respective stocks for the disclosure status in respect of those stocks. Angel Broking Pvt. Limited and its affiliates may
have investment positions in the stocks recommended in this report.
5