Technical & Derivatives Report
February 04, 2016
Sensex (24223) / Nifty (7362)
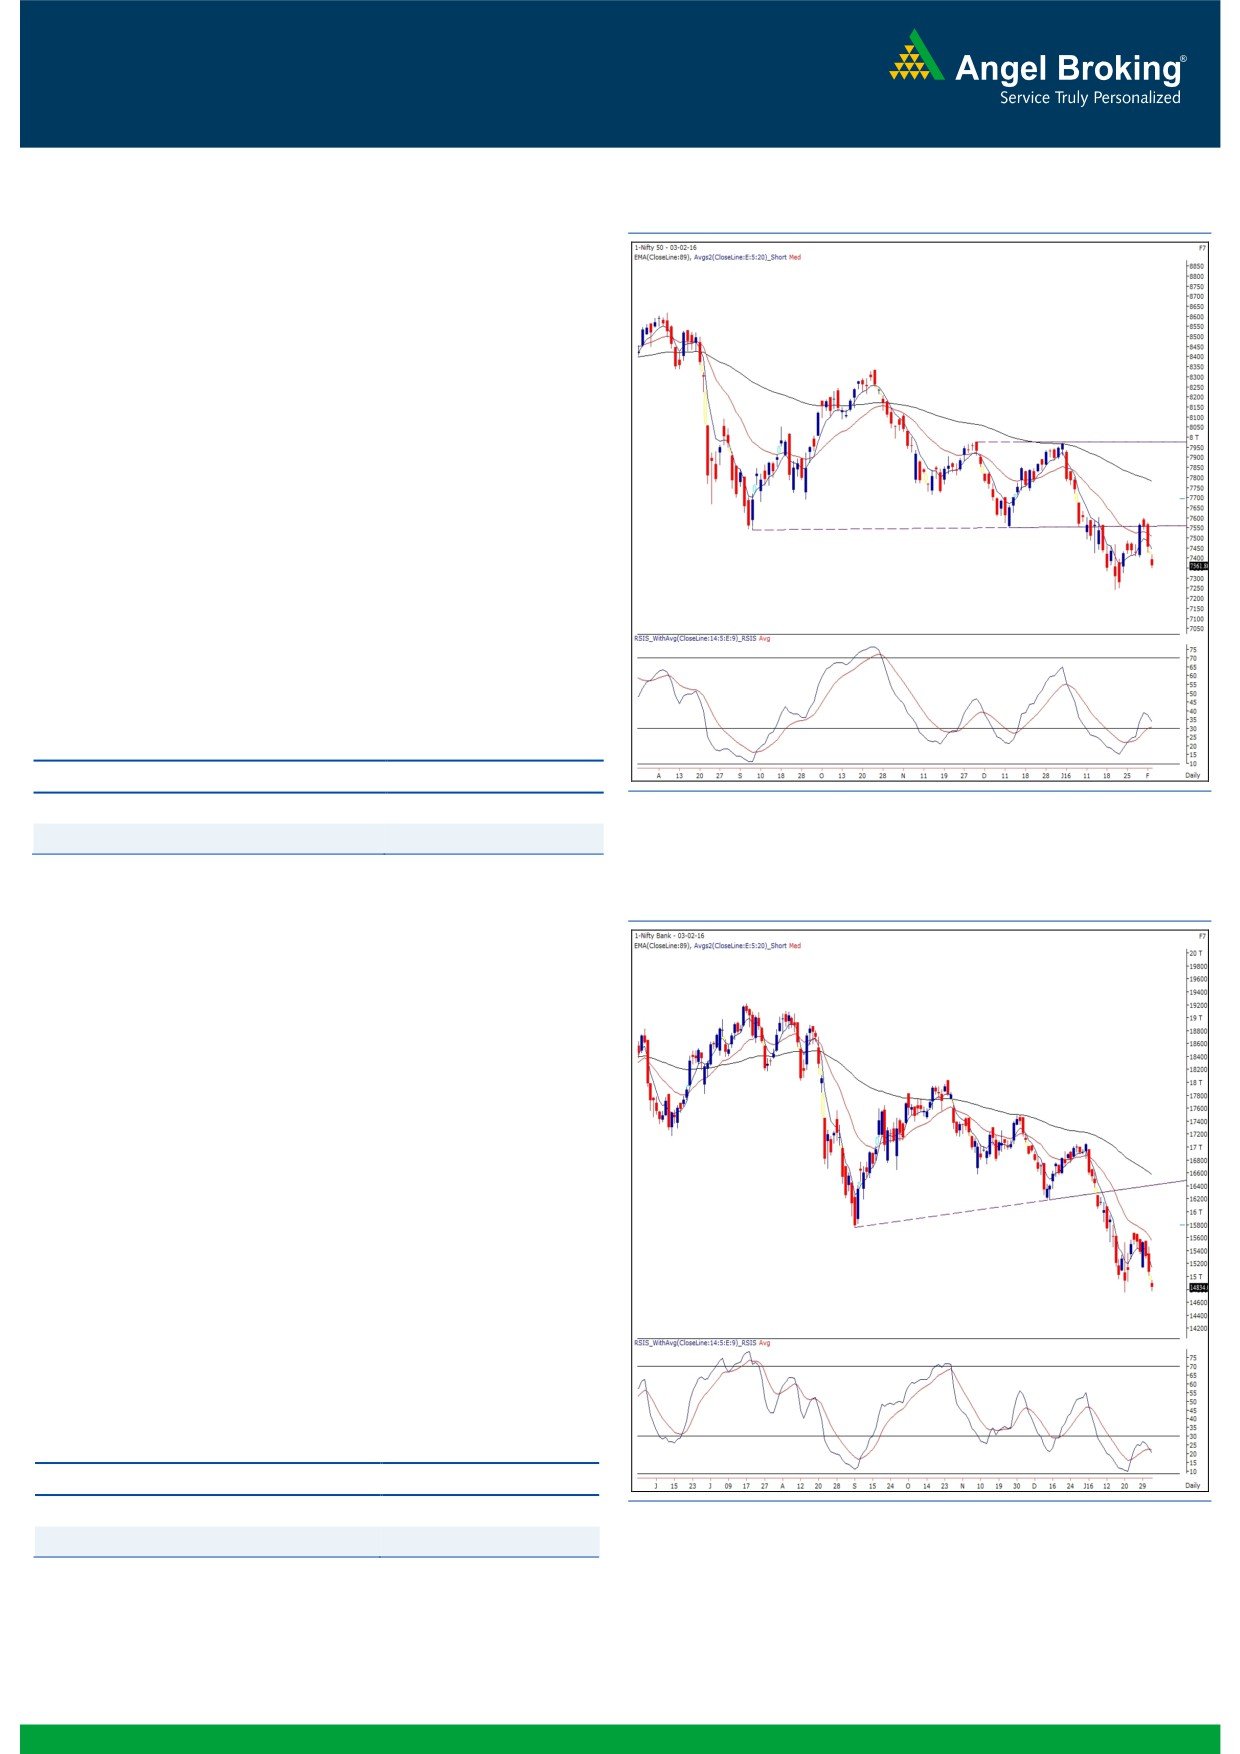
Exhibit 1: Nifty Daily Chart
Tuesday’s sharp sell-off was followed by a gap down opening
in our market owing to extremely negative cues from other
global bourses. Subsequently, index consolidated within a
narrow range and similar to the previous day, we saw late
selloff to end the session with more than a percent cut.
Yesterday, the Nifty struggled to stay beyond the 7400 mark
and thus, eventually the bears took a charge to end the
session almost at the lowest point of the day. We are still
reluctant to get carried away by this pessimism as we are
observing a strong support in the zone of 7380 and 7320,
which are 61.8% and 78.6% retracement of the recent up
move from 7241.50 to 7600.45, respectively. On the higher
side, an hourly closing above 7420 may result into some
intraday bounce towards 7460 - 7480 levels. Traders are
advised to stay light on positions and focus more on individual
stocks.
Key Levels
Support 1 - 7380
Resistance 1 - 7420
Support 2 - 7320
Resistance 2 -
7460
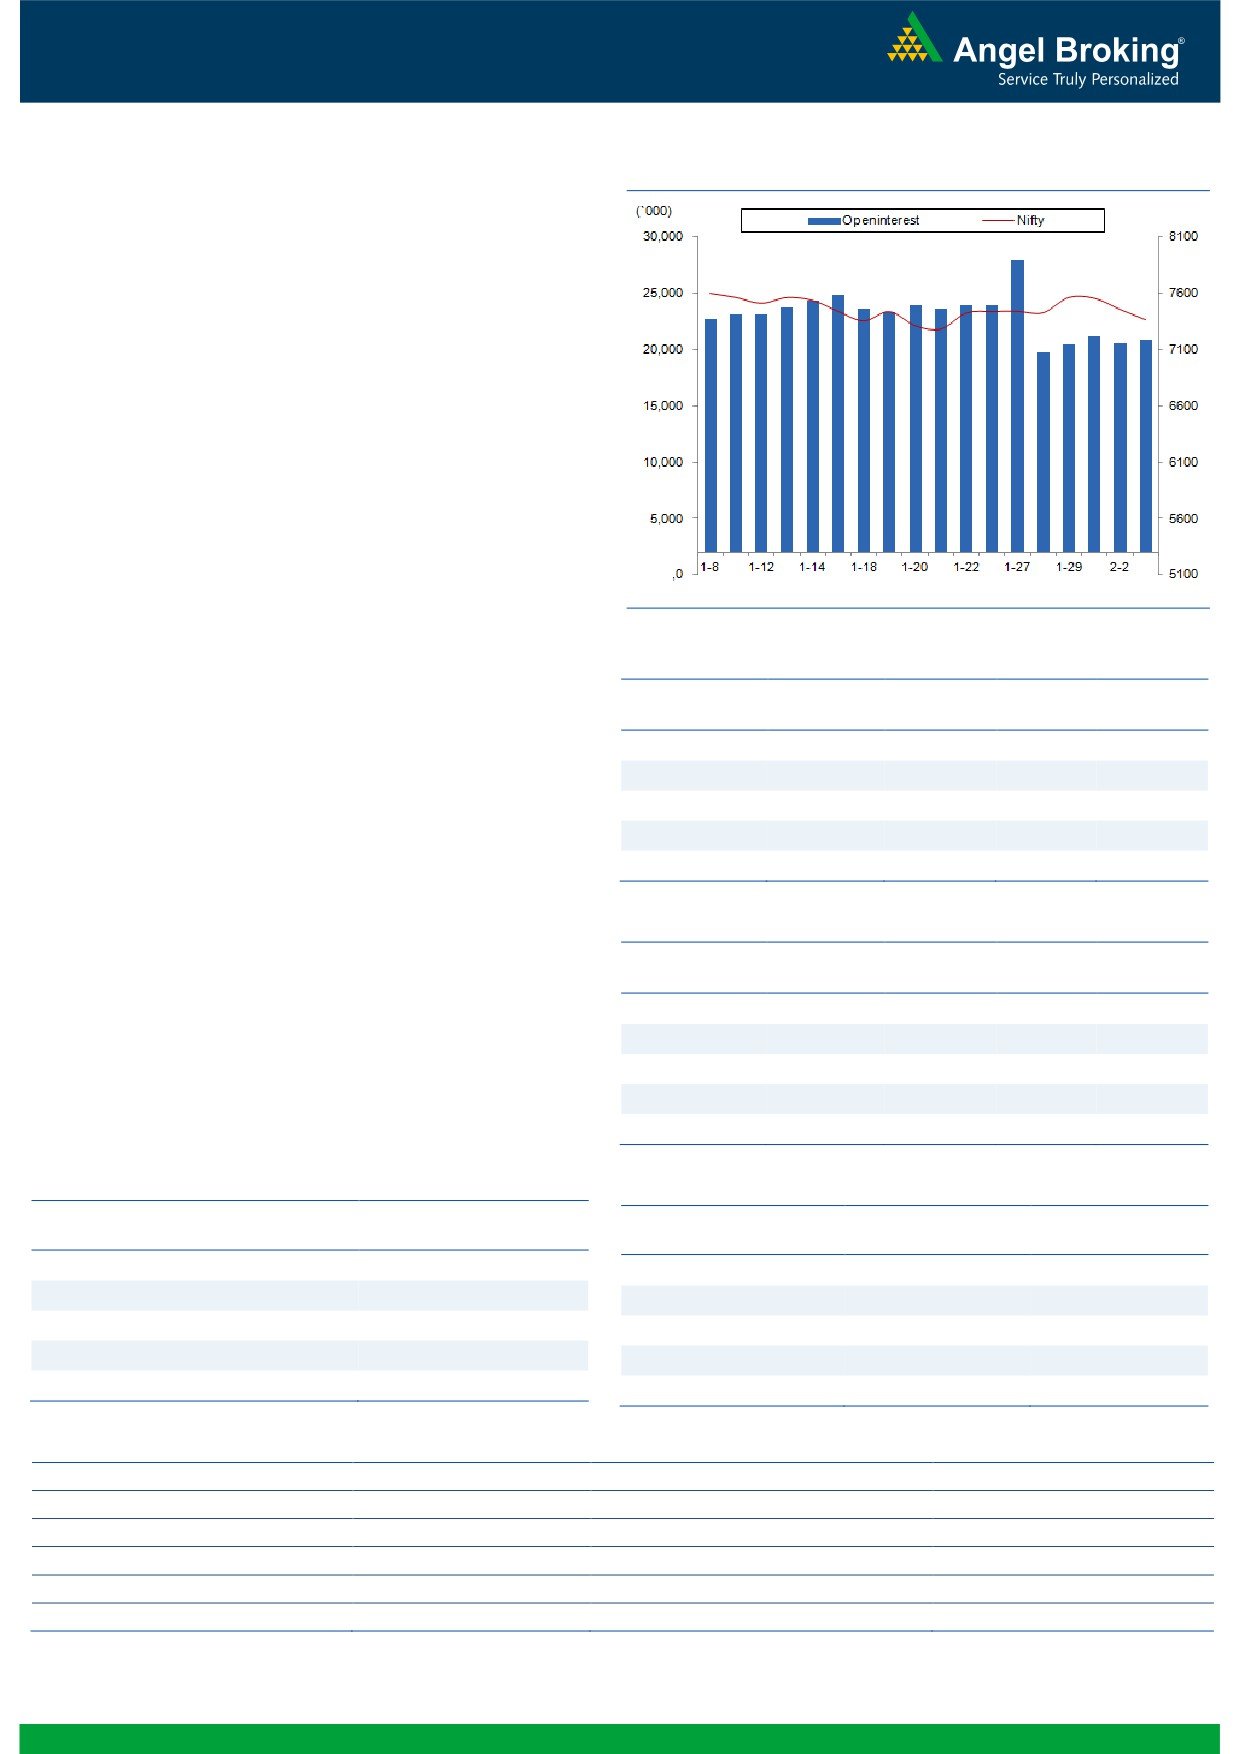
Exhibit 2: Bank Nifty Daily Chart
Bank Nifty Outlook - (14834)
In-line with our benchmark indices, the Nifty Bank index too
opened with a downside gap of around a percent and started
correcting from the initial trades. However, post the first hour
of trade, the banking index traded in a range for the
remaining part of the session. The trading bias throughout the
session remained negative and eventually, index ended the
session with a loss of 1.55 percent over its previous day.
Due to yesterday’s correction, the banking index has now
reached its lower end of the ‘Falling Channel’ on the daily
chart, which coincides with the previous swing low of 14755.
Going forward, immediate support for the index is placed at
14755 and 14600 levels; whereas, the resistance is seen at
15020 and 15280 levels. Traders are advised to remain light
and wait for further development on charts to initiate any
positional trade in the banking space.
Key Levels
Support 1 - 14755
Resistance 1 - 15020
Support 2 - 14600
Resistance 2 - 15280
1
Technical & Derivatives Report
February 04, 2016
Comments
Nifty Vs OI
The Nifty futures open interest has increased by 1.39%
BankNifty futures open interest has decreased by 0.50%
as market closed at 7361.80 levels.
The Nifty February future closed at a premium of 21.70
points against a premium of 19.40 points. The March
series closed at a premium of 36.30 points.
The Implied Volatility of at the money options has
increased from 16.36% to 16.91%.
The total OI of the market is Rs. 1,96,689/- cr. and the
stock futures OI is Rs. 58,670/- cr.
Few of the liquid counters where we have seen high cost
of carry are UNITECH, FEDERALBNK, MARUTI,
ASHOKLEY and KOTAKBANK.
Views
FIIs were net seller in cash segment to the tune of Rs. 357
OI Gainers
crores. While in Index Futures, they sold of Rs. 352
OI
PRICE
crores with marginal change in OI, indicating blend of
SCRIP
OI
PRICE
CHG. (%)
CHG. (%)
long unwinding and short formation in last trading
CROMPGREAV
21759000
46.02
130.35
-22.27
session.
BAJFINANCE
246875
29.25
6409.95
9.84
In Index Options front, FIIs were net buyers of Rs. 472
ACC
4059750
23.70
1246.60
-1.02
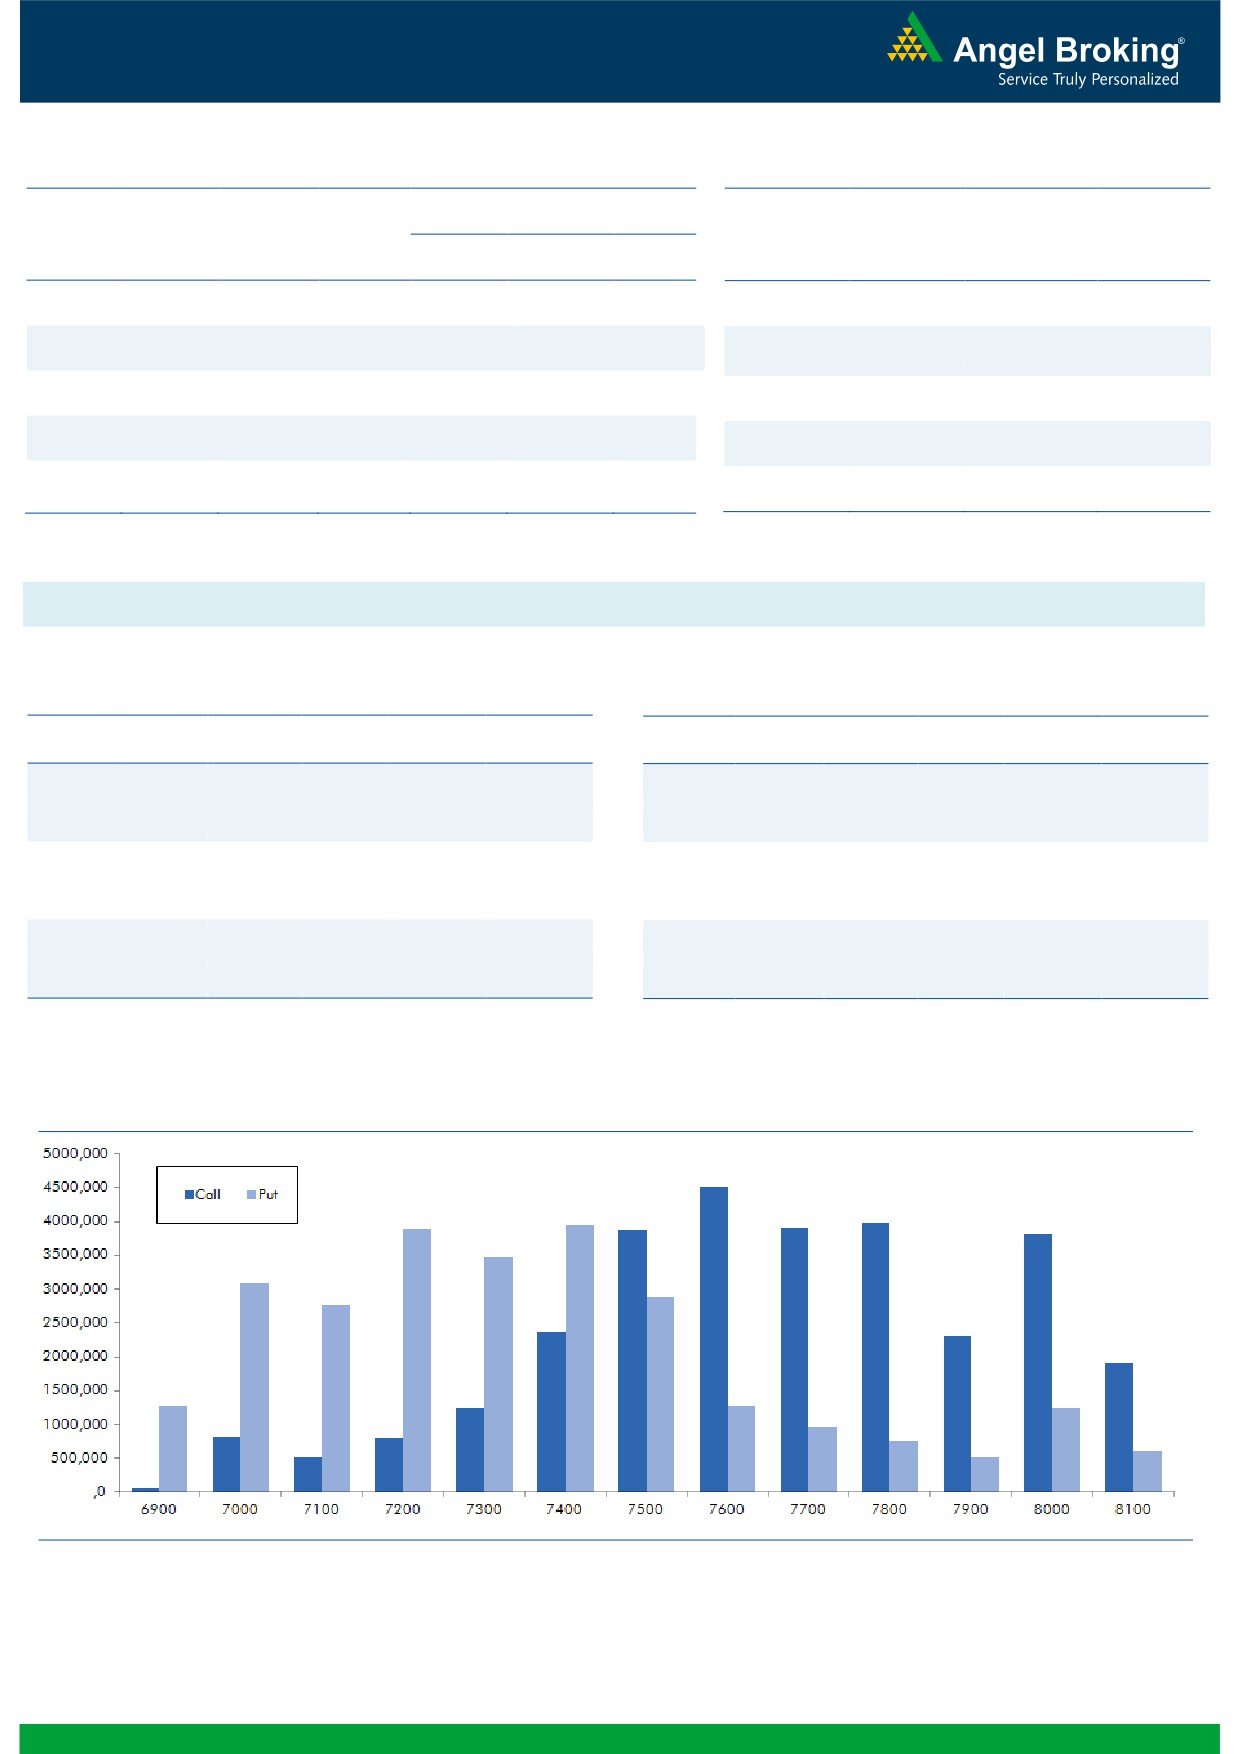
crores with decent rise in OI. In call option, 7400 strike
TORNTPHARM
440800
12.56
1384.15
2.40
added decent build-up which may be long formation.
PFC
19382000
10.82
163.95
-3.27
On the other hand in put options, we hardly saw any
strike adding any significant OI; some unwinding was
OI Losers
visible in 7500 put options. Maximum build-up in current
OI
PRICE
series is visible in 7600 call and 7400 put options.
SCRIP
OI
PRICE
CHG. (%)
CHG. (%)
Yesterday, Nifty again plunged more than one percent
MINDTREE
353600
-7.43
1487.40
-1.77
but we hardly saw any meaningful shorting by FIIs. We
AMARAJABAT
882000
-7.31
865.05
0.08
would suggest avoiding forming any shorts in NIFTY at
INFY
10891000
-5.66
1162.10
-1.24
current levels and to trade stock specific in this market.
IGL
1798500
-5.00
559.90
-1.38
WOCKPHARMA
3025875
-4.67
1142.25
-6.10
Historical Volatility
Put-Call Ratio
SCRIP
HV
SCRIP
PCR-OI
PCR-VOL
CROMPGREAV
125.10
NIFTY
0.80
0.85
DISHTV
84.28
BANKNIFTY
0.74
0.75
BAJFINANCE
61.29
SBIN
0.61
0.53
TATACOMM
45.21
ICICIBANK
0.49
0.60
UNITECH
73.07
LT
0.81
0.58
Strategy Date
Symbol
Strategy
Status
February 01, 2016
BHEL
Bull Call Spread
Active
2
Technical & Derivatives Report
February 04, 2016
FII Statistics for 03-February 2016
Turnover on 03-February 2016
Open Interest
No. of
Turnover
Change
Detail
Buy
Sell
Net
Instrument
Value
Change
Contracts
( in Cr. )
(%)
Contracts
(in Cr.)
(%)
INDEX
INDEX
1335.51
1687.85
(352.34)
207675
10972.20
(0.70)
300456
15302.19
-22.32
FUTURES
FUTURES
INDEX
INDEX
31429.78
30957.65
472.12
1039565
56696.18
3.92
2924045
159814.43
-9.90
OPTIONS
OPTIONS
STOCK
3965.48
4261.23
(295.75)
1100477
48060.01
1.39
STOCK
FUTURES
578575
25719.65
-8.55
FUTURES
STOCK
STOCK
2530.17
2582.54
(52.37)
46054
1991.19
13.41
OPTIONS
323703
14885.85
-2.91
OPTIONS
TOTAL
39260.93
39489.27
(228.34)
2393771
117719.57
2.49
TOTAL
4126779
215722.13
-10.31
Nifty Spot = 7361.80
Lot Size = 75
Bull-Call Spreads
Bear-Put Spreads
Action
Strike
Price
Risk
Reward
BEP
Action
Strike
Price
Risk
Reward
BEP
Buy
7400
112.30
Buy
7300
89.80
44.20
55.80
7444.20
28.90
71.10
7271.10
Sell
7500
68.10
Sell
7200
60.90
Buy
7400
112.30
Buy
7300
89.80
74.25
125.75
7474.25
49.40
150.60
7250.60
Sell
7600
38.05
Sell
7100
40.40
Buy
7500
68.10
Buy
7200
60.90
30.05
69.95
7530.05
20.50
79.50
7179.50
Sell
7600
38.05
Sell
7100
40.40
Note: Above mentioned Bullish or Bearish Spreads in Nifty (Feb. Series) are given as an information and not as a recommendation.
Nifty Put-Call Analysis
3
Technical & Derivatives Report
February 04, 2016
Daily Pivot Levels for Nifty 50 Stocks
Scrips
S2
S1
PIVOT
R1
R2
ACC
1,219
1,234
1,256
1,271
1,294
ADANIPORTS
204
207
211
214
217
AMBUJACEM
187
189
194
196
200
ASIANPAINT
844
854
869
879
894
AXISBANK
372
376
383
387
394
BAJAJ-AUTO
2,299
2,323
2,359
2,383
2,419
BANKBARODA
114
117
120
123
126
BHARTIARTL
294
297
299
302
305
BHEL
124
126
130
132
135
BOSCHLTD
16,480
16,612
16,787
16,920
17,095
BPCL
806
818
837
849
869
CAIRN
111
113
116
118
121
CIPLA
547
555
567
574
586
COALINDIA
309
313
319
323
328
DRREDDY
2,974
2,991
3,015
3,032
3,055
GAIL
344
352
357
366
371
GRASIM
3,369
3,390
3,427
3,448
3,485
HCLTECH
836
844
857
865
878
HDFC
1,144
1,153
1,167
1,175
1,189
HDFCBANK
1,036
1,040
1,046
1,050
1,055
HEROMOTOCO
2,428
2,456
2,500
2,528
2,571
HINDALCO
65
66
67
68
69
HINDUNILVR
782
802
815
835
848
ICICIBANK
199
201
205
208
211
IDEA
98
101
103
106
108
INDUSINDBK
880
893
904
917
928
INFY
1,139
1,148
1,162
1,171
1,185
ITC
317
320
322
324
327
KOTAKBANK
656
661
666
671
677
LT
1,079
1,094
1,107
1,122
1,135
LUPIN
1,667
1,683
1,698
1,714
1,730
M&M
1,169
1,186
1,207
1,224
1,245
MARUTI
3,742
3,785
3,828
3,871
3,913
NTPC
123
126
130
133
136
ONGC
207
210
213
217
220
PNB
86
88
89
90
92
POWERGRID
139
141
144
146
148
RELIANCE
964
973
983
992
1,002
SBIN
161
164
166
168
170
VEDL
58
60
62
64
66
SUNPHARMA
814
824
840
850
865
TATAMOTORS
312
316
321
325
330
TATAPOWER
55
56
57
58
59
TATASTEEL
214
219
226
231
239
TCS
2,333
2,374
2,402
2,444
2,472
TECHM
460
466
472
478
483
ULTRACEMCO
2,719
2,744
2,775
2,800
2,831
WIPRO
547
552
559
565
572
YESBANK
733
756
772
794
811
ZEEL
393
399
406
411
418
4
Technical & Derivatives Report
February 04, 2016
Research Team Tel: 022 - 39357800
For Technical Queries
For Derivatives Queries
DISCLAIMER
Angel Broking Private Limited (hereinafter referred to as “Angel”) is a registered Member of National Stock Exchange of India Limited,
Bombay Stock Exchange Limited and MCX Stock Exchange Limited. It is also registered as a Depository Participant with CDSL and
Portfolio Manager with SEBI. It also has registration with AMFI as a Mutual Fund Distributor. Angel Broking Private Limited is a
registered entity with SEBI for Research Analyst in terms of SEBI (Research Analyst) Regulations, 2014 vide registration number
INH000000164. Angel or its associates has not been debarred/ suspended by SEBI or any other regulatory authority for accessing
/dealing in securities Market. Angel or its associates including its relatives/analyst do not hold any financial interest/beneficial
ownership of more than 1% in the company covered by Analyst. Angel or its associates/analyst has not received any compensation /
managed or co-managed public offering of securities of the company covered by Analyst during the past twelve months. Angel/analyst
has not served as an officer, director or employee of company covered by Analyst and has not been engaged in market making activity
of the company covered by Analyst.
This document is solely for the personal information of the recipient, and must not be singularly used as the basis of any investment
decision. Nothing in this document should be construed as investment or financial advice. Each recipient of this document should
make such investigations as they deem necessary to arrive at an independent evaluation of an investment in the securities of the
companies referred to in this document (including the merits and risks involved), and should consult their own advisors to determine
the merits and risks of such an investment.
Reports based on technical and derivative analysis center on studying charts of a stock's price movement, outstanding positions and
trading volume, as opposed to focusing on a company's fundamentals and, as such, may not match with a report on a company's
fundamentals.
The information in this document has been printed on the basis of publicly available information, internal data and other reliable
sources believed to be true, but we do not represent that it is accurate or complete and it should not be relied on as such, as this
document is for general guidance only. Angel Broking Pvt. Limited or any of its affiliates/ group companies shall not be in any way
responsible for any loss or damage that may arise to any person from any inadvertent error in the information contained in this report.
Angel Broking Pvt. Limited has not independently verified all the information contained within this document. Accordingly, we cannot
testify, nor make any representation or warranty, express or implied, to the accuracy, contents or data contained within this document.
While Angel Broking Pvt. Limited endeavors to update on a reasonable basis the information discussed in this material, there may be
regulatory, compliance, or other reasons that prevent us from doing so.
This document is being supplied to you solely for your information, and its contents, information or data may not be reproduced,
redistributed or passed on, directly or indirectly.
Neither Angel Broking Pvt. Limited, nor its directors, employees or affiliates shall be liable for any loss or damage that may arise from
or in connection with the use of this information.
Note: Please refer to the important ‘Stock Holding Disclosure' report on the Angel website (Research Section). Also, please refer to the
latest update on respective stocks for the disclosure status in respect of those stocks. Angel Broking Pvt. Limited and its affiliates may
have investment positions in the stocks recommended in this report.
5