Technical & Derivatives Report
January 04, 2016
Sensex (26161) / Nifty (7963)
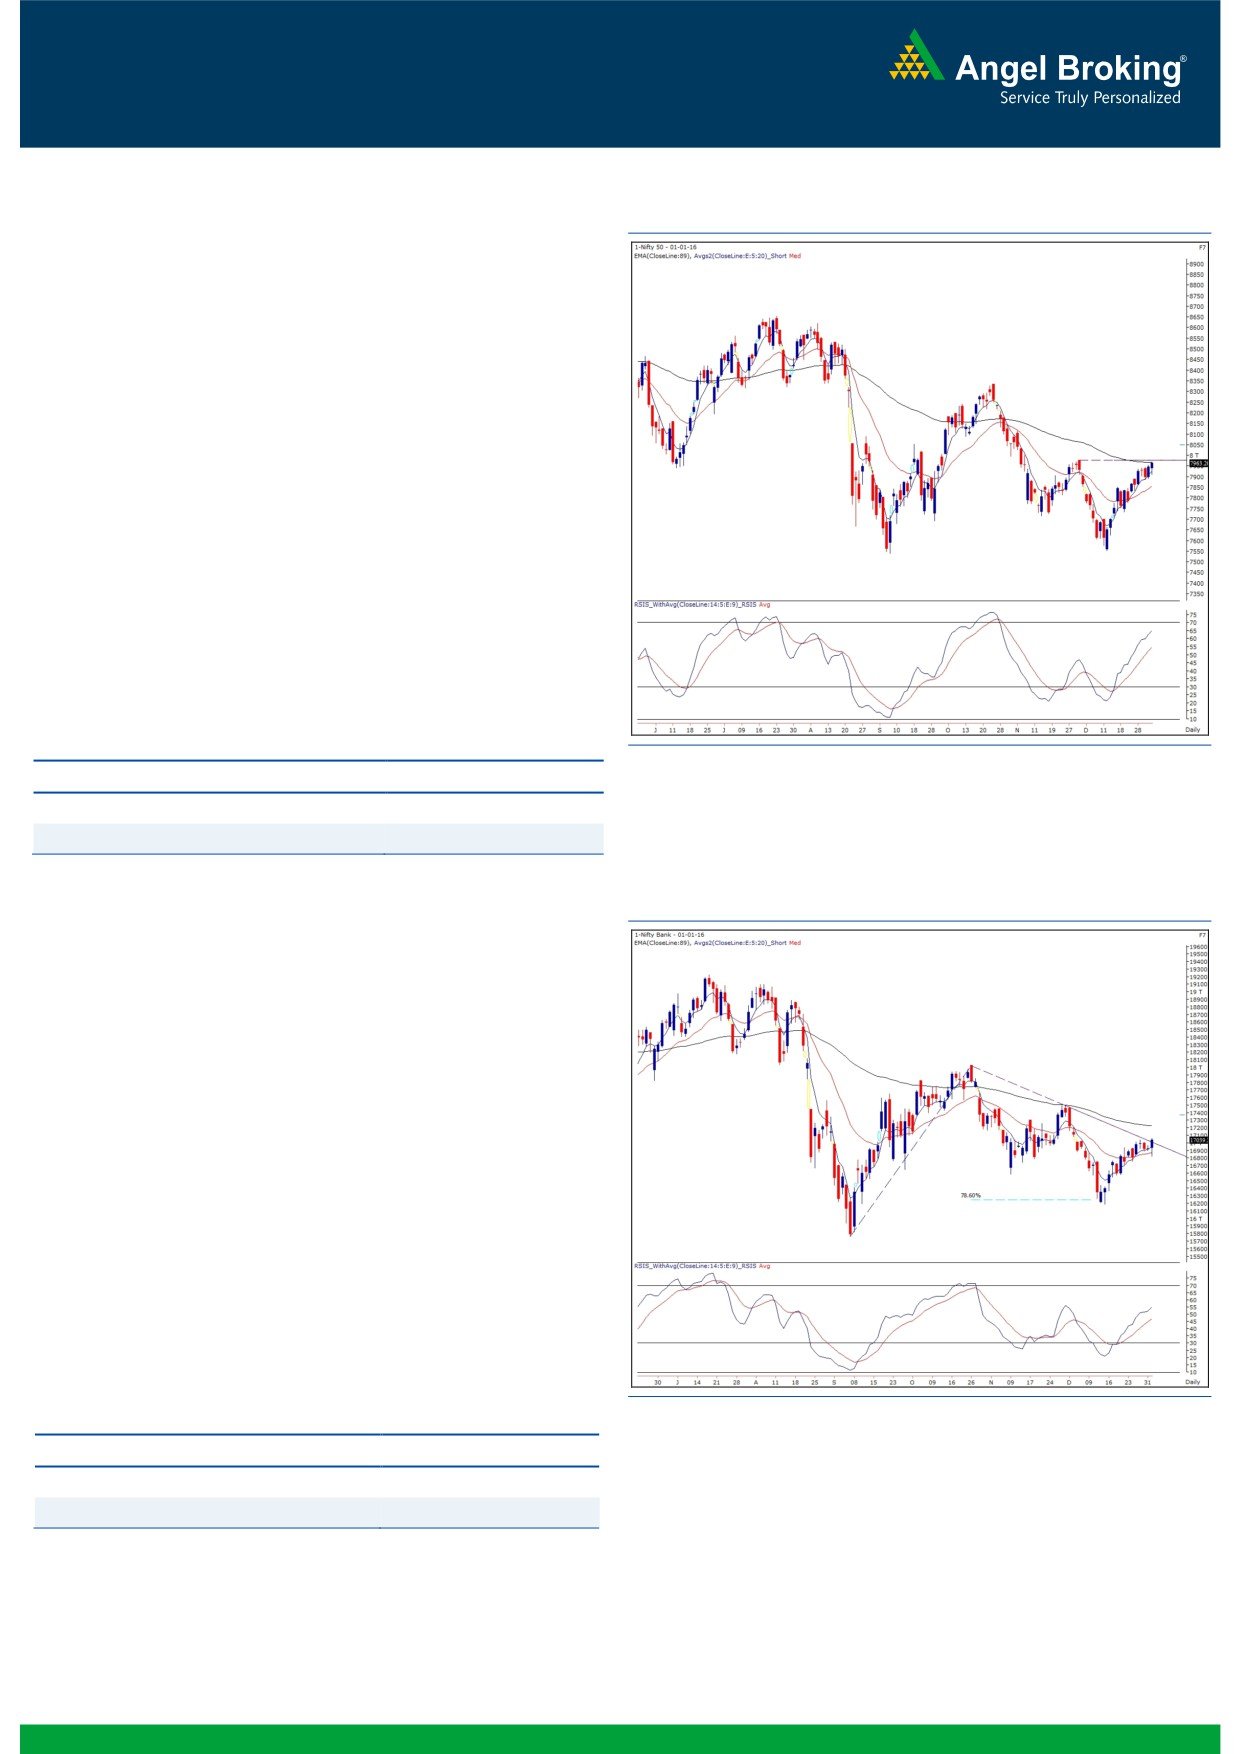
Exhibit 1: Nifty Daily Chart
We have been mentioning about the key points of 7950 -
7970 on the Nifty since the past couple of weeks. The index
has now reached these levels and is nearing its recent high of
7979. This level coincides with the daily ‘89 EMA’ and thus,
can be considered as a strong hurdle in the near term. If the
Nifty has to extend this up move, then it needs to break the
psychological level of 8000 decisively. If it’s able to do so,
then we may witness an extension of the move towards 8080 -
8120 levels. On the flip side, the Nifty could slip towards 7890
- 7850 levels if investors resort to some amount of profit
booking on lack of conviction in the market in the near term.
Traders are advised to stay light on positions and wait for
further developments on the charts. As of now, we expect the
Nifty to remain within a small range of 7850 - 8000. During
the concluded week, a number of individual stocks performed
favorably and we expect such outperformance to continue in
the coming week as well. Traders should stick to stock centric
approach with a proper exit strategy.
Key Levels
Support 1 - 7890
Resistance 1 - 7979
Support 2 - 7850
Resistance 2 - 8000
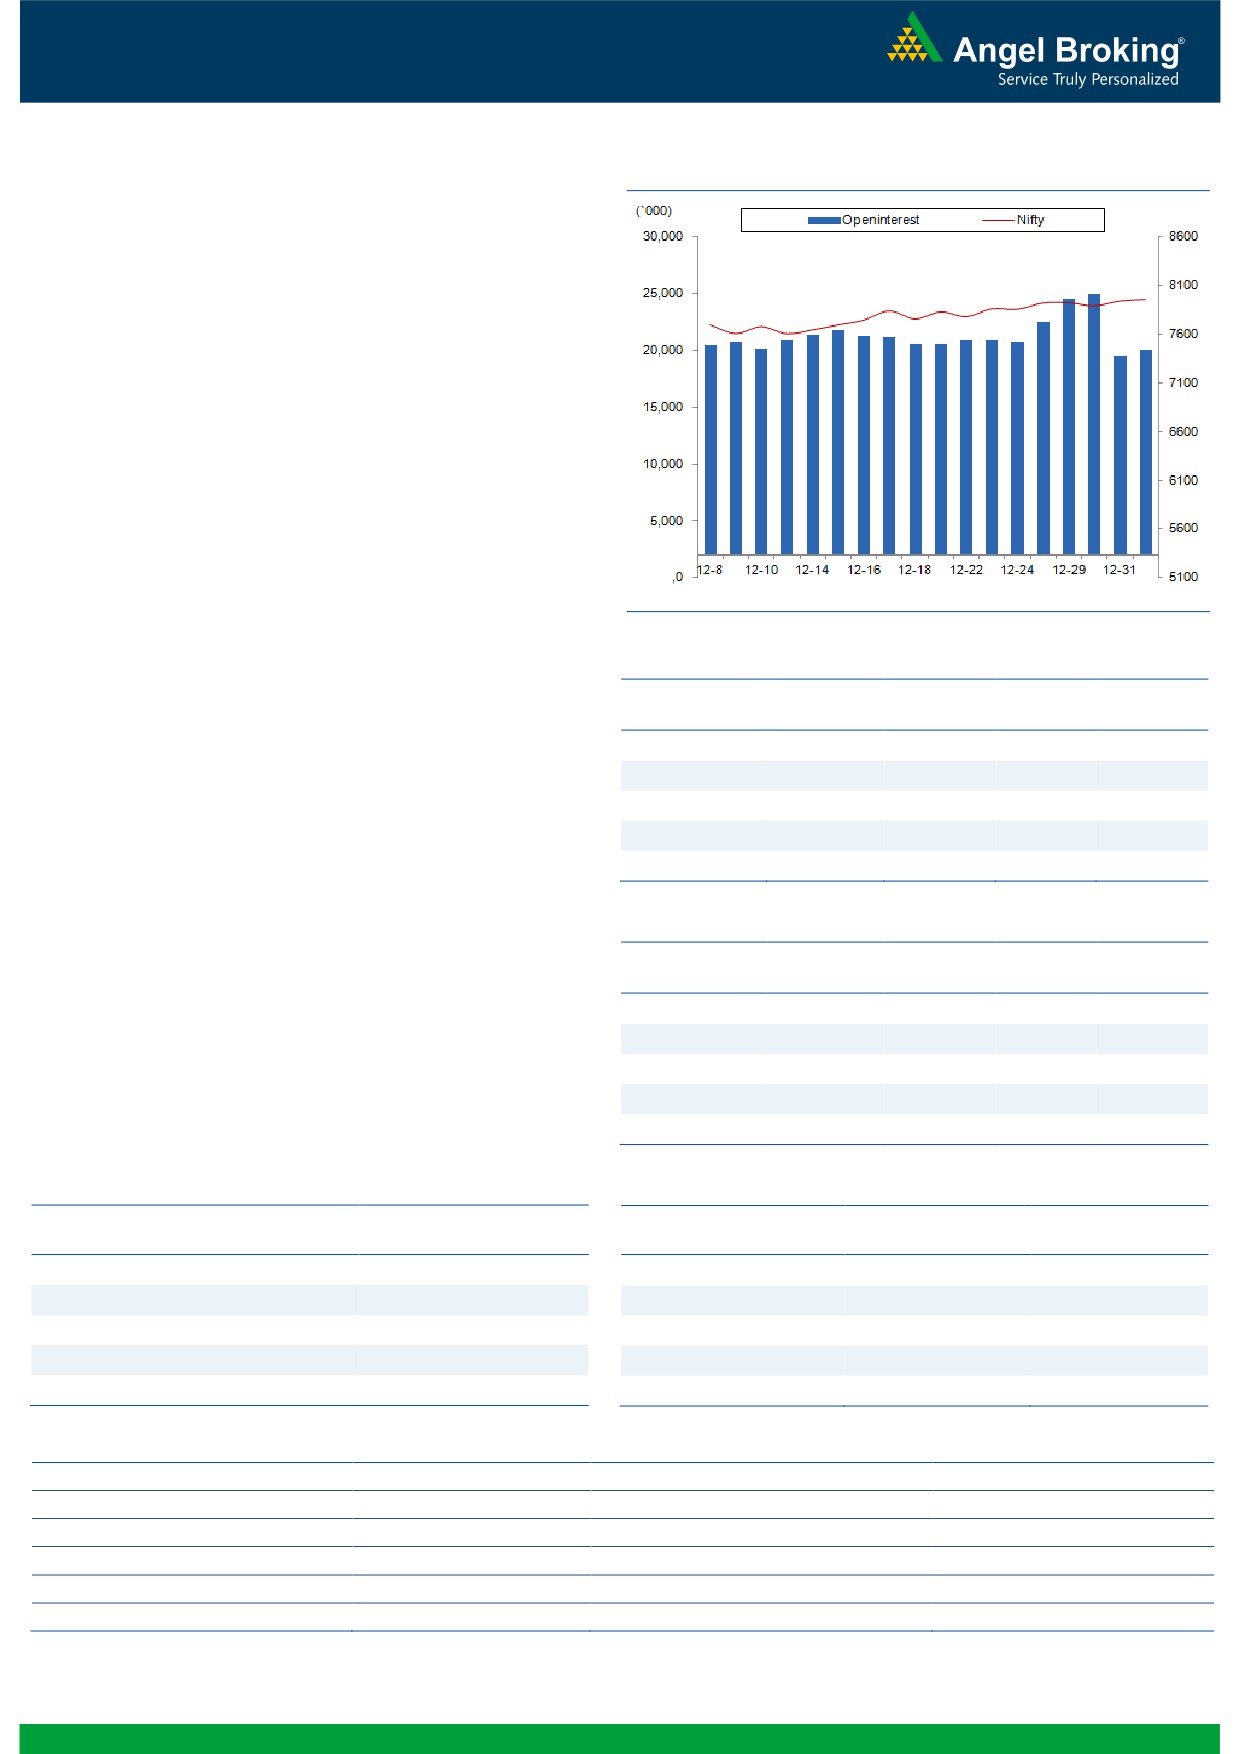
Exhibit 2: Bank Nifty Daily Chart
Bank Nifty Outlook - (17039)
The Nifty Bank index opened on a flat note on Friday and
traded with the negative bias in the first half of the sessions.
However, the sudden spurt in the banking counters in the
second half pulled the index higher. Eventually, the banking
index ended the session with the gains of 0.69 percent. On
weekly basis, the banking index traded in the narrow range of
243 points and managed to close in the green for the third
consecutive week.
After the sideways movement of three sessions, the Nifty Bank
index has given a breakout in yesterday’s session. The
momentum may continue in upcoming sessions too. Traders
are advised to be with the trend till it holds 16800 levels.
Going forward, the immediate support for the index is placed
at 16900 and 16800 levels. While, 17080 and 17215 would
now act as intraday resistance levels.
Key Levels
Support 1 - 16900
Resistance 1 - 17080
Support 2 - 16800
Resistance 2 - 17215
1
Technical & Derivatives Report
January 04, 2016
Comments
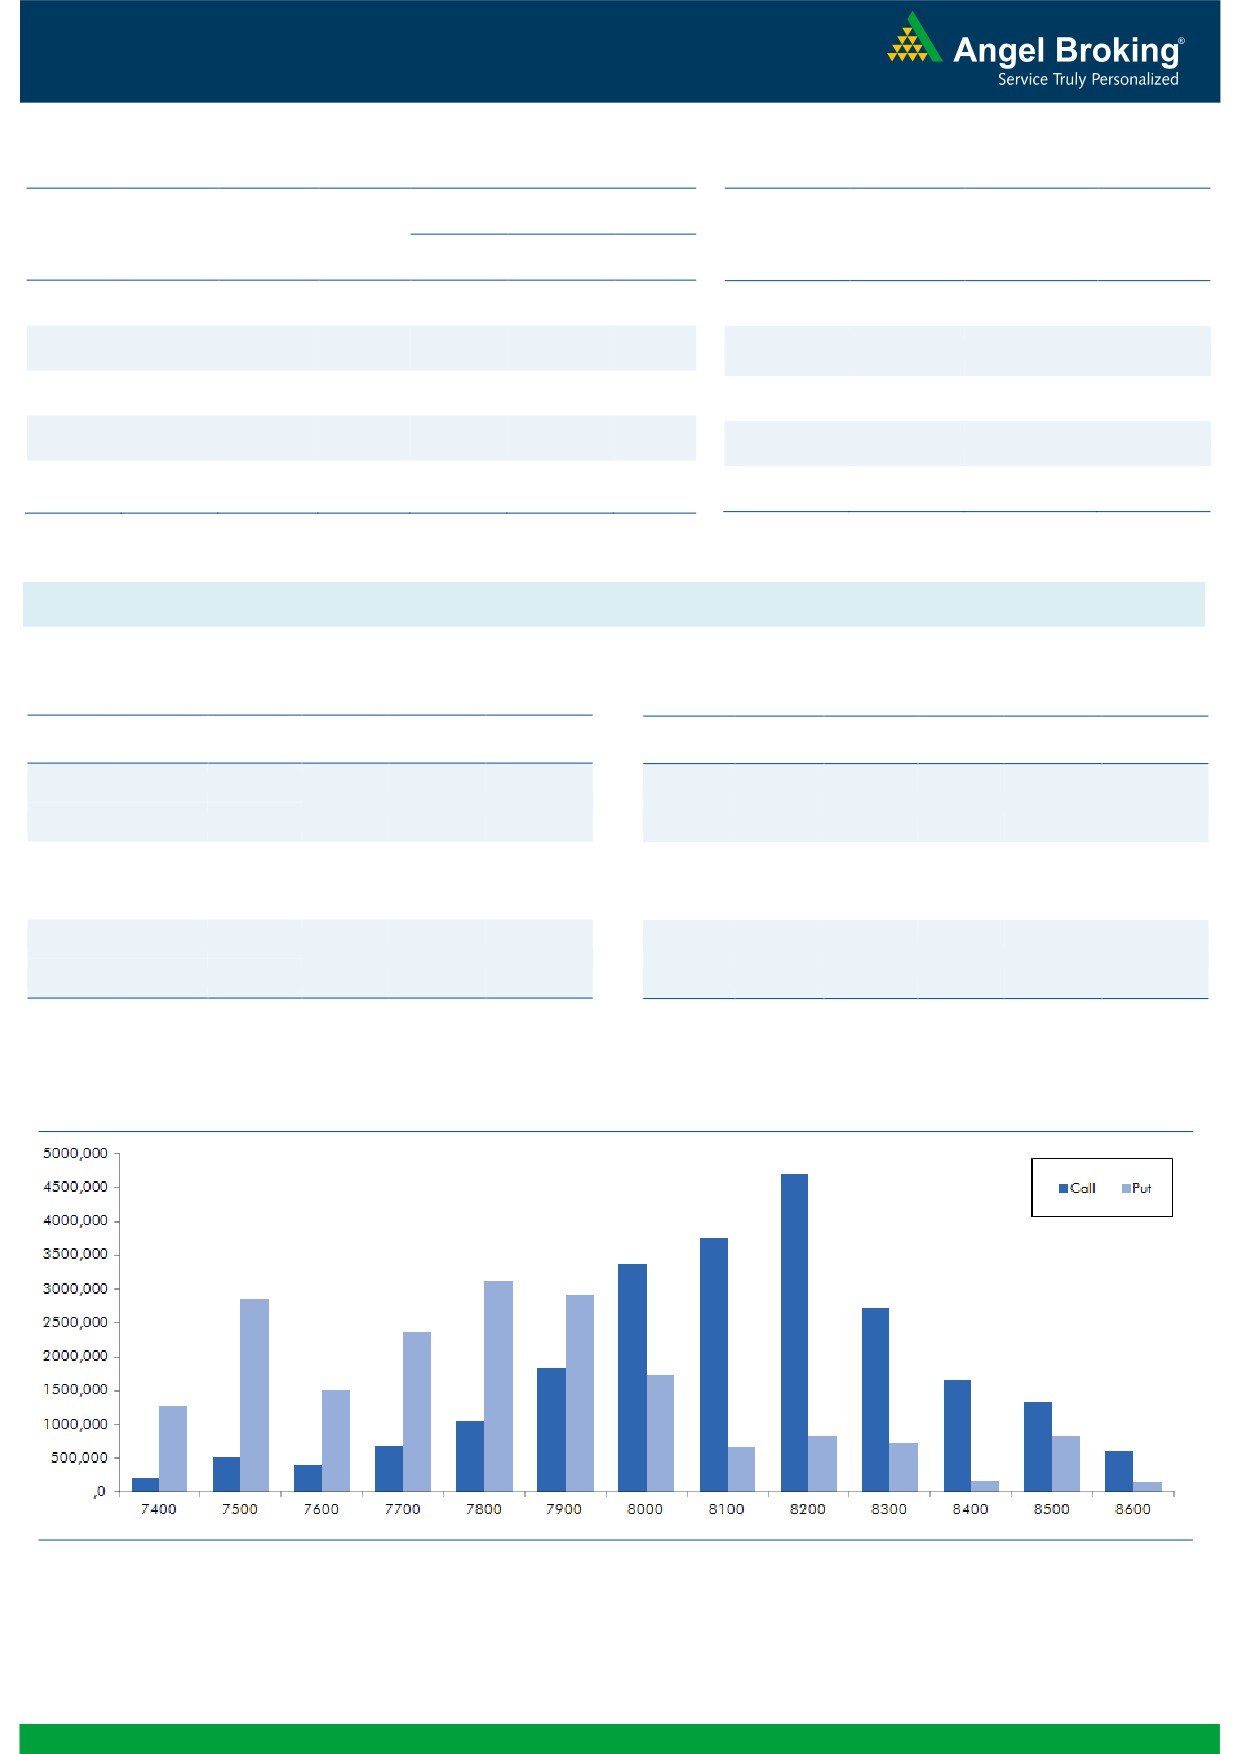
Nifty Vs OI
The Nifty futures open interest has increased by 2.66%
BankNifty futures open interest has increased by 4.36%
as market closed at 7963.20 levels.
The Nifty January future closed at a premium of 18.80
points against a premium of 5.70 points. The February
series closed at a premium of 39.70 points.
The Implied Volatility of at the money options has
increased from 12.43% to 13.05 %.
The total OI of the market is Rs. 1,71,366/- cr. and the
stock futures OI is Rs. 62,545/- cr.
Few of the liquid counters where we have seen high cost
of carry are JPASSOCIAT, ADANIPOWER, UNITECH,
NHPC and IFCI
OI Gainers
Views
OI
PRICE
SCRIP
OI
PRICE
CHG. (%)
CHG. (%)
FIIs were net buyers in equity segment to the tune of Rs.
ENGINERSIN
2486000
14.60
250.30
3.20
228 crores. While in Index Futures they sold marginally
BEML
597500
14.24
1310.30
1.86
with decent rise in open interest, this indicates blend of
DLF
43420000
11.72
122.25
4.85
both long and short positions in Friday’s trading session.
RELINFRA
9418500
10.95
593.30
9.64
In Index Options front, FIIs were net buyers of worth Rs.
HAVELLS
7660000
10.25
322.60
5.42
566 crores with good amount of rise in open interest. In
call options, we saw out of the money strikes, 8100-
OI Losers
8400 to be quite active and they also added decent
OI
PRICE
amount of fresh OI. While in put options, some build-up
SCRIP
OI
PRICE
CHG. (%)
CHG. (%)
was witness in 7900 strike price. FIIs have been forming
RPOWER
59592000
-12.31
59.15
3.59
decent fresh longs in Index Futures from past few days;
CADILAHC
9409500
-8.24
333.35
1.28
we believe the resistance of 8100-8150 may be tested.
HINDZINC
1964800
-4.66
149.35
1.46
So, one should trade accordingly.
TATACHEM
4582600
-3.70
410.75
2.09
PAGEIND
43050
-2.82
13417.35
0.58
Historical Volatility
Put-Call Ratio
SCRIP
HV
SCRIP
PCR-OI
PCR-VOL
ADANIENT
55.92
NIFTY
0.77
0.62
WOCKPHARMA
41.50
BANKNIFTY
1.04
0.79
RELINFRA
67.81
SBIN
0.45
0.37
RELCAPITAL
46.94
LT
0.67
0.36
HAVELLS
45.77
RELIANCE
0.61
0.59
Strategy Date
Symbol
Strategy
Status
2
Technical & Derivatives Report
January 04, 2016
FII Statistics for 01-January 2015
Turnover on 01-January 2015
Open Interest
No. of
Turnover
Change
Detail
Buy
Sell
Net
Instrument
Value
Change
Contracts
( in Cr. )
(%)
Contracts
(in Cr.)
(%)
INDEX
INDEX
467.28
541.81
(74.52)
249867
14641.29
2.32
151271
8431.70
-61.57
FUTURES
FUTURES
INDEX
INDEX
4020.08
3453.75
566.33
617233
36719.62
5.22
999548
59280.73
-82.43
OPTIONS
OPTIONS
STOCK
1556.15
1775.05
(218.89)
978828
49484.03
0.32
STOCK
FUTURES
394786
22002.91
-66.68
FUTURES
STOCK
STOCK
905.29
832.05
73.24
12847
668.55
474.81
OPTIONS
159000
9419.41
-52.19
OPTIONS
TOTAL
6948.80
6602.65
346.15
1858775
101513.49
2.76
TOTAL
1704605
99134.75
-77.73
Nifty Spot = 7963.20
Lot Size = 75
Bull-Call Spreads
Bear-Put Spreads
Action
Strike
Price
Risk
Reward
BEP
Action
Strike
Price
Risk
Reward
BEP
Buy
8000
105.30
Buy
7900
80.30
41.55
58.45
8041.55
27.60
72.40
7872.40
Sell
8100
63.75
Sell
7800
52.70
Buy
8000
105.30
Buy
7900
80.30
69.15
130.85
8069.15
47.10
152.90
7852.90
Sell
8200
36.15
Sell
7700
33.20
Buy
8100
63.75
Buy
7800
52.70
27.60
72.40
8127.60
19.50
80.50
7780.50
Sell
8200
36.15
Sell
7700
33.20
Note: Above mentioned Bullish or Bearish Spreads in Nifty (Jan. Series) are given as an information and not as a recommendation.
Nifty Put-Call Analysis
3
Technical & Derivatives Report
January 04, 2016
Daily Pivot Levels for Nifty 50 Stocks
Scrips
S2
S1
PIVOT
R1
R2
ACC
1,351
1,362
1,371
1,383
1,392
ADANIPORTS
257
262
265
271
274
AMBUJACEM
202
204
205
207
208
ASIANPAINT
872
875
880
884
889
AXISBANK
442
446
449
453
457
BAJAJ-AUTO
2,501
2,509
2,520
2,528
2,539
BANKBARODA
154
157
158
161
162
BHARTIARTL
334
337
341
344
347
BHEL
167
169
170
173
174
BOSCHLTD
18,293
18,746
19,023
19,476
19,753
BPCL
885
891
896
902
908
CAIRN
136
137
139
140
141
CIPLA
644
650
654
660
664
COALINDIA
322
328
331
338
341
DRREDDY
3,074
3,091
3,107
3,124
3,140
GAIL
363
366
372
375
381
GRASIM
3,709
3,738
3,764
3,794
3,819
HCLTECH
837
841
848
853
860
HDFC
1,242
1,250
1,259
1,267
1,275
HDFCBANK
1,071
1,080
1,085
1,094
1,099
HEROMOTOCO
2,666
2,676
2,685
2,696
2,705
HINDALCO
83
84
85
85
86
HINDUNILVR
849
853
857
861
866
ICICIBANK
256
259
262
265
267
IDEA
141
142
143
144
146
INDUSINDBK
955
959
966
970
977
INFY
1,087
1,096
1,102
1,112
1,118
ITC
324
326
327
329
331
KOTAKBANK
704
716
723
734
741
LT
1,266
1,278
1,284
1,296
1,303
LUPIN
1,819
1,832
1,845
1,859
1,872
M&M
1,249
1,257
1,268
1,277
1,288
MARUTI
4,571
4,605
4,636
4,670
4,702
NTPC
143
144
145
146
147
ONGC
236
239
241
245
247
PNB
115
116
117
119
119
POWERGRID
140
141
141
142
142
RELIANCE
1,003
1,009
1,014
1,020
1,025
SBIN
223
225
227
230
231
VEDL
89
91
91
92
93
SUNPHARMA
802
809
813
820
825
TATAMOTORS
363
382
393
412
423
TATAPOWER
67
68
69
70
70
TATASTEEL
250
254
257
260
263
TCS
2,396
2,406
2,423
2,433
2,449
TECHM
515
517
521
524
528
ULTRACEMCO
2,747
2,786
2,806
2,845
2,866
WIPRO
551
554
557
559
562
YESBANK
717
725
730
738
743
ZEEL
428
431
434
436
440
4
Technical & Derivatives Report
January 04, 2016
Research Team Tel: 022 - 39357800
For Technical Queries
For Derivatives Queries
DISCLAIMER
Angel Broking Private Limited (hereinafter referred to as “Angel”) is a registered Member of National Stock Exchange of India Limited,
Bombay Stock Exchange Limited and MCX Stock Exchange Limited. It is also registered as a Depository Participant with CDSL and
Portfolio Manager with SEBI. It also has registration with AMFI as a Mutual Fund Distributor. Angel Broking Private Limited is a
registered entity with SEBI for Research Analyst in terms of SEBI (Research Analyst) Regulations, 2014 vide registration number
INH000000164. Angel or its associates has not been debarred/ suspended by SEBI or any other regulatory authority for accessing
/dealing in securities Market. Angel or its associates including its relatives/analyst do not hold any financial interest/beneficial
ownership of more than 1% in the company covered by Analyst. Angel or its associates/analyst has not received any compensation /
managed or co-managed public offering of securities of the company covered by Analyst during the past twelve months. Angel/analyst
has not served as an officer, director or employee of company covered by Analyst and has not been engaged in market making activity
of the company covered by Analyst.
This document is solely for the personal information of the recipient, and must not be singularly used as the basis of any investment
decision. Nothing in this document should be construed as investment or financial advice. Each recipient of this document should
make such investigations as they deem necessary to arrive at an independent evaluation of an investment in the securities of the
companies referred to in this document (including the merits and risks involved), and should consult their own advisors to determine
the merits and risks of such an investment.
Reports based on technical and derivative analysis center on studying charts of a stock's price movement, outstanding positions and
trading volume, as opposed to focusing on a company's fundamentals and, as such, may not match with a report on a company's
fundamentals.
The information in this document has been printed on the basis of publicly available information, internal data and other reliable
sources believed to be true, but we do not represent that it is accurate or complete and it should not be relied on as such, as this
document is for general guidance only. Angel Broking Pvt. Limited or any of its affiliates/ group companies shall not be in any way
responsible for any loss or damage that may arise to any person from any inadvertent error in the information contained in this report.
Angel Broking Pvt. Limited has not independently verified all the information contained within this document. Accordingly, we cannot
testify, nor make any representation or warranty, express or implied, to the accuracy, contents or data contained within this document.
While Angel Broking Pvt. Limited endeavors to update on a reasonable basis the information discussed in this material, there may be
regulatory, compliance, or other reasons that prevent us from doing so.
This document is being supplied to you solely for your information, and its contents, information or data may not be reproduced,
redistributed or passed on, directly or indirectly.
Neither Angel Broking Pvt. Limited, nor its directors, employees or affiliates shall be liable for any loss or damage that may arise from
or in connection with the use of this information.
Note: Please refer to the important ‘Stock Holding Disclosure' report on the Angel website (Research Section). Also, please refer to the
latest update on respective stocks for the disclosure status in respect of those stocks. Angel Broking Pvt. Limited and its affiliates may
have investment positions in the stocks recommended in this report.
5