Technical & Derivatives Report
December 03, 2015
Sensex (26118) / Nifty (7931)
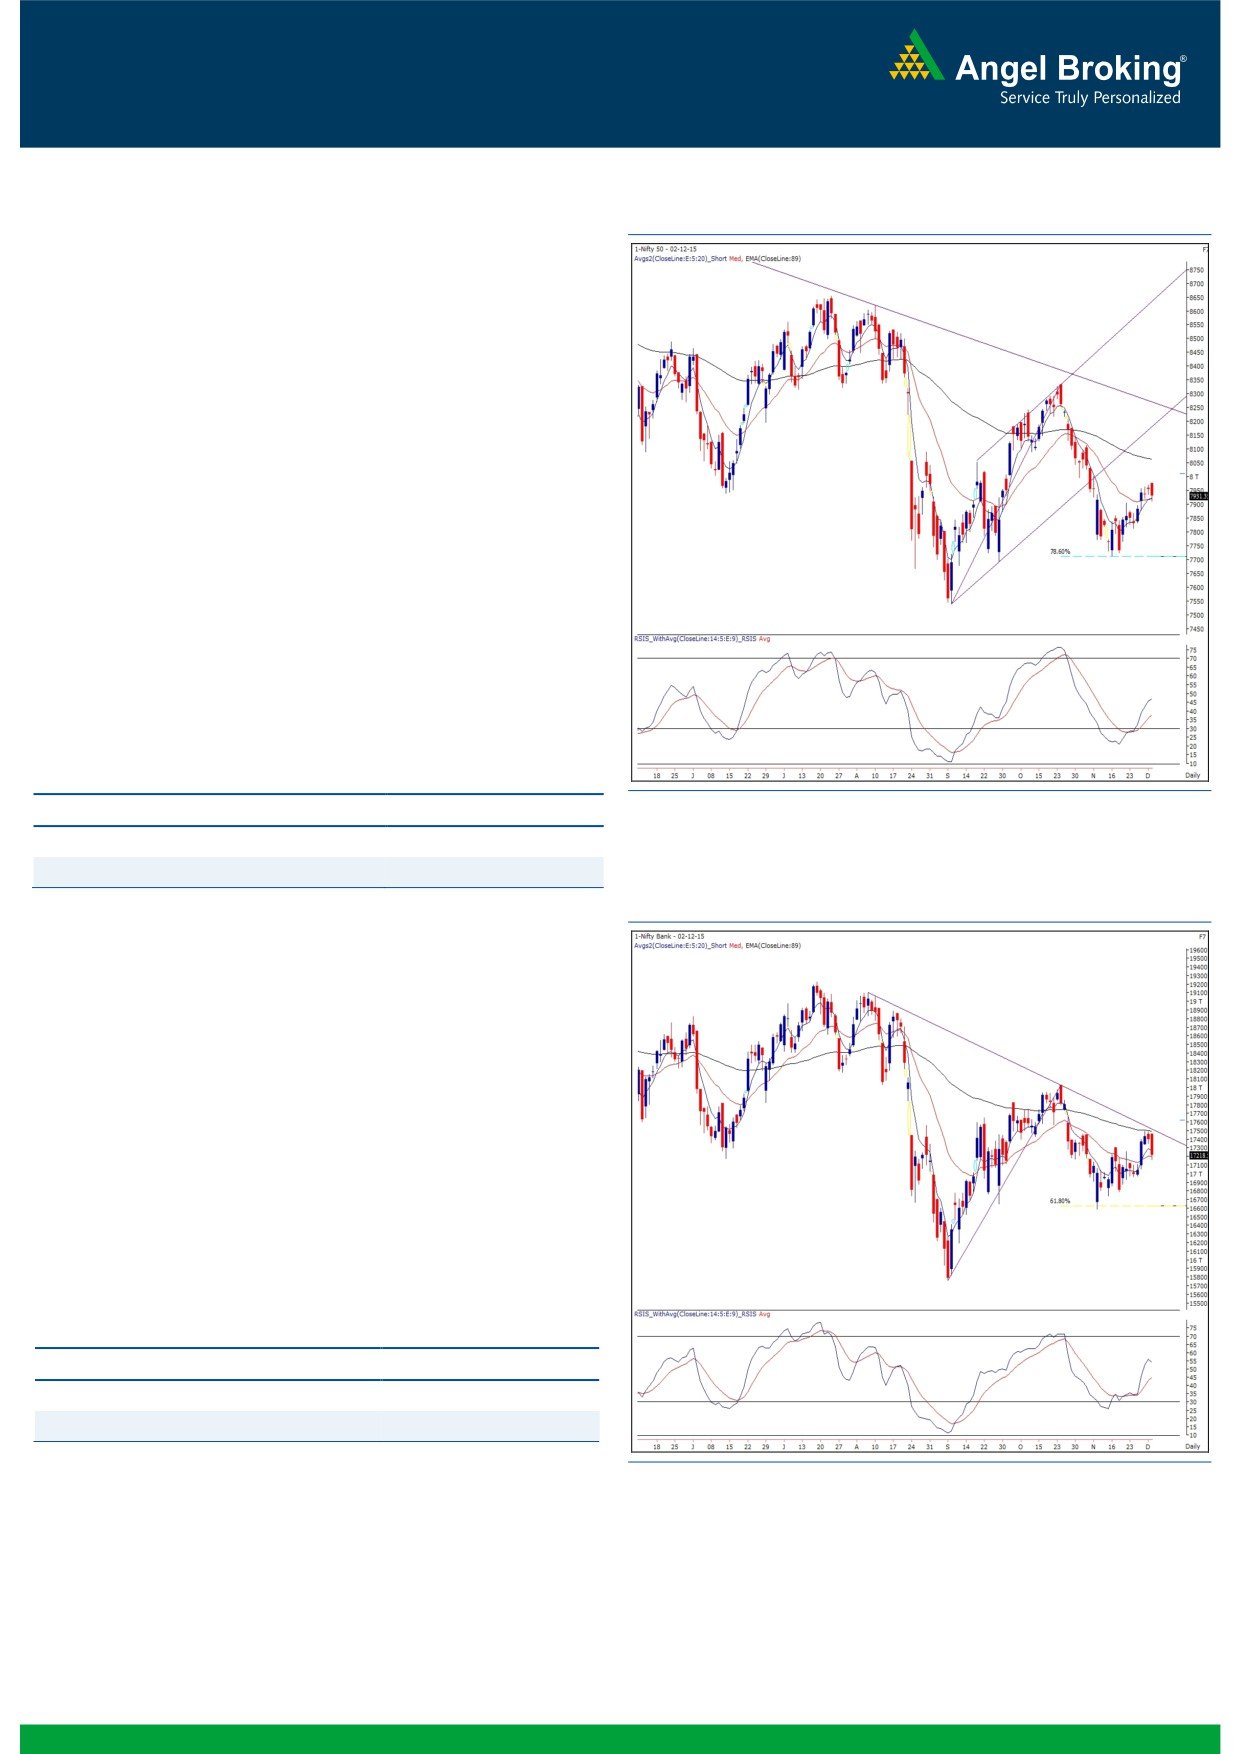
Exhibit 1: Nifty Daily Chart
Yesterday’s session opened tad higher citing overnight rally in
US bourses. However, this early morning lead was very short
lived as the index pared down these gains in the initial hour
and then remained under bit of pressure throughout the
remaining part of the day. As a result, the Nifty eventually
ended the session with 0.30% loss over its previous close.
Considering Tuesday’s close along with positive global cues,
we expected Nifty to move higher. However, some of the
sectors (mainly banking) kept benchmark index under pressure
throughout the session to close marginally below the 7950
mark. Despite this price action, we are now seeing another
positive development of the chart. A combination of ‘5 & 20
EMA’ on the daily chart has confirmed a positive crossover.
Thus, going forward, if the index manages to sustain above
7900 then we may witness continuation of this recent bounce
towards 8050. On the flipside, 7900 - 7875 would now be
seen as important support for the index. Traders are advised
to initiate positions with a proper exit strategy.
Key Levels
Support 1 - 7900
Resistance 1 - 7960
Support 2 - 7875
Resistance 2 - 8000
Exhibit 2: Bank Nifty Daily Chart
Bank Nifty Outlook - (17219)
Yesterday, the Bank Nifty too opened with marginal gains and
started correcting from initial trades. The fall was slightly
quicker and thus, the banking index sneaked below its
previous two sessions’ low within the first hour of trade.
However, after a sharp correction in the first half of the
session, the Bank Nifty traded in a sideways direction in the
latter half of the session. Eventually, the Bank Nifty
underperformed the broader market by posting shedding 1.03
percent. The failure to cross the resistance of ‘Daily 89 EMA’
shows some sign of weakness in the banking counters. Going
forward, the immediate support for the index is placed at
17100 - 16965 levels. On the flipside, 17350 and 17500
would now act as a crucial resistance zone.
Key Levels
Support 1 - 17100
Resistance 1 - 17350
Support 2 - 16965
Resistance 2 - 17500
1
Technical & Derivatives Report
December 03, 2015
Comments
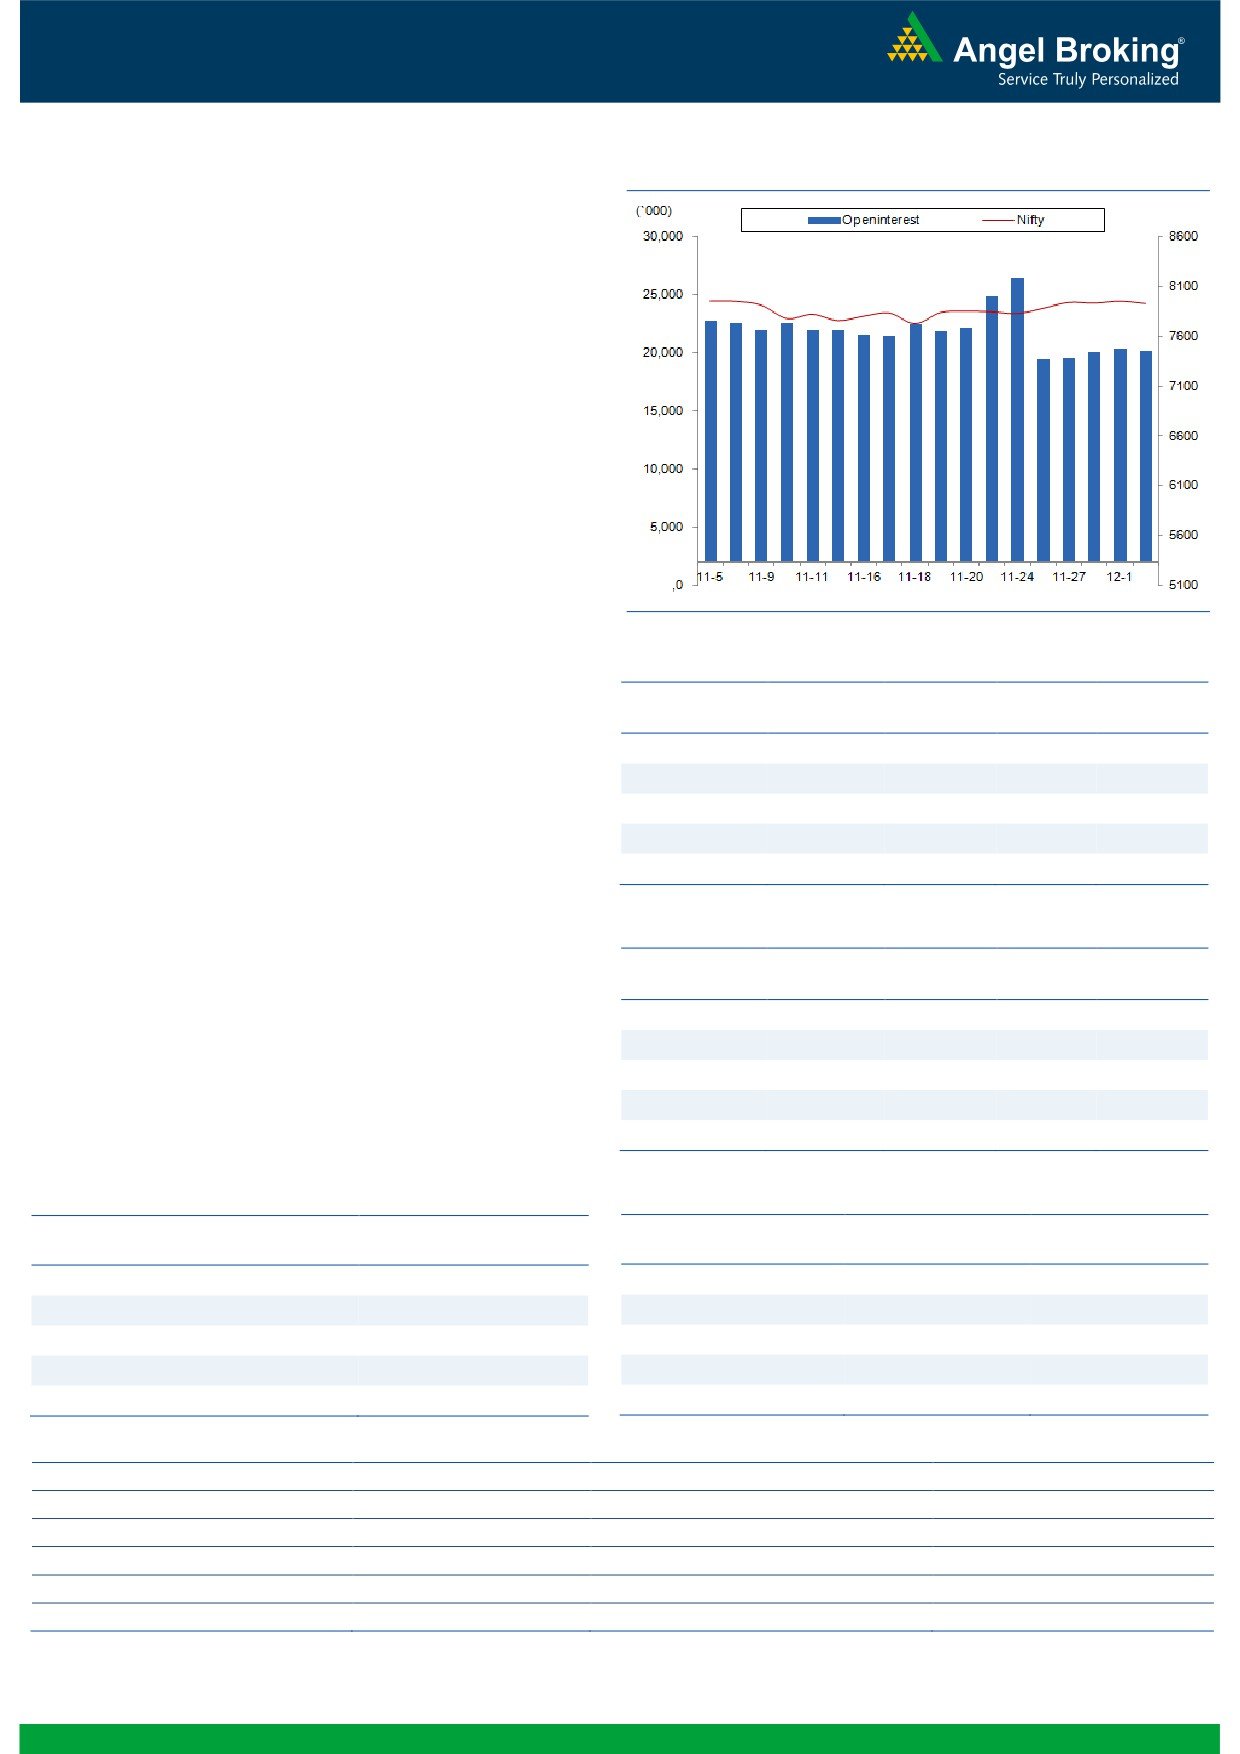
Nifty Vs OI
The Nifty futures open interest has decreased by 0.77%
BankNifty futures open interest has decreased by 4.97%
as market closed at 7931.35 levels.
The Nifty December future closed at a premium of 31.55
points against a premium of 32.85 points. The January
series closed at a premium of 67.90 points.
The Implied Volatility of at the money options has
increased from 13.86% to 14.10%.
The total OI of the market is Rs. 1,97,341/- cr. and the
stock futures OI is Rs. 63,847/- cr.
Few of the liquid counters where we have seen high cost
of carry are UNITECH, INDIACEM, GMRINFRA,
TV18BRDCST and DISHTV.
Views
OI Gainers
OI
PRICE
SCRIP
OI
PRICE
Yesterday, FIIs activity remained subdued in cash market
CHG. (%)
CHG. (%)
segment. While in Index Futures, they sold to the tune of
TATAMTRDVR
17196900
16.30
288.80
-1.01
Rs.
506 crores with no change in open interest,
BEML
382500
14.18
1106.80
-2.44
indicating blend of long unwinding and short formation
NCC
10056000
12.63
77.75
-0.19
in last trading session.
GMRINFRA
259350000
9.45
17.80
7.23
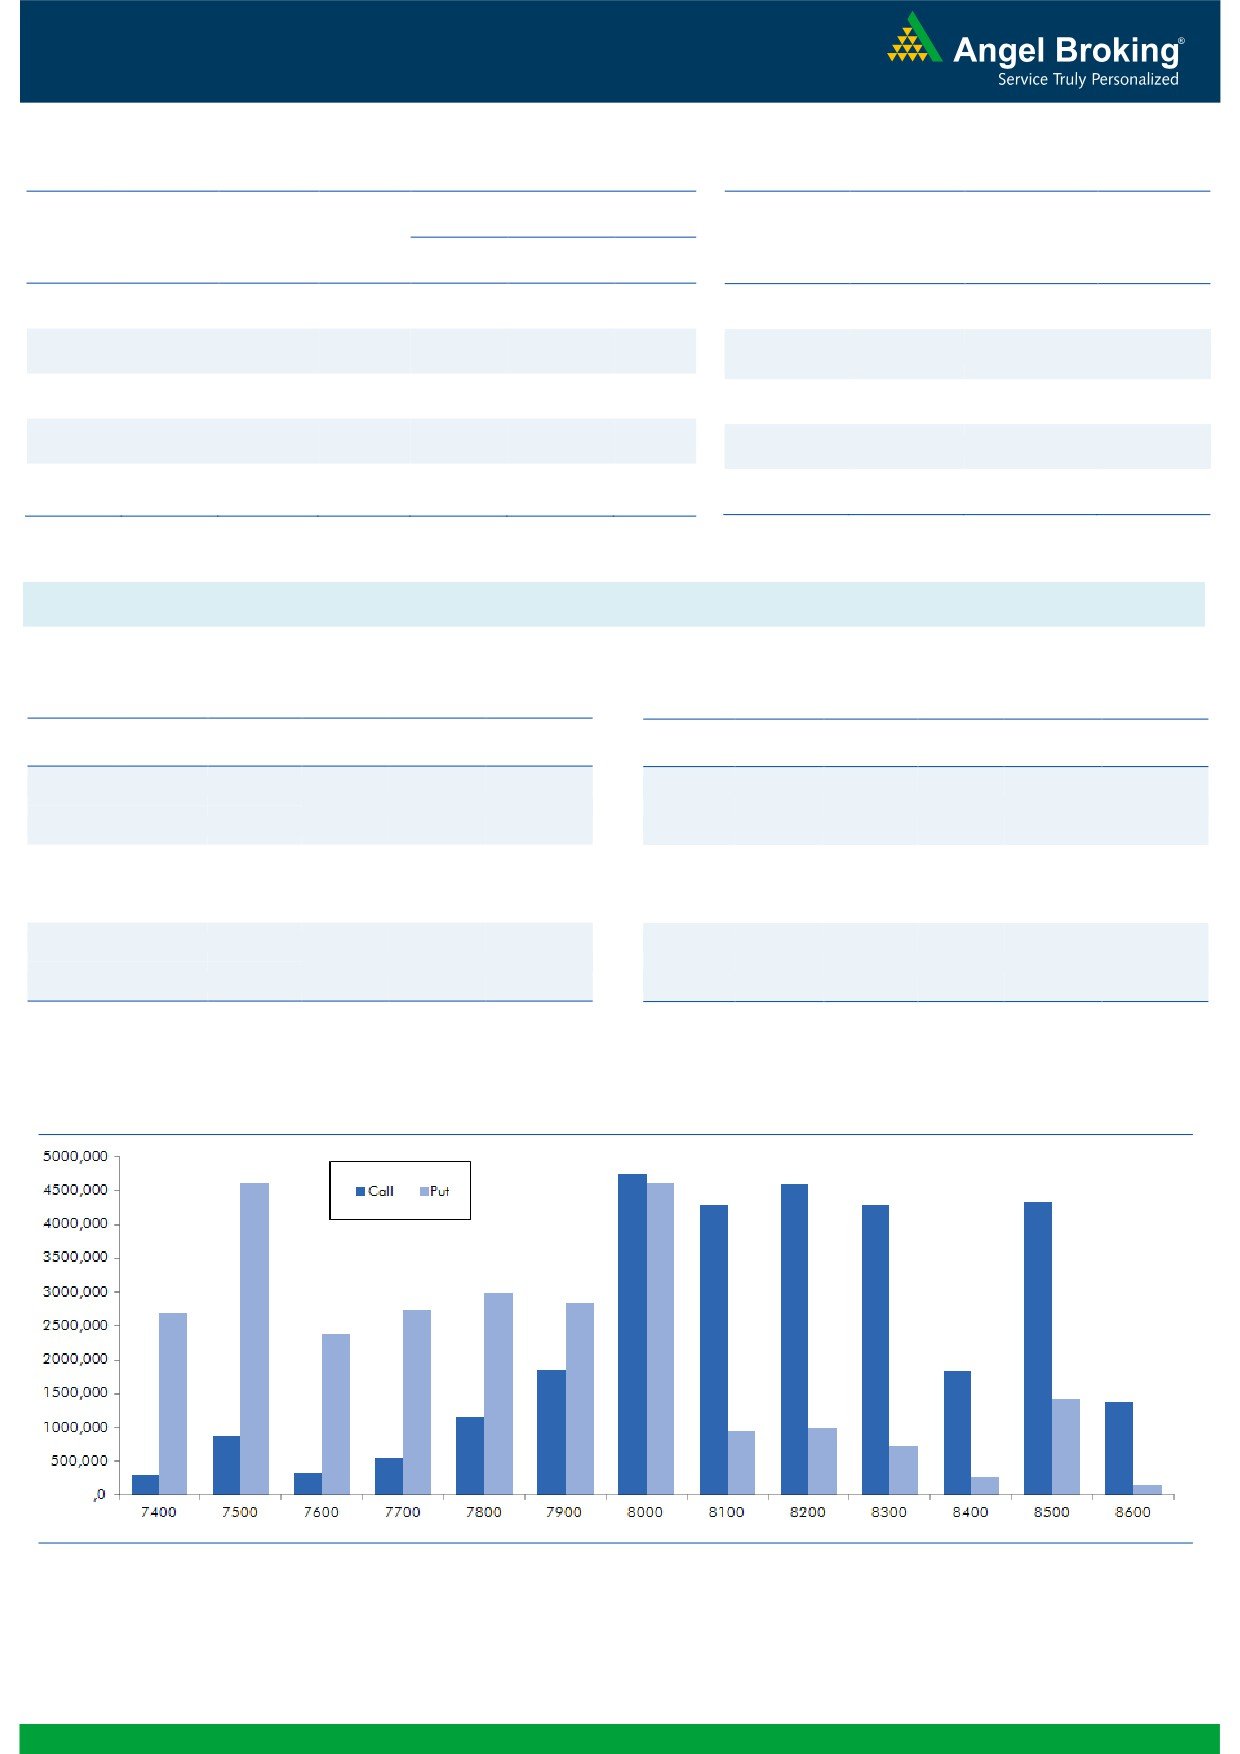
In Index Options front, FIIs bought of Rs. 1149 croresg.com
SUNPHARMA
20380200
7.96
737.15
0.41
with rise in OI. In call options, 8100 and 8200 strikes
remain active and added some OI. While in put options,
OI Losers
we hardly saw any strikes adding reasonable OI.
OI
PRICE
SCRIP
OI
PRICE
Maximum buildup is seen in 8000 call and 7500 put
CHG. (%)
CHG. (%)
options. We believe Nifty may trade in a range of 7700-
MCLEODRUSS
2028400
-14.07
184.30
2.59
7750 on the lower side and 8050-8100 on the higher
MINDTREE
377600
-8.53
1485.65
-0.55
side. Trade accordingly.
DRREDDY
1783800
-6.52
3259.50
1.23
CIPLA
7313600
-4.22
661.25
1.61
CASTROLIND
2074600
-4.12
444.85
-0.60
Historical Volatility
Put-Call Ratio
SCRIP
HV
SCRIP
PCR-OI
PCR-VOL
TVSMOTOR
50.48
NIFTY
0.84
0.86
LUPIN
33.46
BANKNIFTY
1.11
0.87
GMRINFRA
74.96
RELIANCE
0.55
0.53
PNB
36.45
LT
0.60
0.41
JSWSTEEL
42.59
MARUTI
0.69
0.56
Strategy Date
Symbol
Strategy
Status
November 30, 2015
LT
Long Put
Active
2
Technical & Derivatives Report
December 03, 2015
FII Statistics for 02-December 2015
Turnover on 02-December 2015
Open Interest
No. of
Turnover
Change
Detail
Buy
Sell
Net
Instrument
Value
Change
Contracts
( in Cr. )
(%)
Contracts
(in Cr.)
(%)
INDEX
INDEX
635.11
1141.37
(506.26)
274079
16013.86
0.01
199297
11163.50
0.55
FUTURES
FUTURES
INDEX
INDEX
11491.56
10342.17
1149.39
1019907
60125.57
2.95
1465918
86616.73
-9.61
OPTIONS
OPTIONS
STOCK
STOCK
2818.51
3035.70
(217.19)
984237
49773.10
1.32
FUTURES
420655
21966.14
-5.79
FUTURES
STOCK
1210.65
1153.94
56.71
38254
1926.03
13.12
STOCK
OPTIONS
175792
9486.33
-2.27
OPTIONS
TOTAL
16155.83
15673.19
482.64
2316477
127838.55
2.05
TOTAL
2261662
129232.70
-7.66
Nifty Spot = 7931.35
Lot Size = 25
Bull-Call Spreads
Bear-Put Spreads
Action
Strike
Price
Risk
Reward
BEP
Action
Strike
Price
Risk
Reward
BEP
Buy
8000
106.60
Buy
7900
98.90
40.20
59.80
8040.20
32.10
67.90
7867.90
Sell
8100
66.40
Sell
7800
66.80
Buy
8000
106.60
Buy
7900
98.90
68.40
131.60
8068.40
54.35
145.65
7845.65
Sell
8200
38.20
Sell
7700
44.55
Buy
8100
66.40
Buy
7800
66.80
28.20
71.80
8128.20
22.25
77.75
7777.75
Sell
8200
38.20
Sell
7700
44.55
Note: Above mentioned Bullish or Bearish Spreads in Nifty (Dec. Series) are given as an information and not as a recommendation.
Nifty Put-Call Analysis
3
Technical & Derivatives Report
December 03, 2015
Daily Pivot Levels for Nifty 50 Stocks
Scrips
S2
S1
PIVOT
R1
R2
ACC
1,345
1,352
1,363
1,370
1,381
ADANIPORTS
257
259
262
265
268
AMBUJACEM
196
198
201
203
206
ASIANPAINT
831
840
854
862
876
AXISBANK
454
457
460
463
466
BAJAJ-AUTO
2,392
2,446
2,481
2,535
2,569
BANKBARODA
170
172
175
177
181
BHARTIARTL
313
318
322
327
331
BHEL
170
172
174
175
178
BOSCHLTD
18,327
18,460
18,574
18,707
18,820
BPCL
915
923
935
944
956
CAIRN
136
137
137
138
139
CIPLA
643
651
656
664
669
COALINDIA
332
335
341
344
350
DRREDDY
3,201
3,226
3,246
3,271
3,291
GAIL
354
357
361
364
368
GRASIM
3,719
3,738
3,752
3,770
3,785
HCLTECH
840
850
866
876
892
HDFC
1,190
1,201
1,217
1,228
1,244
HDFCBANK
1,060
1,069
1,081
1,090
1,102
HEROMOTOCO
2,630
2,653
2,678
2,701
2,725
HINDALCO
79
80
81
81
82
HINDUNILVR
817
824
830
836
842
ICICIBANK
265
268
271
274
278
IDEA
136
138
141
142
145
INDUSINDBK
931
937
941
947
951
INFY
1,046
1,053
1,067
1,074
1,088
ITC
340
345
347
352
355
KOTAKBANK
668
674
683
690
699
LT
1,338
1,346
1,360
1,368
1,382
LUPIN
1,788
1,829
1,854
1,896
1,920
M&M
1,357
1,364
1,370
1,377
1,384
MARUTI
4,530
4,574
4,601
4,645
4,672
NTPC
131
132
133
134
135
ONGC
231
233
236
238
240
PNB
136
138
141
143
147
POWERGRID
134
134
136
136
137
RELIANCE
959
968
974
984
989
SBIN
239
242
246
249
253
VEDL
92
93
95
96
97
SUNPHARMA
718
725
732
739
746
TATAMOTORS
406
409
414
418
423
TATAPOWER
65
66
66
67
67
TATASTEEL
235
239
243
247
250
TCS
2,332
2,348
2,363
2,380
2,395
TECHM
532
536
541
545
549
ULTRACEMCO
2,809
2,829
2,856
2,876
2,903
WIPRO
570
574
580
583
589
YESBANK
738
745
754
760
770
ZEEL
408
411
415
418
422
4
Technical & Derivatives Report
December 03, 2015
Research Team Tel: 022 - 39357800
For Technical Queries
For Derivatives Queries
DISCLAIMER
Angel Broking Private Limited (hereinafter referred to as “Angel”) is a registered Member of National Stock Exchange of India Limited,
Bombay Stock Exchange Limited and MCX Stock Exchange Limited. It is also registered as a Depository Participant with CDSL and
Portfolio Manager with SEBI. It also has registration with AMFI as a Mutual Fund Distributor. Angel Broking Private Limited is a
registered entity with SEBI for Research Analyst in terms of SEBI (Research Analyst) Regulations, 2014 vide registration number
INH000000164. Angel or its associates has not been debarred/ suspended by SEBI or any other regulatory authority for accessing
/dealing in securities Market. Angel or its associates including its relatives/analyst do not hold any financial interest/beneficial
ownership of more than 1% in the company covered by Analyst. Angel or its associates/analyst has not received any compensation /
managed or co-managed public offering of securities of the company covered by Analyst during the past twelve months. Angel/analyst
has not served as an officer, director or employee of company covered by Analyst and has not been engaged in market making activity
of the company covered by Analyst.
This document is solely for the personal information of the recipient, and must not be singularly used as the basis of any investment
decision. Nothing in this document should be construed as investment or financial advice. Each recipient of this document should
make such investigations as they deem necessary to arrive at an independent evaluation of an investment in the securities of the
companies referred to in this document (including the merits and risks involved), and should consult their own advisors to determine
the merits and risks of such an investment.
Reports based on technical and derivative analysis center on studying charts of a stock's price movement, outstanding positions and
trading volume, as opposed to focusing on a company's fundamentals and, as such, may not match with a report on a company's
fundamentals.
The information in this document has been printed on the basis of publicly available information, internal data and other reliable
sources believed to be true, but we do not represent that it is accurate or complete and it should not be relied on as such, as this
document is for general guidance only. Angel Broking Pvt. Limited or any of its affiliates/ group companies shall not be in any way
responsible for any loss or damage that may arise to any person from any inadvertent error in the information contained in this report.
Angel Broking Pvt. Limited has not independently verified all the information contained within this document. Accordingly, we cannot
testify, nor make any representation or warranty, express or implied, to the accuracy, contents or data contained within this document.
While Angel Broking Pvt. Limited endeavors to update on a reasonable basis the information discussed in this material, there may be
regulatory, compliance, or other reasons that prevent us from doing so.
This document is being supplied to you solely for your information, and its contents, information or data may not be reproduced,
redistributed or passed on, directly or indirectly.
Neither Angel Broking Pvt. Limited, nor its directors, employees or affiliates shall be liable for any loss or damage that may arise from
or in connection with the use of this information.
Note: Please refer to the important ‘Stock Holding Disclosure' report on the Angel website (Research Section). Also, please refer to the
latest update on respective stocks for the disclosure status in respect of those stocks. Angel Broking Pvt. Limited and its affiliates may
have investment positions in the stocks recommended in this report.
5