Technical & Derivatives Report
August 03, 2016
Sensex (27982) / Nifty (8623)
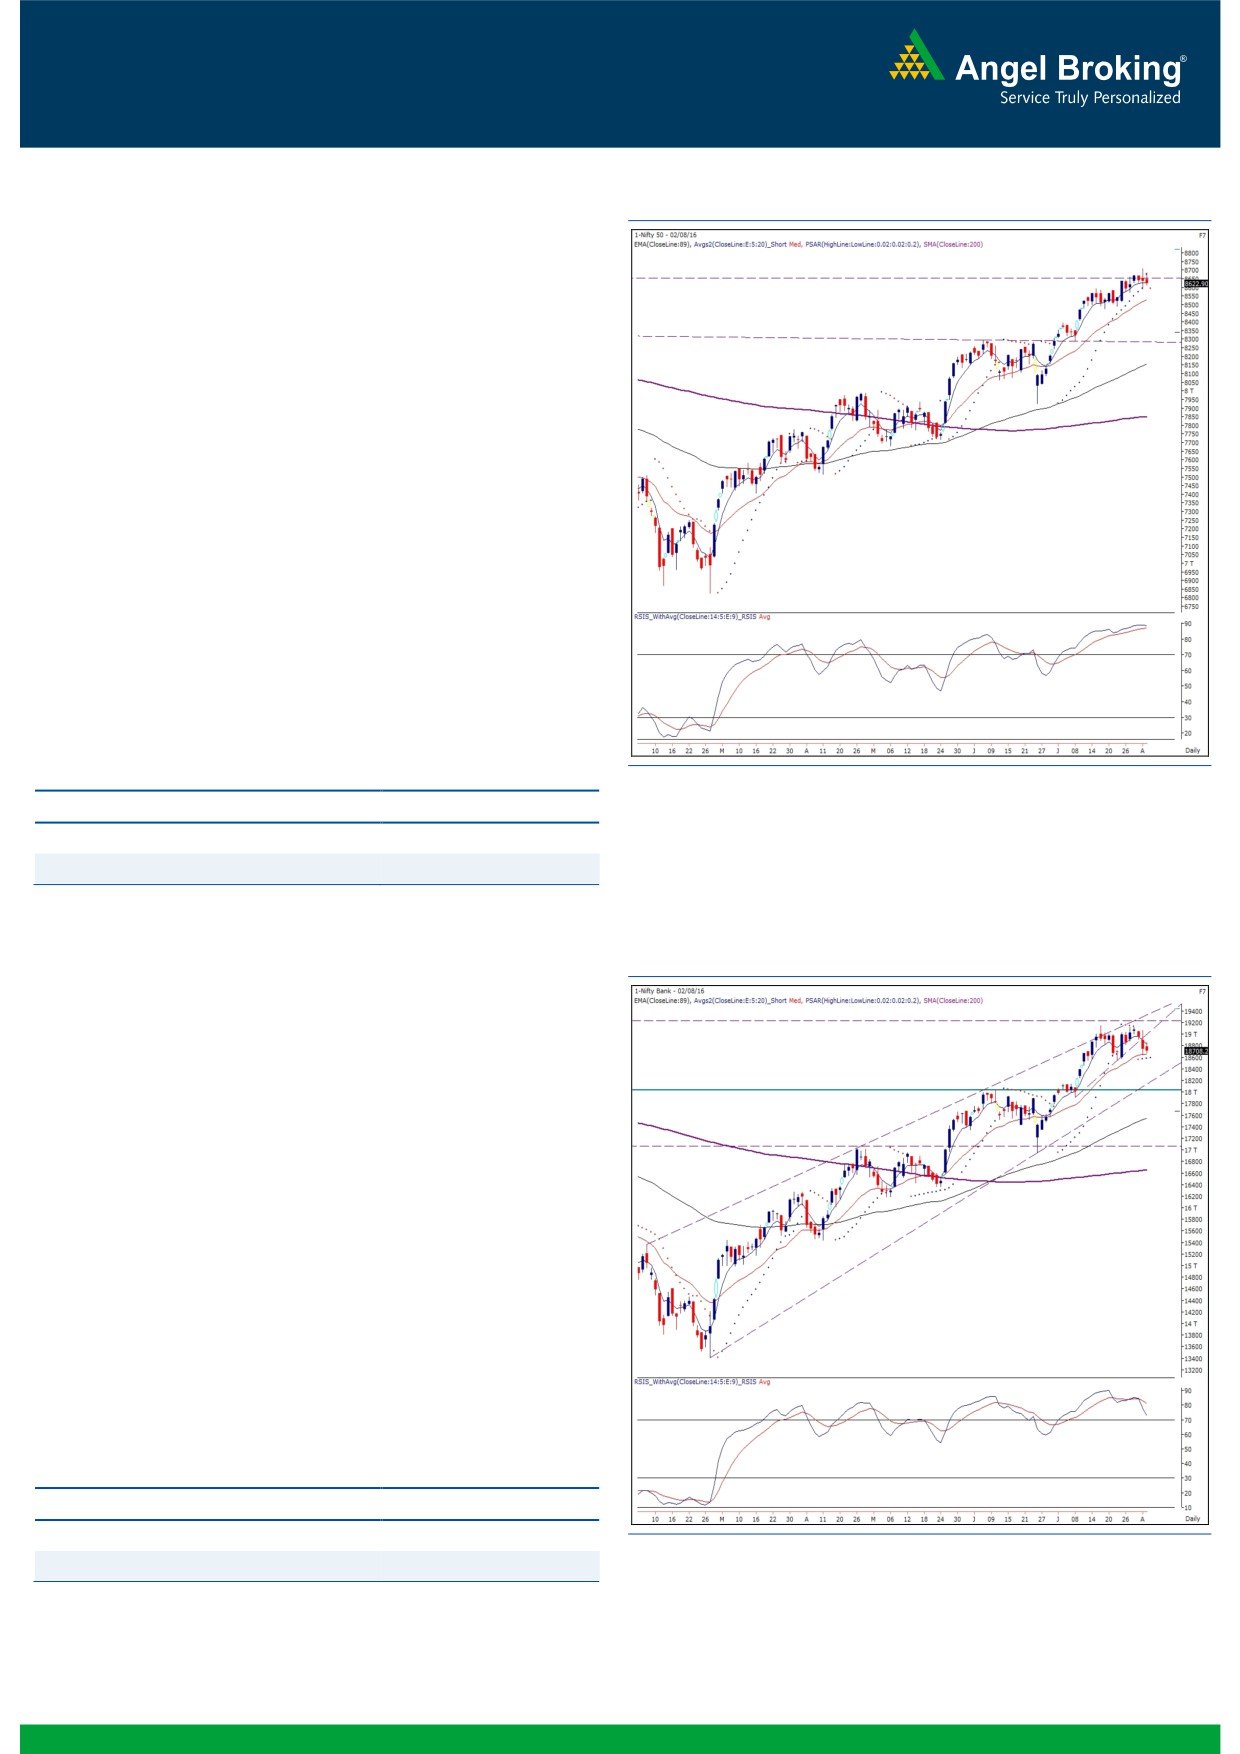
Exhibit 1: Nifty Daily Chart
Yesterday’s session opened on a flat note despite the SGX Nifty
having indicated a soft start for our market. Quite similar to the
previous session, the Nifty inched higher in the first half, however,
as expected; we saw a gradual decline in the market immediately
post the mid-session to close with marginal losses.
Unlike Monday’s session, we were not so surprised by yesterday’s
corrective move in the latter half. We were prepared for this
intraday weakness as couple of technical evidences, such as the
‘Super Trend’ and the 78.6% Fibonacci retracement level (of
Monday’s down move) on hourly chart was placed around the
8680 mark. Since last three days, we have been repeatedly
advocating on avoiding aggressive positions in the market as the
overall volatility has increased substantially and the index is now
undergoing a consolidation phase. We reiterate that traders
should now stay light on positions and avoid taking undue risks.
For the coming session, 8590 - 8572 and 8640 - 8680 would
act as immediate supports and resistances, respectively.
Key Levels
Support 1 - 8590
Resistance 1 - 8640
Support 2 - 8572
Resistance 2 - 8680
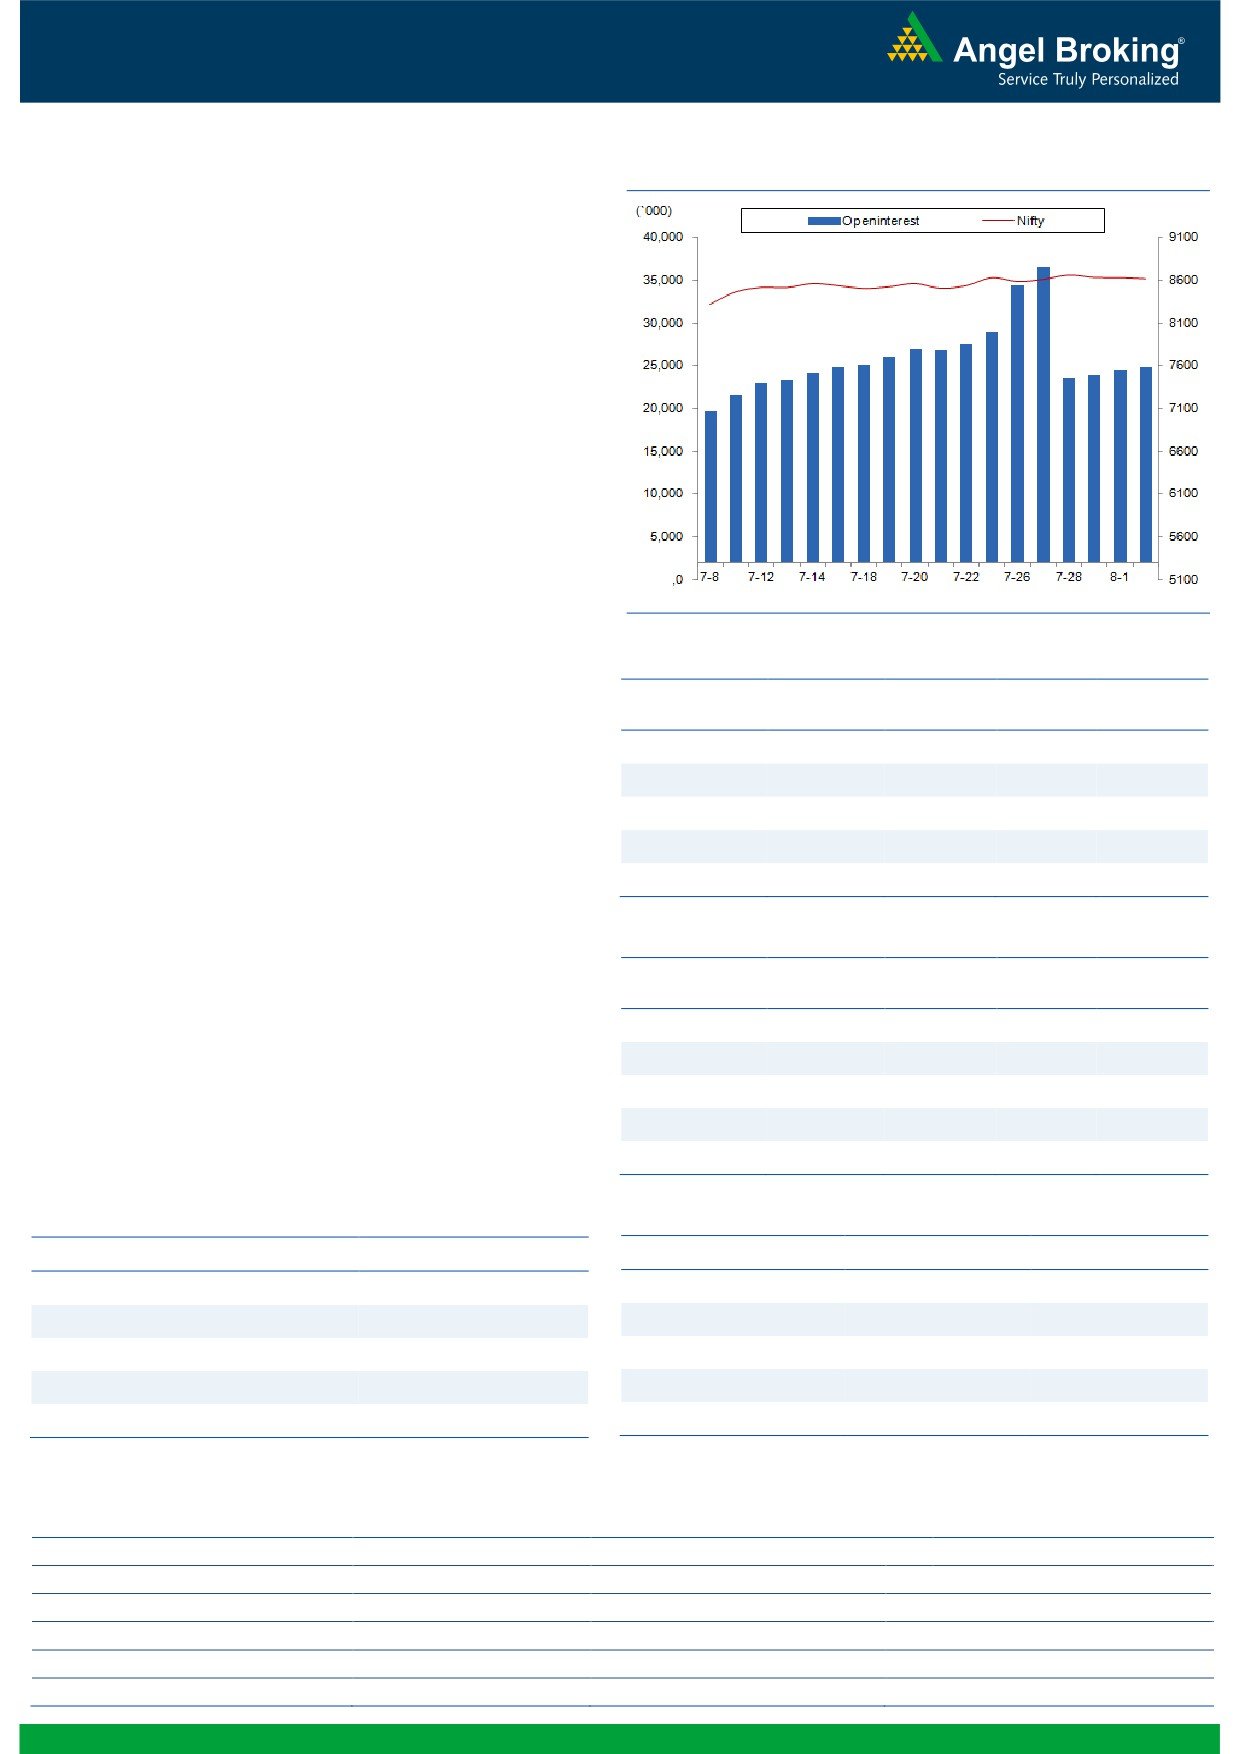
Nifty Bank Outlook - (18708)
Exhibit 2: Nifty Bank Daily Chart
In yesterday's trading session, the Nifty Bank index traded in a
narrow range and ended the session with marginal loss of 0.17
percent. The PSU Banking stocks were the outperformers where
the Nifty PSU Bank index gained 0.72 percent over its previous
sessions close.
During the last couple of days, the index has corrected marginally
and has breached trendline support on hourly chart. Also, the
indicators such as 'Super Trend' and 'PSAR' are indicating
resistance in range of 18870 - 18950 and the bulls have
herculean task to cross the mentioned resistance for resumption
of the up move. Meanwhile, the support on higher degree (daily)
charts is placed around 18550. Though there is no major sign of
trend reversal at this juncture, we are expecting increased volatility
in near term and thus, traders are advised to stay light and trade
on stock specific moves.
Key Levels
Support 1 - 18550
Resistance 1 - 18870
Support 2 - 18500
Resistance 2 - 18950
1
Technical & Derivatives Report
August 03, 2016
Comments
Nifty Vs OI
The Nifty futures open interest has increased by 1.45%
BankNifty futures open interest has increased by 1.11%
as market closed at 8622.90 levels.
The Nifty August future closed with a premium of 37.40
points against a premium of 45.45 points in previous
session. The September series closed at a premium of
86.45 points.
The Implied Volatility of at the money options has
increased from 14.34% to 14.68%.
The total OI of the market is Rs. 2,34,232/- cr. and the
stock futures OI is Rs. 70,668/- cr.
Few of the liquid counters where we have seen high cost
of carry are JPASSOCIAT, SUNTV, JSWSTEEL,
HDFCBANK and GMRINFRA.
Views
OI Gainers
Yesterday, FIIs were net buyer in equity cash segment
OI
PRICE
worth Rs. 536 crores. While, their activity remained
SCRIP
OI
PRICE
CHG. (%)
CHG. (%)
subdued in index future segment with marginal rise in
HCLTECH
7886900
30.04
801.80
2.76
open interest, indicating blend of both long and short
BATAINDIA
2591600
27.77
580.65
-3.49
build-up.
TATACOMM
4177600
18.27
464.00
6.13
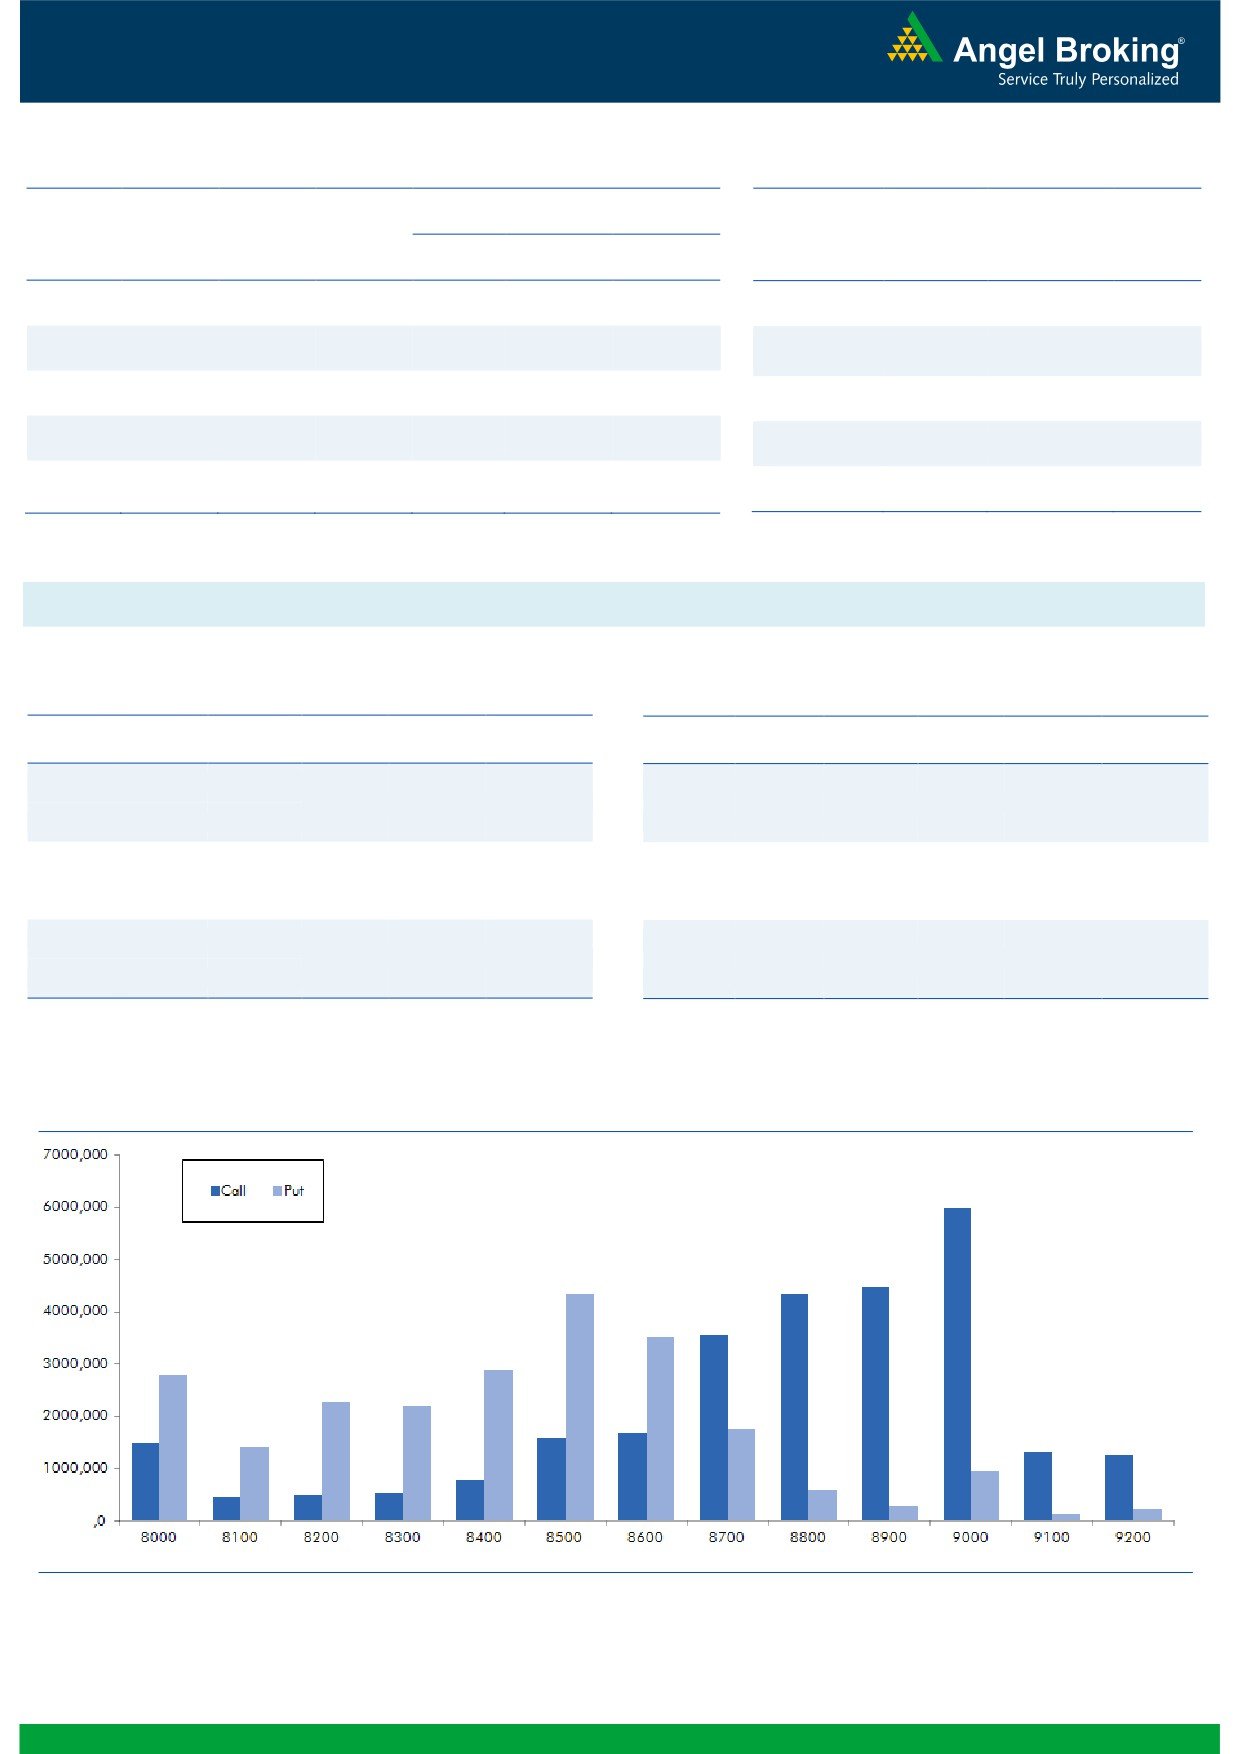
In Index Options segment, FIIs bought worth Rs. 520
crores with rise in OI. In call options, 8700-8900 strikes
BHARATFIN
7765000
18.19
828.05
-9.71
were active and added good amount of fresh positions.
ABIRLANUVO
2867250
15.01
1465.95
-1.01
On the other hand, we didn’t witness any major activity
in put options, except marginal OI addition in 8700 and
OI Losers
8600 strikes. Highest build-up in August series is placed
OI
PRICE
SCRIP
OI
PRICE
at 9000 call and 8500 put options.
CHG. (%)
CHG. (%)
Since, FIIs are continuously buying in both cash and
TORNTPHARM
260400
-18.73
1485.30
1.26
index future segment and yet there is no sign of reversal
TECHM
6986100
-7.20
502.15
2.11
seen on derivative data; we advise traders to trade with
ADANIENT
14328000
-6.67
78.10
-0.13
positive bias and use declines to initiate fresh positions.
JINDALSTEL
57420000
-6.44
84.00
-6.41
Support for Nifty is placed at 8500 - 8550 levels; while,
SRTRANSFIN
2490600
-6.32
1288.30
-1.21
resistance is at 8800 - 8850.
Historical Volatility
Put-Call Ratio
SCRIP
HV
SCRIP
PCR-OI
PCR-VOL
TATACOMM
38.76
NIFTY
0.91
0.88
BHARATFIN
68.96
BANKNIFTY
0.62
0.75
IDFC
50.64
ICICIBANK
0.37
0.34
SIEMENS
31.73
LT
0.54
0.51
ITC
30.60
INFY
0.29
0.23
Strategy Date
Symbol
Strategy
Status
01-08-2016
RELIANCE
Ratio Bear Put Spread
Active
2
Technical & Derivatives Report
August 03, 2016
FII Statistics for 02-August 2016
Turnover on 02-August 2016
Open Interest
No. of
Turnover
Change
Detail
Buy
Sell
Net
Instrument
Value
Contracts
( in Cr. )
(%)
Contracts
Change (%)
(in Cr.)
INDEX
INDEX
1453.95
1450.09
3.87
299208
19751.14
1.88
184012
12565.78
-30.03
FUTURES
FUTURES
INDEX
INDEX
38846.72
38326.90
519.82
830821
54101.47
3.16
2561669
179178.45
-12.46
OPTIONS
OPTIONS
STOCK
5695.23
6536.30
(841.06)
814984
52819.22
2.48
STOCK
FUTURES
587064
41073.42
-6.73
FUTURES
STOCK
STOCK
3402.92
3474.33
(71.41)
48137
3192.85
16.45
OPTIONS
307197
21892.75
-12.37
OPTIONS
TOTAL
49398.83
49787.62
(388.79)
1993150
129864.67
2.97
TOTAL
3639942
254710.39
-12.67
Nifty Spot = 8622.90
Lot Size = 75
Bull-Call Spreads
Bear-Put Spreads
Action
Strike
Price
Risk
Reward
BEP
Action
Strike
Price
Risk
Reward
BEP
Buy
8700
107.20
Buy
8600
101.45
41.10
58.90
8741.10
33.25
66.75
8566.75
Sell
8800
66.10
Sell
8500
68.20
Buy
8700
107.20
Buy
8600
101.45
69.80
130.20
8769.80
56.20
143.80
8543.80
Sell
8900
37.40
Sell
8400
45.25
Buy
8800
66.10
Buy
8500
68.20
28.70
71.30
8828.70
22.95
77.05
8477.05
Sell
8900
37.40
Sell
8400
45.25
Note: Above mentioned Bullish or Bearish Spreads in Nifty (August Series) are given as an information and not as a recommendation.
Nifty Put-Call Analysis
3
Technical & Derivatives Report
August 03, 2016
Daily Pivot Levels for Nifty Constituents
Scrips
S2
S1
PIVOT
R1
R2
ACC
1,644
1,657
1,673
1,687
1,702
ADANIPORTS
219
222
227
230
235
AMBUJACEM
258
261
266
269
273
ASIANPAINT
1,104
1,114
1,128
1,138
1,152
AUROPHARMA
741
753
773
784
804
AXISBANK
542
546
551
554
559
BAJAJ-AUTO
2,697
2,723
2,751
2,776
2,805
BANKBARODA
144
148
150
154
156
BHEL
134
136
140
142
146
BPCL
563
571
585
594
608
BHARTIARTL
350
354
359
363
369
INFRATEL
374
381
394
400
413
BOSCH
23,931
24,192
24,596
24,857
25,260
CIPLA
508
513
521
527
535
COALINDIA
318
320
325
327
332
DRREDDY
2,946
2,962
2,980
2,996
3,014
EICHERMOT
21,315
21,581
22,065
22,331
22,815
GAIL
370
373
377
381
385
GRASIM
4,927
4,959
5,003
5,035
5,078
HCLTECH
772
786
796
810
819
HDFCBANK
1,231
1,237
1,247
1,253
1,263
HDFC
1,311
1,326
1,350
1,366
1,389
HEROMOTOCO
3,162
3,212
3,246
3,296
3,329
HINDALCO
132
134
136
138
140
HINDUNILVR
914
921
931
937
947
ICICIBANK
242
244
247
248
251
IDEA
101
102
104
105
107
INDUSINDBK
1,176
1,184
1,198
1,207
1,221
INFY
1,071
1,078
1,081
1,088
1,091
ITC
247
254
258
265
269
KOTAKBANK
745
752
758
765
771
LT
1,479
1,491
1,502
1,515
1,526
LUPIN
1,667
1,684
1,715
1,732
1,763
M&M
1,429
1,444
1,466
1,480
1,503
MARUTI
4,809
4,898
4,968
5,057
5,127
NTPC
157
158
160
161
162
ONGC
216
219
220
223
225
POWERGRID
174
177
178
181
183
RELIANCE
999
1,006
1,013
1,020
1,027
SBIN
225
227
229
230
232
SUNPHARMA
814
821
834
842
855
TCS
2,676
2,687
2,702
2,713
2,727
TATAMTRDVR
313
318
326
331
340
TATAMOTORS
479
486
499
506
519
TATAPOWER
71
71
72
72
73
TATASTEEL
354
358
364
368
375
TECHM
473
486
498
511
523
ULTRACEMCO
3,601
3,639
3,698
3,736
3,795
WIPRO
541
545
552
556
563
YESBANK
1,210
1,219
1,232
1,241
1,254
ZEEL
488
494
500
505
511
4
Technical & Derivatives Report
August 03, 2016
Research Team Tel: 022 - 39357800
For Technical Queries
For Derivatives Queries
DISCLAIMER
Angel Broking Private Limited (hereinafter referred to as “Angel”) is a registered Member of National Stock Exchange of India Limited,
Bombay Stock Exchange Limited and Metropolitan Stock Exchange Limited. It is also registered as a Depository Participant with CDSL
and Portfolio Manager with SEBI. It also has registration with AMFI as a Mutual Fund Distributor. Angel Broking Private Limited is a
registered entity with SEBI for Research Analyst in terms of SEBI (Research Analyst) Regulations, 2014 vide registration number
INH000000164. Angel or its associates has not been debarred/ suspended by SEBI or any other regulatory authority for accessing
/dealing in securities Market. Angel or its associates/analyst has not received any compensation / managed or co-managed public
offering of securities of the company covered by Analyst during the past twelve months.
This document is solely for the personal information of the recipient, and must not be singularly used as the basis of any investment
decision. Nothing in this document should be construed as investment or financial advice. Each recipient of this document should
make such investigations as they deem necessary to arrive at an independent evaluation of an investment in the securities of the
companies referred to in this document (including the merits and risks involved), and should consult their own advisors to determine
the merits and risks of such an investment.
Reports based on technical and derivative analysis center on studying charts of a stock's price movement, outstanding positions and
trading volume, as opposed to focusing on a company's fundamentals and, as such, may not match with a report on a company's
fundamentals. Investors are advised to refer the Fundamental and Technical Research Reports available on our website to evaluate the
contrary view, if any.
The information in this document has been printed on the basis of publicly available information, internal data and other reliable
sources believed to be true, but we do not represent that it is accurate or complete and it should not be relied on as such, as this
document is for general guidance only. Angel Broking Pvt. Limited or any of its affiliates/ group companies shall not be in any way
responsible for any loss or damage that may arise to any person from any inadvertent error in the information contained in this report.
Angel Broking Pvt. Limited has not independently verified all the information contained within this document. Accordingly, we cannot
testify, nor make any representation or warranty, express or implied, to the accuracy, contents or data contained within this document.
While Angel Broking Pvt. Limited endeavors to update on a reasonable basis the information discussed in this material, there may be
regulatory, compliance, or other reasons that prevent us from doing so.
This document is being supplied to you solely for your information, and its contents, information or data may not be reproduced,
redistributed or passed on, directly or indirectly.
Neither Angel Broking Pvt. Limited, nor its directors, employees or affiliates shall be liable for any loss or damage that may arise from
or in connection with the use of this information.
5