Technical & Derivatives Report
May 03, 2016
Sensex (25437) / Nifty (7806)
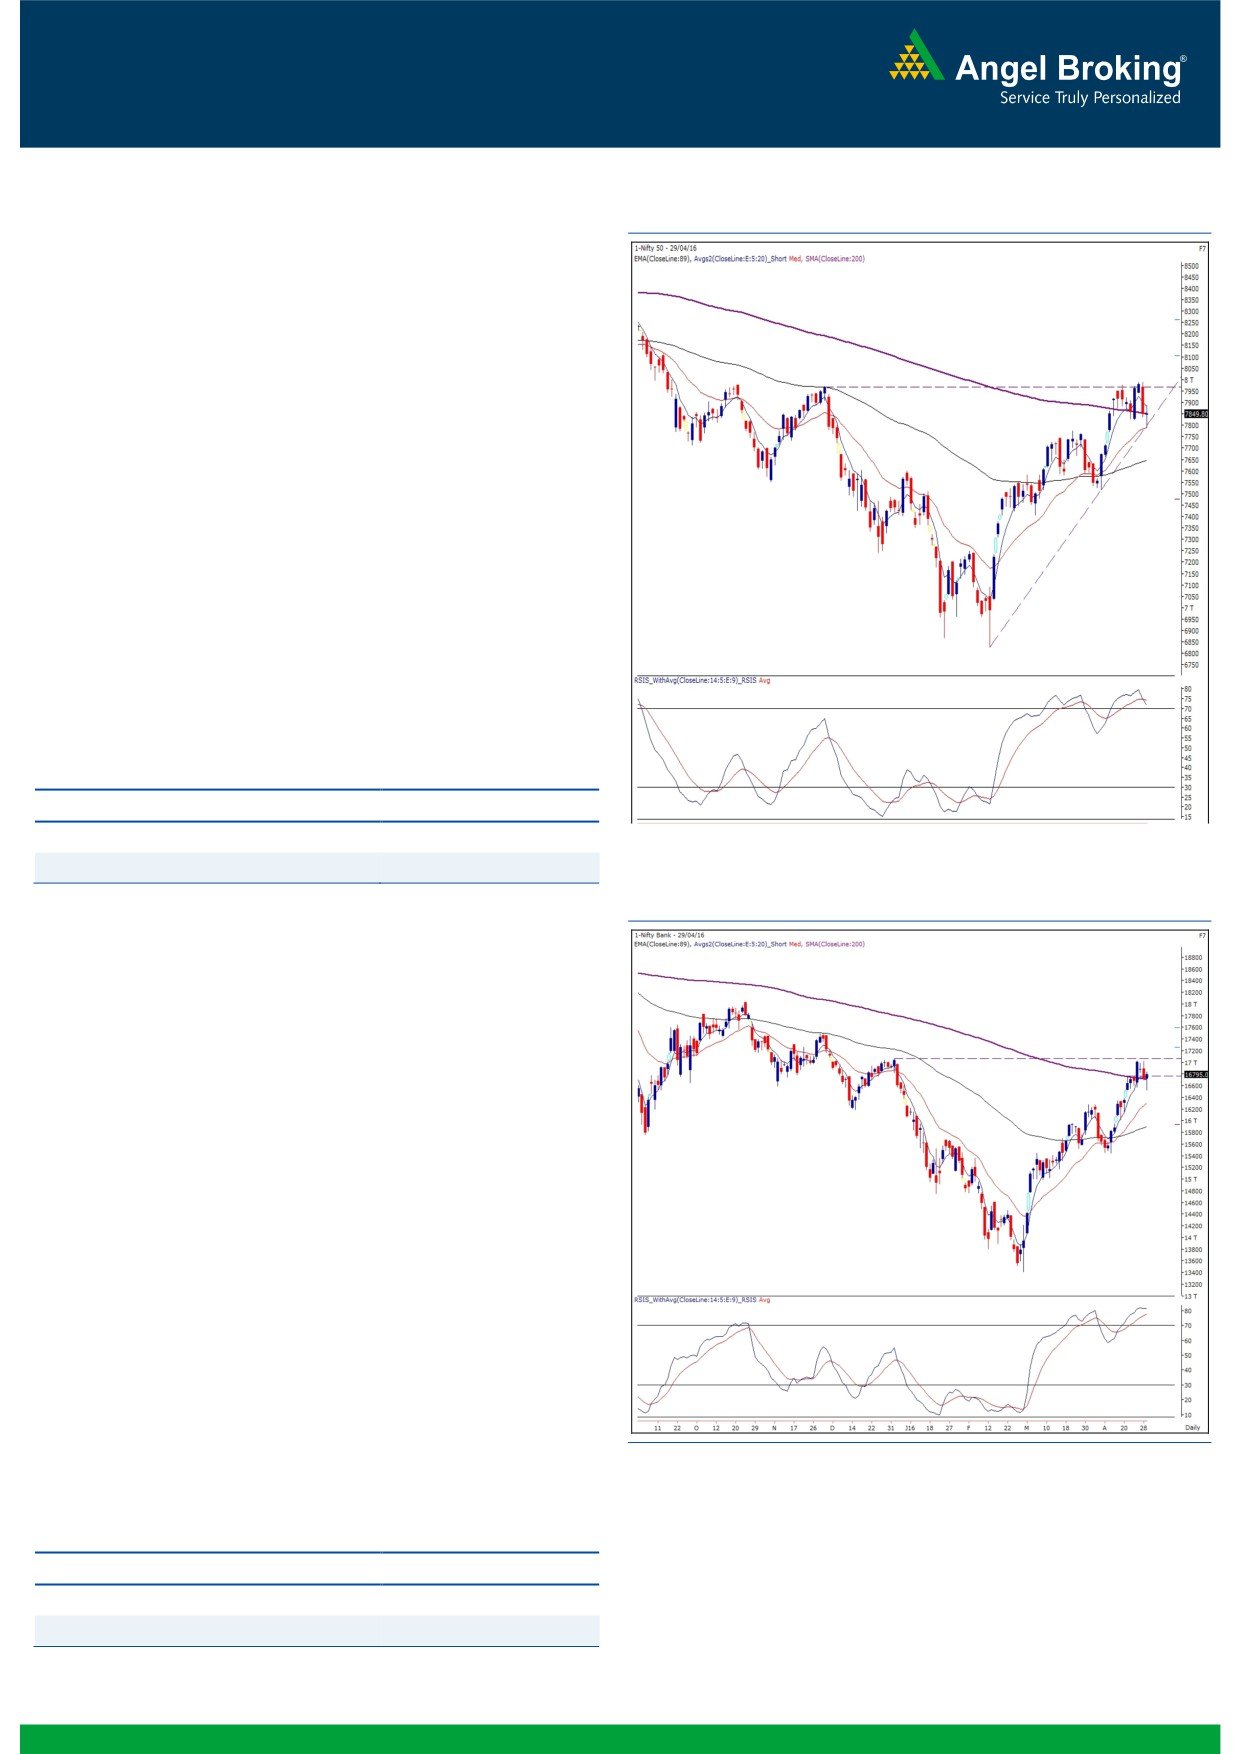
Exhibit 1: Nifty Daily Chart
The opening session of the week began with a marginal downside
gap and corrected in the first half of the session. However, similar
to Friday's session, we witnessed a modest recovery in the latter
half to close the session tad above 7800.
If we closely observe yesterday's low, the Nifty manages to find a
support around the mentioned support zone of 7800 - 7750
which coincides with multiple technical evidences, namely, the
daily ’20 EMA’, ‘Parabolic SAR’ indicator and an ‘Upward Sloping
Trend Line’. We reiterate our view that as long as the Nifty
manages to hold these important supports, the possibility of it
surpassing the 8000 mark increases while the 7750 mark on the
downside should be seen as a trend deciding level in the near
term. A sustainable move below this level could possibly
accelerate the ongoing downward momentum. We suggest one
should now look for buying opportunities, invariably backing up
trades with strict stop losses, given that the Nifty has a strong
support at 7750.
Key Levels
Support 1 - 7750
Resistance 1 - 7860
Support 2 - 7700
Resistance 2 - 7910
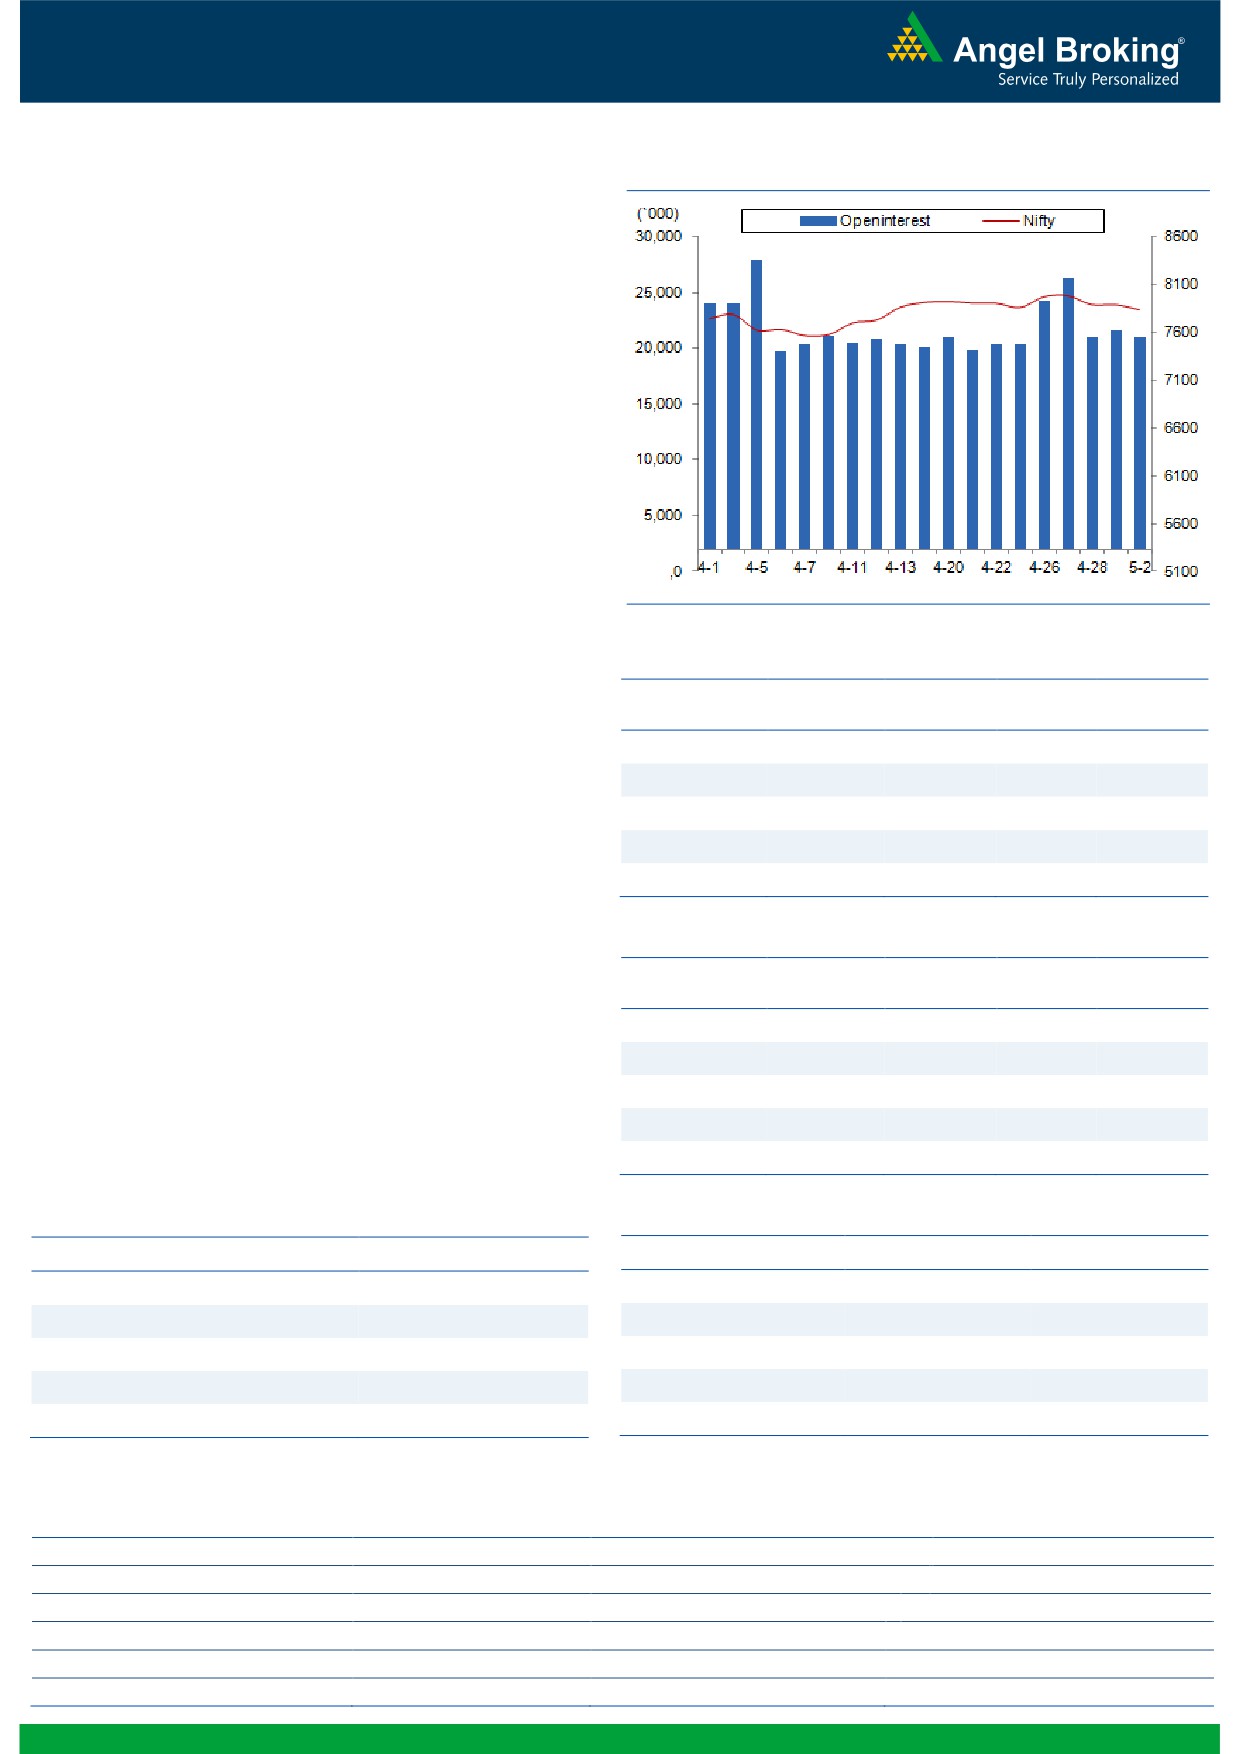
Exhibit 2: Nifty Bank Daily Chart
Nifty Bank Outlook - (16543)
In yesterday's trading session, the Nifty Bank index opened with a
gap down opening and traded in a narrow range throughout the
session before closing with losses of about 1.50%.
In our earlier reports, we have been mentioning about the
cautious signs in the Nifty Bank index as indicated by negative
crossover in RSI with its average post testing the overbought zone.
The index has thus shown marginal corrective move from the high
of 17029.85 registered on 26th April. However, the correction
has been led by few of the heavyweights such as ICICI Bank and
not due to broader market participation. The higher top higher
bottom formation is not yet negated and hence, the previous high
around 16280 is now a support for the index.Thus, we are not
expecting any sharp correction further in the index. In case the
index again moves higher without breaching the above
mentioned support, it could then lead to resumption of uptrend.
Traders are advised not create an short positions in the index. The
intraday support for the Nifty Bank index is placed around 16387
and 16280 whereas resistance are seen around 16841 and
17024.
Key Levels
Support 1 - 16387
Resistance 1 - 16841
Support 2 - 16280
Resistance 2 - 17024
1
Technical & Derivatives Report
May 03, 2016
Comments
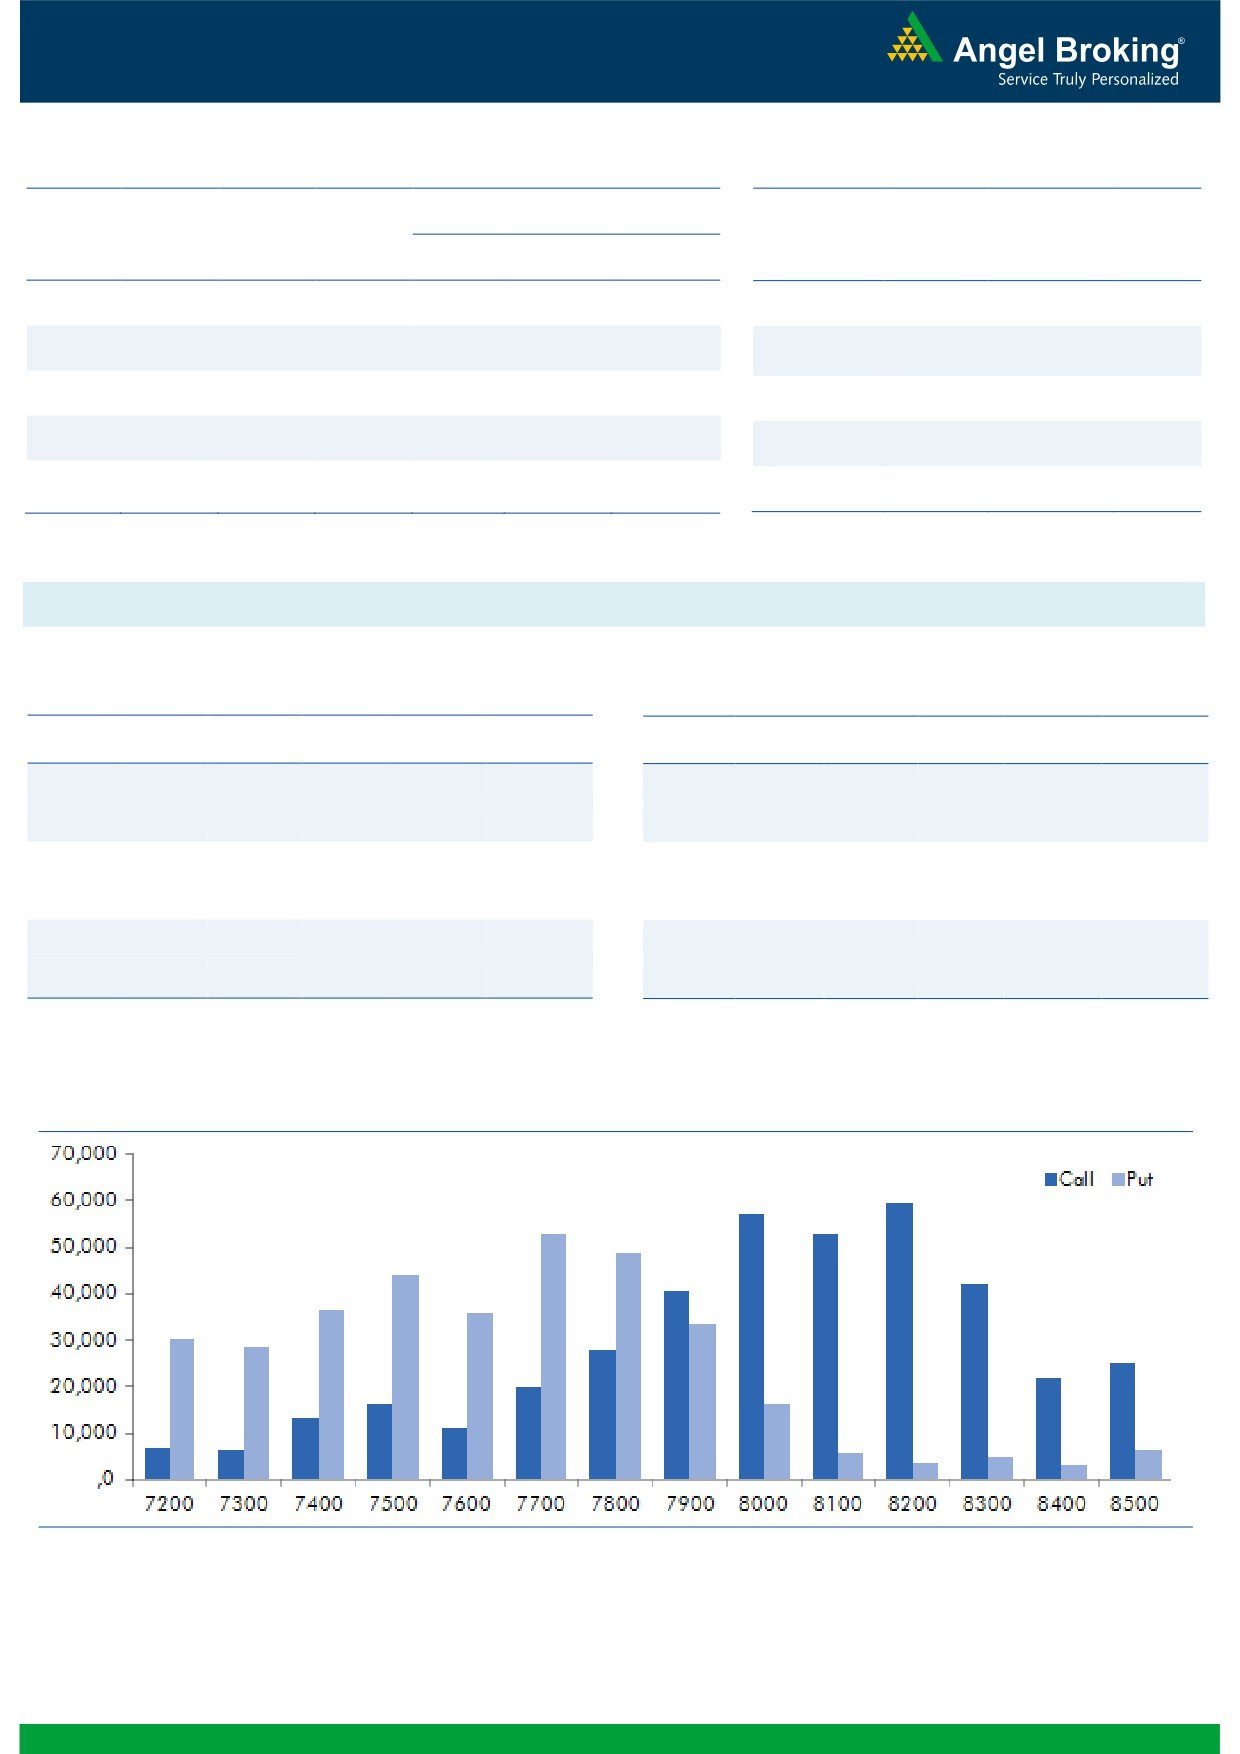
Nifty Vs OI
The Nifty futures open interest has decreased by 3.30%
BankNifty futures open interest has increased by 1.00%
as market closed at 7805.90 levels.
The Nifty May future closed at a premium of 34.20
points against a premium of 45.00 points. The June
series closed at a premium of 47.60 points.
The Implied Volatility of at the money options has
increased from 15.03% to 15.54%.
The total OI of the market is Rs. 1,87,274/- cr. and the
stock futures OI is Rs. 58,393/- cr.
Few of the liquid counters where we have seen high cost
of carry are UNITECH, NHPC, JISLJALEQS, KPIT and
HEROMOTOCO.
Views
FIIs were net buyers in cash market segment to the tune
OI Gainers
of Rs. 435 crores. While in Index Futures, they sold of Rs.
OI
PRICE
SCRIP
OI
PRICE
1340 crores with fall in OI, which suggests long
CHG. (%)
CHG. (%)
UPL
7856000
22.58
594.90
10.62
unwinding in last trading session.
SRTRANSFIN
2703000
17.23
1083.00
14.98
In Index Options front, FIIs sold marginally with decent
NCC
11704000
12.89
80.15
2.74
rise in OI. In call options, 8000 strikes added good
BANKINDIA
21171000
9.97
90.10
-2.54
amount of open interest. While in put options, the overall
IBREALEST
28980000
9.67
67.50
0.00
activity was subdued. Maximum OI in May series is
visible in 8200 call and 7700 put options. From last two
trading session, we are witnessing long unwinding and
OI Losers
some short formation in Index Futures. We would suggest
OI
PRICE
SCRIP
OI
PRICE
trader to be light in this market till we see any
CHG. (%)
CHG. (%)
M&M
3255200
-3.90
1336.55
0.16
meaningful change in data. Large cap counters that
added higest OI are HEROMOTOCO, VEDL, DRREDDY,
ARVIND
3806300
-3.41
286.85
3.20
HCLTECH and PNB.
INFRATEL
3993600
-3.24
375.65
0.28
BPCL
4986000
-3.12
969.55
-0.63
TCS
3921800
-3.02
2526.70
-0.28
Historical Volatility
Put-Call Ratio
SCRIP
HV
SCRIP
PCR-OI
PCR-VOL
SRTRANSFIN
74.09
NIFTY
0.90
0.84
UPL
61.81
BANKNIFTY
0.83
0.84
DABUR
43.96
SBIN
0.55
0.47
L&TFH
48.70
ICICIBANK
0.48
0.64
GODREJCP
37.67
RELIANCE
0.40
0.38
Strategy Date
Symbol
Strategy
Status
02-05-2016
NIFTY
Long Strangle
Active
2
Technical & Derivatives Report
May 03, 2016
FII Statistics for 02-May 2016
Turnover on 02-May 2016
Open Interest
No. of
Turnover
Change
Detail
Buy
Sell
Net
Instrument
Value
Contracts
( in Cr. )
(%)
Contracts
Change (%)
(in Cr.)
INDEX
INDEX
864.35
2204.68
(1340.33)
287048
16503.43
(2.90)
262833
14497.98
-31.76
FUTURES
FUTURES
INDEX
INDEX
16241.72
16336.58
(94.86)
803281
46690.95
3.75
1938968
113173.02
-27.04
OPTIONS
OPTIONS
STOCK
3866.24
4276.09
(409.86)
955068
46253.74
0.73
STOCK
FUTURES
510197
26084.49
-18.35
FUTURES
STOCK
STOCK
1822.98
1816.97
6.01
29547
1479.29
28.45
OPTIONS
243753
12513.09
-20.85
OPTIONS
TOTAL
22795.29
24634.32
(1839.03)
2074944
110927.40
1.66
TOTAL
2955751
166268.57
-25.81
Nifty Spot = 7805.90
Lot Size = 75
Bull-Call Spreads
Bear-Put Spreads
Action
Strike
Price
Risk
Reward
BEP
Action
Strike
Price
Risk
Reward
BEP
Buy
7800
145.70
Buy
7800
107.00
50.95
49.05
7850.95
34.15
65.85
7765.85
Sell
7900
94.75
Sell
7700
72.85
Buy
7800
145.70
Buy
7800
107.00
88.00
112.00
7888.00
57.90
142.10
7742.10
Sell
8000
57.70
Sell
7600
49.10
Buy
7900
94.75
Buy
7700
72.85
37.05
62.95
7937.05
23.75
76.25
7676.25
Sell
8000
57.70
Sell
7600
49.10
Note: Above mentioned Bullish or Bearish Spreads in Nifty (May Series) are given as an information and not as a recommendation.
Nifty Put-Call Analysis
3
Technical & Derivatives Report
May 03, 2016
Daily Pivot Levels for Nifty Constituents
Scrips
S2
S1
PIVOT
R1
R2
ACC
1,397
1,409
1,428
1,439
1,458
ADANIPORTS
229
231
234
236
239
AMBUJACEM
217
220
222
226
228
ASIANPAINT
857
861
864
868
871
AUROPHARMA
756
763
768
776
781
AXISBANK
463
467
473
478
484
BAJAJ-AUTO
2,409
2,444
2,484
2,519
2,559
BANKBARODA
153
154
156
158
160
BHEL
121
125
127
130
132
BPCL
953
961
974
983
995
BHARTIARTL
351
355
360
363
368
INFRATEL
368
372
375
379
382
BOSCH
19,302
19,453
19,651
19,803
20,001
CIPLA
530
536
540
545
550
COALINDIA
286
287
288
290
290
DRREDDY
2,957
2,984
3,033
3,060
3,109
EICHERMOT
19,598
19,726
19,928
20,056
20,258
GAIL
351
360
365
373
378
GRASIM
4,024
4,047
4,074
4,097
4,124
HCLTECH
730
736
746
752
762
HDFCBANK
1,107
1,112
1,121
1,126
1,135
HDFC
1,071
1,081
1,089
1,100
1,108
HEROMOTOCO
2,863
2,884
2,907
2,928
2,951
HINDALCO
92
95
98
101
104
HINDUNILVR
850
857
862
869
874
ICICIBANK
222
225
228
230
233
IDEA
114
116
118
120
121
INDUSINDBK
1,032
1,039
1,047
1,053
1,061
INFY
1,188
1,194
1,203
1,209
1,218
ITC
317
319
322
324
326
KOTAKBANK
706
712
718
725
731
LT
1,228
1,239
1,248
1,259
1,268
LUPIN
1,593
1,606
1,616
1,629
1,640
M&M
1,300
1,318
1,332
1,350
1,363
MARUTI
3,719
3,775
3,807
3,863
3,896
NTPC
132
135
138
141
143
ONGC
213
216
218
220
223
POWERGRID
140
142
143
144
145
RELIANCE
971
979
986
994
1,000
SBIN
184
185
187
188
190
SUNPHARMA
799
805
811
817
822
TCS
2,489
2,508
2,519
2,538
2,549
TATAMTRDVR
289
292
295
298
301
TATAMOTORS
399
403
407
411
415
TATAPOWER
69
69
70
71
72
TATASTEEL
341
344
347
351
354
TECHM
470
474
479
483
489
ULTRACEMCO
3,110
3,143
3,170
3,203
3,230
WIPRO
541
545
549
553
557
YESBANK
932
938
948
955
964
ZEEL
409
413
415
419
421
4
Technical & Derivatives Report
May 03, 2016
Research Team Tel: 022 - 39357800
For Technical Queries
For Derivatives Queries
DISCLAIMER
Angel Broking Private Limited (hereinafter referred to as “Angel”) is a registered Member of National Stock Exchange of India Limited,
Bombay Stock Exchange Limited and MCX Stock Exchange Limited. It is also registered as a Depository Participant with CDSL and
Portfolio Manager with SEBI. It also has registration with AMFI as a Mutual Fund Distributor. Angel Broking Private Limited is a
registered entity with SEBI for Research Analyst in terms of SEBI (Research Analyst) Regulations, 2014 vide registration number
INH000000164. Angel or its associates has not been debarred/ suspended by SEBI or any other regulatory authority for accessing
/dealing in securities Market. Angel or its associates including its relatives/analyst do not hold any financial interest/beneficial
ownership of more than 1% in the company covered by Analyst. Angel or its associates/analyst has not received any compensation /
managed or co-managed public offering of securities of the company covered by Analyst during the past twelve months. Angel/analyst
has not served as an officer, director or employee of company covered by Analyst and has not been engaged in market making activity
of the company covered by Analyst.
This document is solely for the personal information of the recipient, and must not be singularly used as the basis of any investment
decision. Nothing in this document should be construed as investment or financial advice. Each recipient of this document should
make such investigations as they deem necessary to arrive at an independent evaluation of an investment in the securities of the
companies referred to in this document (including the merits and risks involved), and should consult their own advisors to determine
the merits and risks of such an investment.
Reports based on technical and derivative analysis center on studying charts of a stock's price movement, outstanding positions and
trading volume, as opposed to focusing on a company's fundamentals and, as such, may not match with a report on a company's
fundamentals.
The information in this document has been printed on the basis of publicly available information, internal data and other reliable
sources believed to be true, but we do not represent that it is accurate or complete and it should not be relied on as such, as this
document is for general guidance only. Angel Broking Pvt. Limited or any of its affiliates/ group companies shall not be in any way
responsible for any loss or damage that may arise to any person from any inadvertent error in the information contained in this report.
Angel Broking Pvt. Limited has not independently verified all the information contained within this document. Accordingly, we cannot
testify, nor make any representation or warranty, express or implied, to the accuracy, contents or data contained within this document.
While Angel Broking Pvt. Limited endeavors to update on a reasonable basis the information discussed in this material, there may be
regulatory, compliance, or other reasons that prevent us from doing so.
This document is being supplied to you solely for your information, and its contents, information or data may not be reproduced,
redistributed or passed on, directly or indirectly.
Neither Angel Broking Pvt. Limited, nor its directors, employees or affiliates shall be liable for any loss or damage that may arise from
or in connection with the use of this information.
Note: Please refer to the important ‘Stock Holding Disclosure' report on the Angel website (Research Section). Also, please refer to the
latest update on respective stocks for the disclosure status in respect of those stocks. Angel Broking Pvt. Limited and its affiliates may
have investment positions in the stocks recommended in this report.
5