Technical & Derivatives Report
February 03, 2016
Sensex (24539) / Nifty (7456)
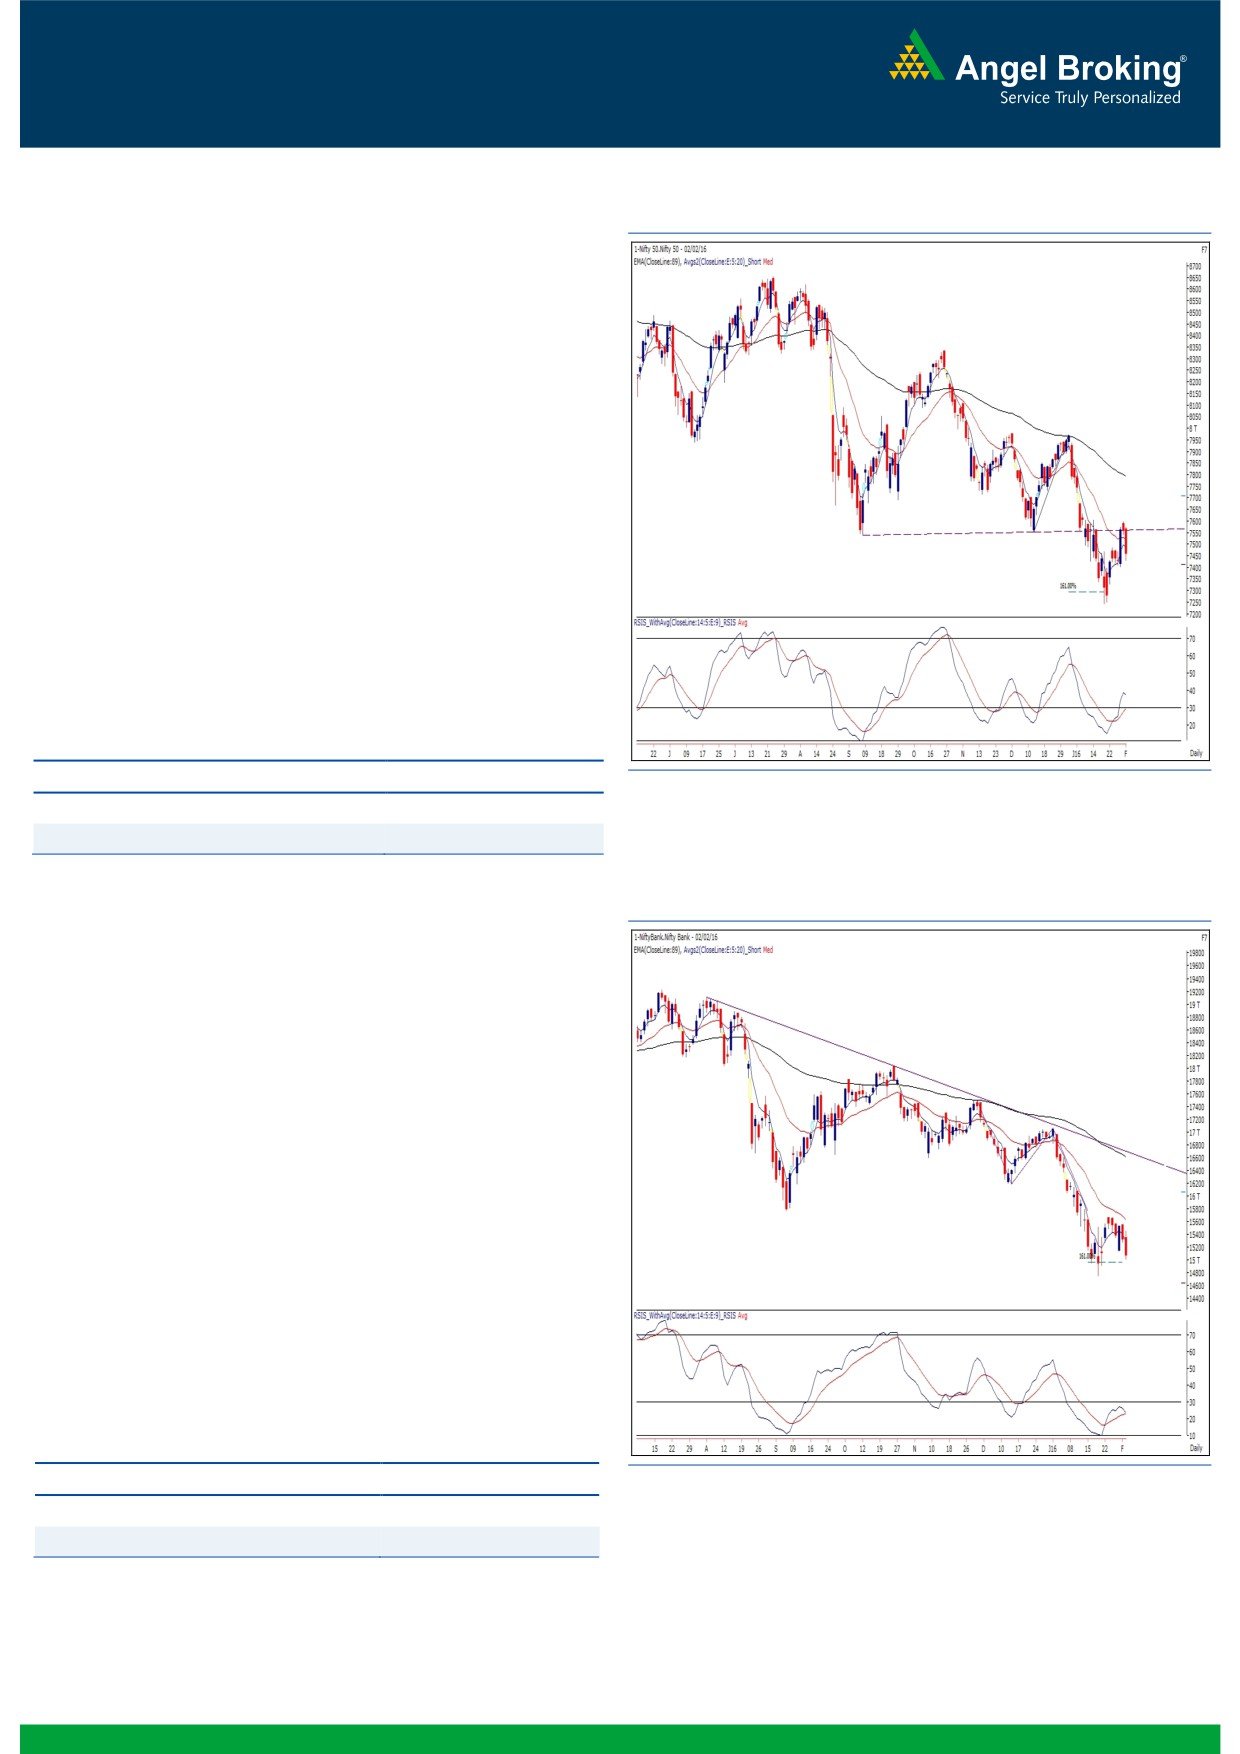
Exhibit 1: Nifty Daily Chart
Yesterday’s session opened on a flat note considering mixed
global cues. After a quiet start, the index corrected a bit post
the RBI monetary policy. However, immediately, we saw v-
shaped recovery in the following hour to post a new intraday
high of 7576.30. Post the midsession, the bulls struggled to
keep the momentum going and as a result, lost complete
control in the final couple of hours of the session. Due to
sharp selloff, the Nifty eventually ended the session with 1.33
percent cut over its previous day close.
Honestly speaking, we were not expecting this intraday
correction to extend beyond the
7500. Despite this
development, we do not want to immediately switch our
stance. The Nifty has now retraced its recent up move by 50%
and thus, we expect 7400 to 7350 to act a strong support for
Nifty. On the flipside, 7490 - 7576 are seen as intraday
resistance levels for the index.
Key Levels
Support 1 - 7400
Resistance 1 - 7490
Support 2 - 7350
Resistance 2 -
7576
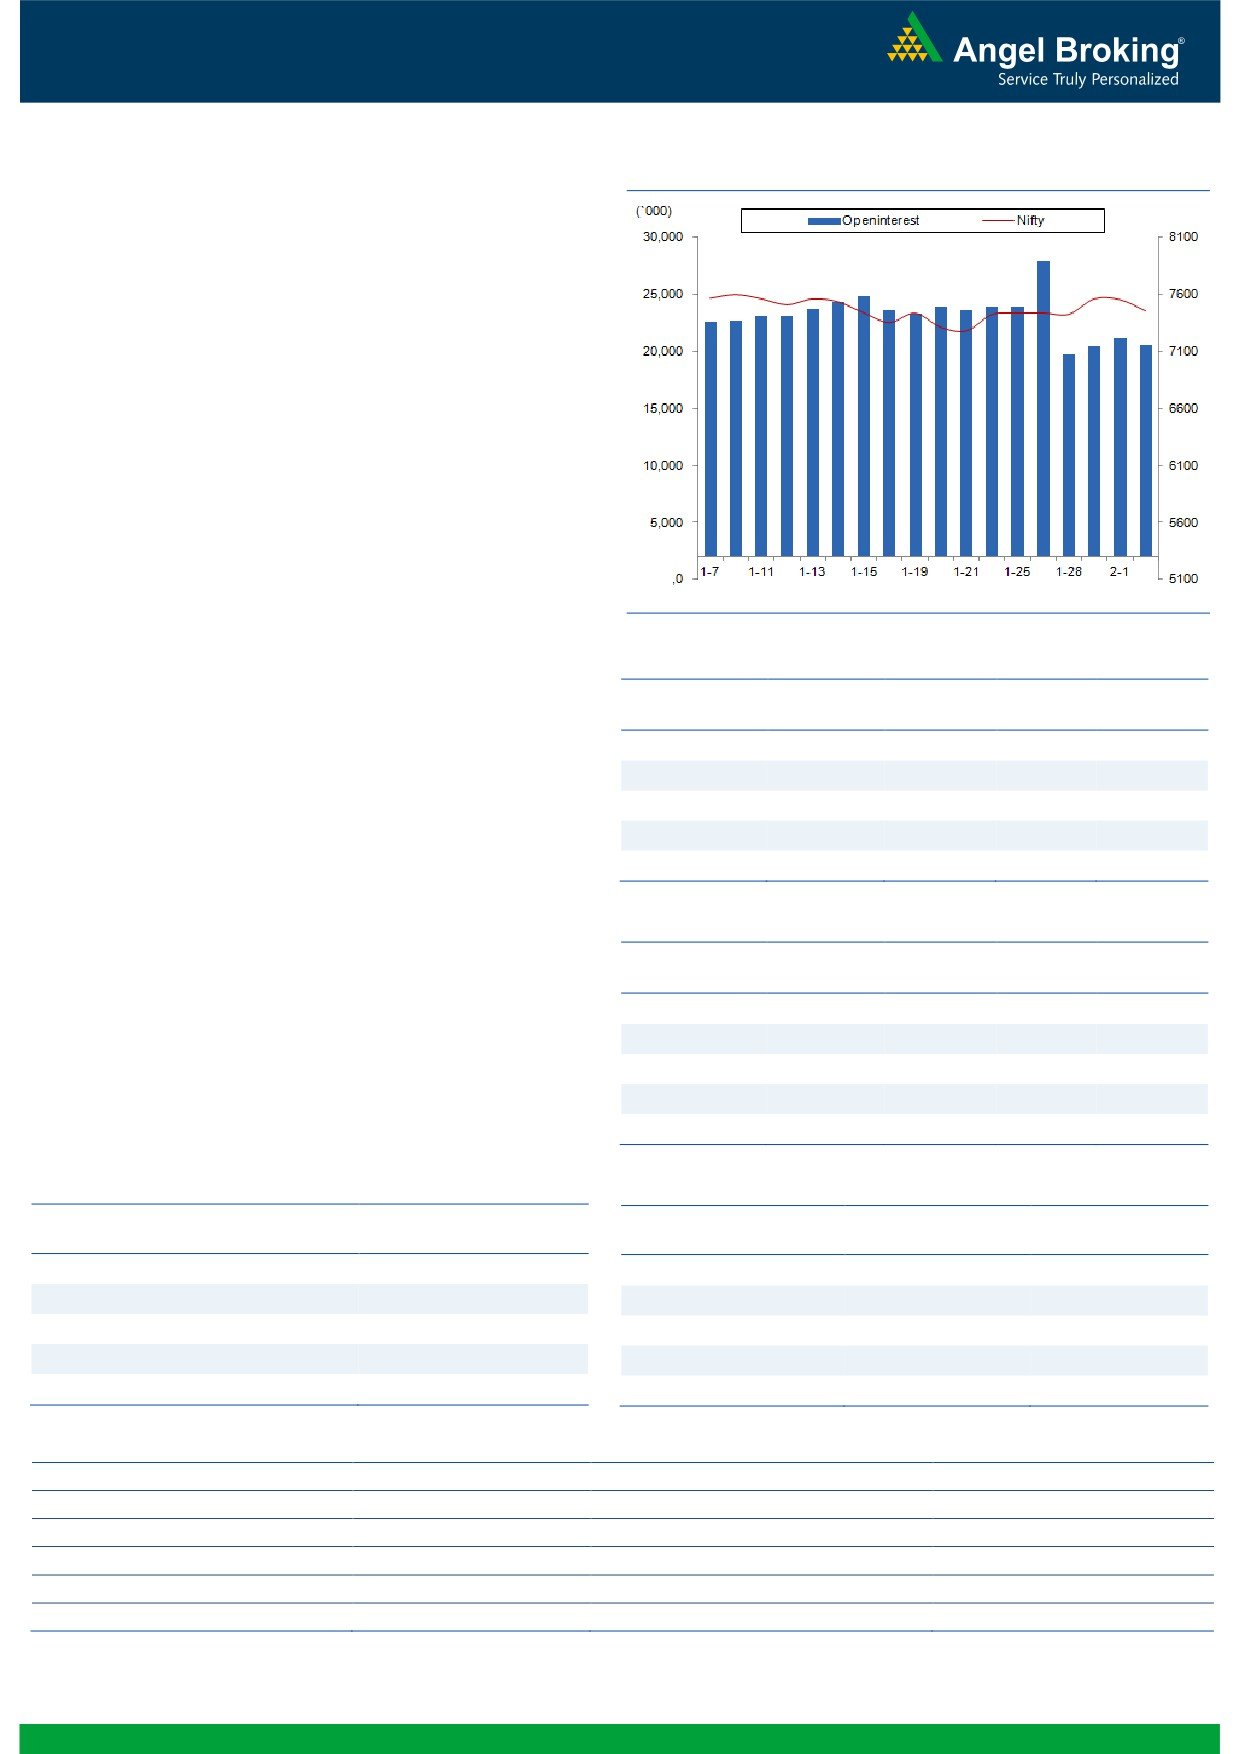
Exhibit 2: Bank Nifty Daily Chart
Bank Nifty Outlook - (15068)
The Nifty Bank index opened on a flat note and traded in a
narrow range till the outcome of the RBI monetary policy meet.
Post the outcome where RBI kept the key rates unchanged, the
index traded with high volatility till noon. The index then,
started forming lower tops lower bottom on intraday charts
and corrected sharply till the end of the session to close with
losses of 1.61% over previous day.
Post yesterday's correction, it is crucial to watch the follow up
move in next couple of sessions which could set the near term
direction for the Nifty Bank index. Traders are hence advised
to wait for some clarity regarding the near term trend and
trade with strict risk management strategy. The near term
support for the index is placed around 14900 and 14750
levels; whereas, resistances are seen around 15450 and
15550 levels.
Key Levels
Support 1 - 14900
Resistance 1 - 15450
Support 2 - 14750
Resistance 2 - 15550
1
Technical & Derivatives Report
February 03, 2016
Comments
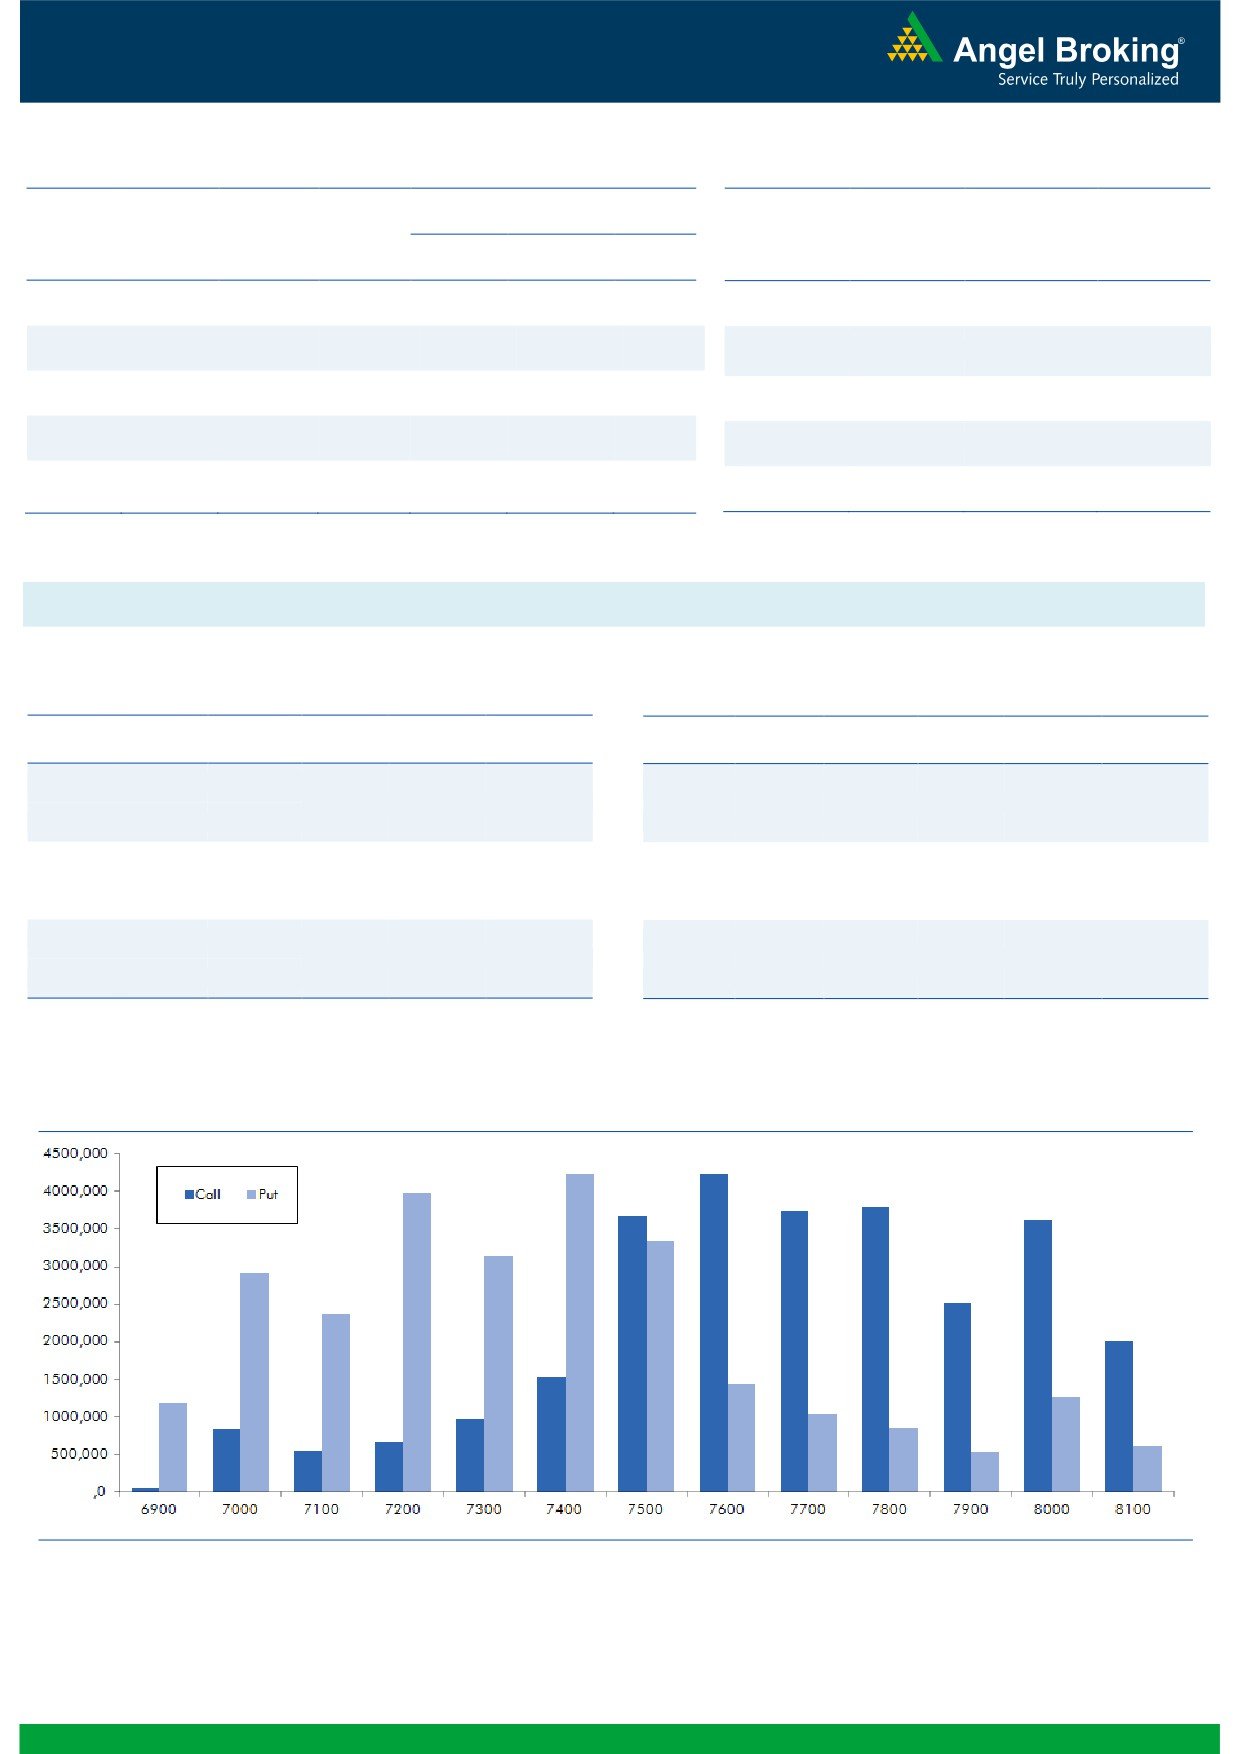
Nifty Vs OI
The Nifty futures open interest has decreased by 3.00%
BankNifty futures open interest has increased by 9.08%
as market closed at 7455.55 levels.
The Nifty February future closed at a premium of 19.40
points against a premium of 9.40 points. The March
series closed at a premium of 34.80 points.
The Implied Volatility of at the money options has
increased from 15.70% to 16.36%.
The total OI of the market is Rs. 1,91,521/- cr. and the
stock futures OI is Rs. 59,224/- cr.
Few of the liquid counters where we have seen high cost
of carry are UNITECH, JPASSOCIAT, ADANIPORTS,
TECHM and AUROPHARMA.
OI Gainers
OI
PRICE
Views
SCRIP
OI
PRICE
CHG. (%)
CHG. (%)
FIIs were net seller in cash segment to the tune of Rs. 114
UBL
1067500
34.53
811.45
3.88
crores. While in Index Futures, they sold marginally with
ACC
3282000
23.32
1259.45
-0.71
good amount of fall in OI, indicating blend of long
SAIL
37287000
16.93
38.25
-9.04
unwinding and short covering in last trading session.
NTPC
16240000
13.76
132.90
-4.70
In Index Options front, FIIs were net sellers of Rs. 718
TORNTPHARM
391600
13.05
1351.70
-3.58
crores with decent rise in OI. We hardly saw any
meaningful build-up in both call and put options. 7700
OI Losers
& 7900 calls were most active, while in put some
OI
PRICE
unwinding was visible in 7400 strike. Maximum build-up
SCRIP
OI
PRICE
CHG. (%)
CHG. (%)
in current series is now visible in 7600 call and 7400 put
CANBK
12670000
-8.39
183.65
1.24
options. Yesterday, Nifty plunged nearly 100 pts but we
ENGINERSIN
5335000
-8.04
189.35
-1.38
didn’t see any meaningful selling by FIIs. We would
AJANTPHARM
462000
-7.53
1301.60
-0.31
suggest staying light in this market.
GODREJCP
249200
-6.32
1236.75
-2.62
YESBANK
13331500
-5.68
765.50
-0.73
Historical Volatility
Put-Call Ratio
SCRIP
HV
SCRIP
PCR-OI
PCR-VOL
SAIL
64.53
NIFTY
0.81
0.92
TECHM
32.76
BANKNIFTY
0.83
0.74
CIPLA
32.55
SBIN
0.58
0.50
TATASTEEL
60.41
LT
0.82
0.52
NTPC
41.63
ICICIBANK
0.49
0.56
Strategy Date
Symbol
Strategy
Status
February 01, 2016
BHEL
Bull Call Spread
Active
2
Technical & Derivatives Report
February 03, 2016
FII Statistics for 02-February 2016
Turnover on 02-February 2016
Open Interest
No. of
Turnover
Change
Detail
Buy
Sell
Net
Instrument
Value
Change
Contracts
( in Cr. )
(%)
Contracts
(in Cr.)
(%)
INDEX
INDEX
2076.42
2127.41
(50.99)
209140
11146.48
(5.61)
379833
19699.40
61.02
FUTURES
FUTURES
INDEX
INDEX
37450.29
38168.36
(718.07)
1000380
55245.32
2.36
3213615
177374.33
59.64
OPTIONS
OPTIONS
STOCK
4229.92
4623.14
(393.22)
1085428
48350.75
1.68
STOCK
FUTURES
620552
28124.51
11.36
FUTURES
STOCK
STOCK
2771.80
2769.93
1.87
40610
1793.31
17.70
OPTIONS
330819
15331.30
14.96
OPTIONS
TOTAL
46528.44
47688.85
(1160.41)
2335558
116535.85
1.51
TOTAL
4544819
240529.54
48.53
Nifty Spot = 7455.55
Lot Size = 75
Bull-Call Spreads
Bear-Put Spreads
Action
Strike
Price
Risk
Reward
BEP
Action
Strike
Price
Risk
Reward
BEP
Buy
7500
104.80
Buy
7400
92.30
41.60
58.40
7541.60
30.55
69.45
7369.45
Sell
7600
63.20
Sell
7300
61.75
Buy
7500
104.80
Buy
7400
92.30
70.40
129.60
7570.40
50.65
149.35
7349.35
Sell
7700
34.40
Sell
7200
41.65
Buy
7600
63.20
Buy
7300
61.75
28.80
71.20
7628.80
20.10
79.90
7279.90
Sell
7700
34.40
Sell
7200
41.65
Note: Above mentioned Bullish or Bearish Spreads in Nifty (Feb. Series) are given as an information and not as a recommendation.
Nifty Put-Call Analysis
3
Technical & Derivatives Report
February 03, 2016
Daily Pivot Levels for Nifty 50 Stocks
Scrips
S2
S1
PIVOT
R1
R2
ACC
1,236
1,249
1,266
1,279
1,296
ADANIPORTS
204
209
216
221
229
AMBUJACEM
192
194
198
201
204
ASIANPAINT
868
875
885
892
902
AXISBANK
379
385
395
401
411
BAJAJ-AUTO
2,265
2,315
2,350
2,399
2,434
BANKBARODA
115
118
123
126
131
BHARTIARTL
292
297
301
306
309
BHEL
130
133
137
139
143
BOSCHLTD
16,741
16,877
17,094
17,229
17,446
BPCL
828
839
857
868
885
CAIRN
114
116
120
122
126
CIPLA
537
555
581
599
625
COALINDIA
307
313
323
329
339
DRREDDY
2,999
3,024
3,066
3,090
3,132
GAIL
355
358
363
367
372
GRASIM
3,378
3,409
3,444
3,474
3,510
HCLTECH
857
865
875
883
893
HDFC
1,153
1,167
1,180
1,193
1,206
HDFCBANK
1,041
1,048
1,056
1,063
1,071
HEROMOTOCO
2,484
2,501
2,526
2,543
2,568
HINDALCO
66
67
70
71
73
HINDUNILVR
789
795
802
808
815
ICICIBANK
203
207
213
217
223
IDEA
101
103
105
106
108
INDUSINDBK
886
897
915
926
943
INFY
1,151
1,163
1,177
1,189
1,203
ITC
319
322
324
326
328
KOTAKBANK
660
669
680
688
699
LT
1,092
1,107
1,126
1,141
1,160
LUPIN
1,679
1,692
1,713
1,727
1,748
M&M
1,175
1,191
1,216
1,232
1,257
MARUTI
3,770
3,823
3,904
3,956
4,037
NTPC
128
131
136
139
144
ONGC
210
213
219
222
228
PNB
87
88
91
92
94
POWERGRID
142
144
147
149
153
RELIANCE
966
984
1,008
1,026
1,050
SBIN
163
166
172
175
181
VEDL
60
63
67
69
73
SUNPHARMA
798
816
850
869
902
TATAMOTORS
317
323
334
340
351
TATAPOWER
57
58
59
60
62
TATASTEEL
217
224
238
245
258
TCS
2,350
2,374
2,404
2,428
2,457
TECHM
455
465
482
492
509
ULTRACEMCO
2,737
2,770
2,813
2,846
2,889
WIPRO
560
564
568
571
575
YESBANK
745
755
770
779
795
ZEEL
390
396
406
412
423
4
Technical & Derivatives Report
February 03, 2016
Research Team Tel: 022 - 39357800
For Technical Queries
For Derivatives Queries
DISCLAIMER
Angel Broking Private Limited (hereinafter referred to as “Angel”) is a registered Member of National Stock Exchange of India Limited,
Bombay Stock Exchange Limited and MCX Stock Exchange Limited. It is also registered as a Depository Participant with CDSL and
Portfolio Manager with SEBI. It also has registration with AMFI as a Mutual Fund Distributor. Angel Broking Private Limited is a
registered entity with SEBI for Research Analyst in terms of SEBI (Research Analyst) Regulations, 2014 vide registration number
INH000000164. Angel or its associates has not been debarred/ suspended by SEBI or any other regulatory authority for accessing
/dealing in securities Market. Angel or its associates including its relatives/analyst do not hold any financial interest/beneficial
ownership of more than 1% in the company covered by Analyst. Angel or its associates/analyst has not received any compensation /
managed or co-managed public offering of securities of the company covered by Analyst during the past twelve months. Angel/analyst
has not served as an officer, director or employee of company covered by Analyst and has not been engaged in market making activity
of the company covered by Analyst.
This document is solely for the personal information of the recipient, and must not be singularly used as the basis of any investment
decision. Nothing in this document should be construed as investment or financial advice. Each recipient of this document should
make such investigations as they deem necessary to arrive at an independent evaluation of an investment in the securities of the
companies referred to in this document (including the merits and risks involved), and should consult their own advisors to determine
the merits and risks of such an investment.
Reports based on technical and derivative analysis center on studying charts of a stock's price movement, outstanding positions and
trading volume, as opposed to focusing on a company's fundamentals and, as such, may not match with a report on a company's
fundamentals.
The information in this document has been printed on the basis of publicly available information, internal data and other reliable
sources believed to be true, but we do not represent that it is accurate or complete and it should not be relied on as such, as this
document is for general guidance only. Angel Broking Pvt. Limited or any of its affiliates/ group companies shall not be in any way
responsible for any loss or damage that may arise to any person from any inadvertent error in the information contained in this report.
Angel Broking Pvt. Limited has not independently verified all the information contained within this document. Accordingly, we cannot
testify, nor make any representation or warranty, express or implied, to the accuracy, contents or data contained within this document.
While Angel Broking Pvt. Limited endeavors to update on a reasonable basis the information discussed in this material, there may be
regulatory, compliance, or other reasons that prevent us from doing so.
This document is being supplied to you solely for your information, and its contents, information or data may not be reproduced,
redistributed or passed on, directly or indirectly.
Neither Angel Broking Pvt. Limited, nor its directors, employees or affiliates shall be liable for any loss or damage that may arise from
or in connection with the use of this information.
Note: Please refer to the important ‘Stock Holding Disclosure' report on the Angel website (Research Section). Also, please refer to the
latest update on respective stocks for the disclosure status in respect of those stocks. Angel Broking Pvt. Limited and its affiliates may
have investment positions in the stocks recommended in this report.
5