Technical & Derivatives Report
December 02, 2016
Sensex (26560) / Nifty (8193)
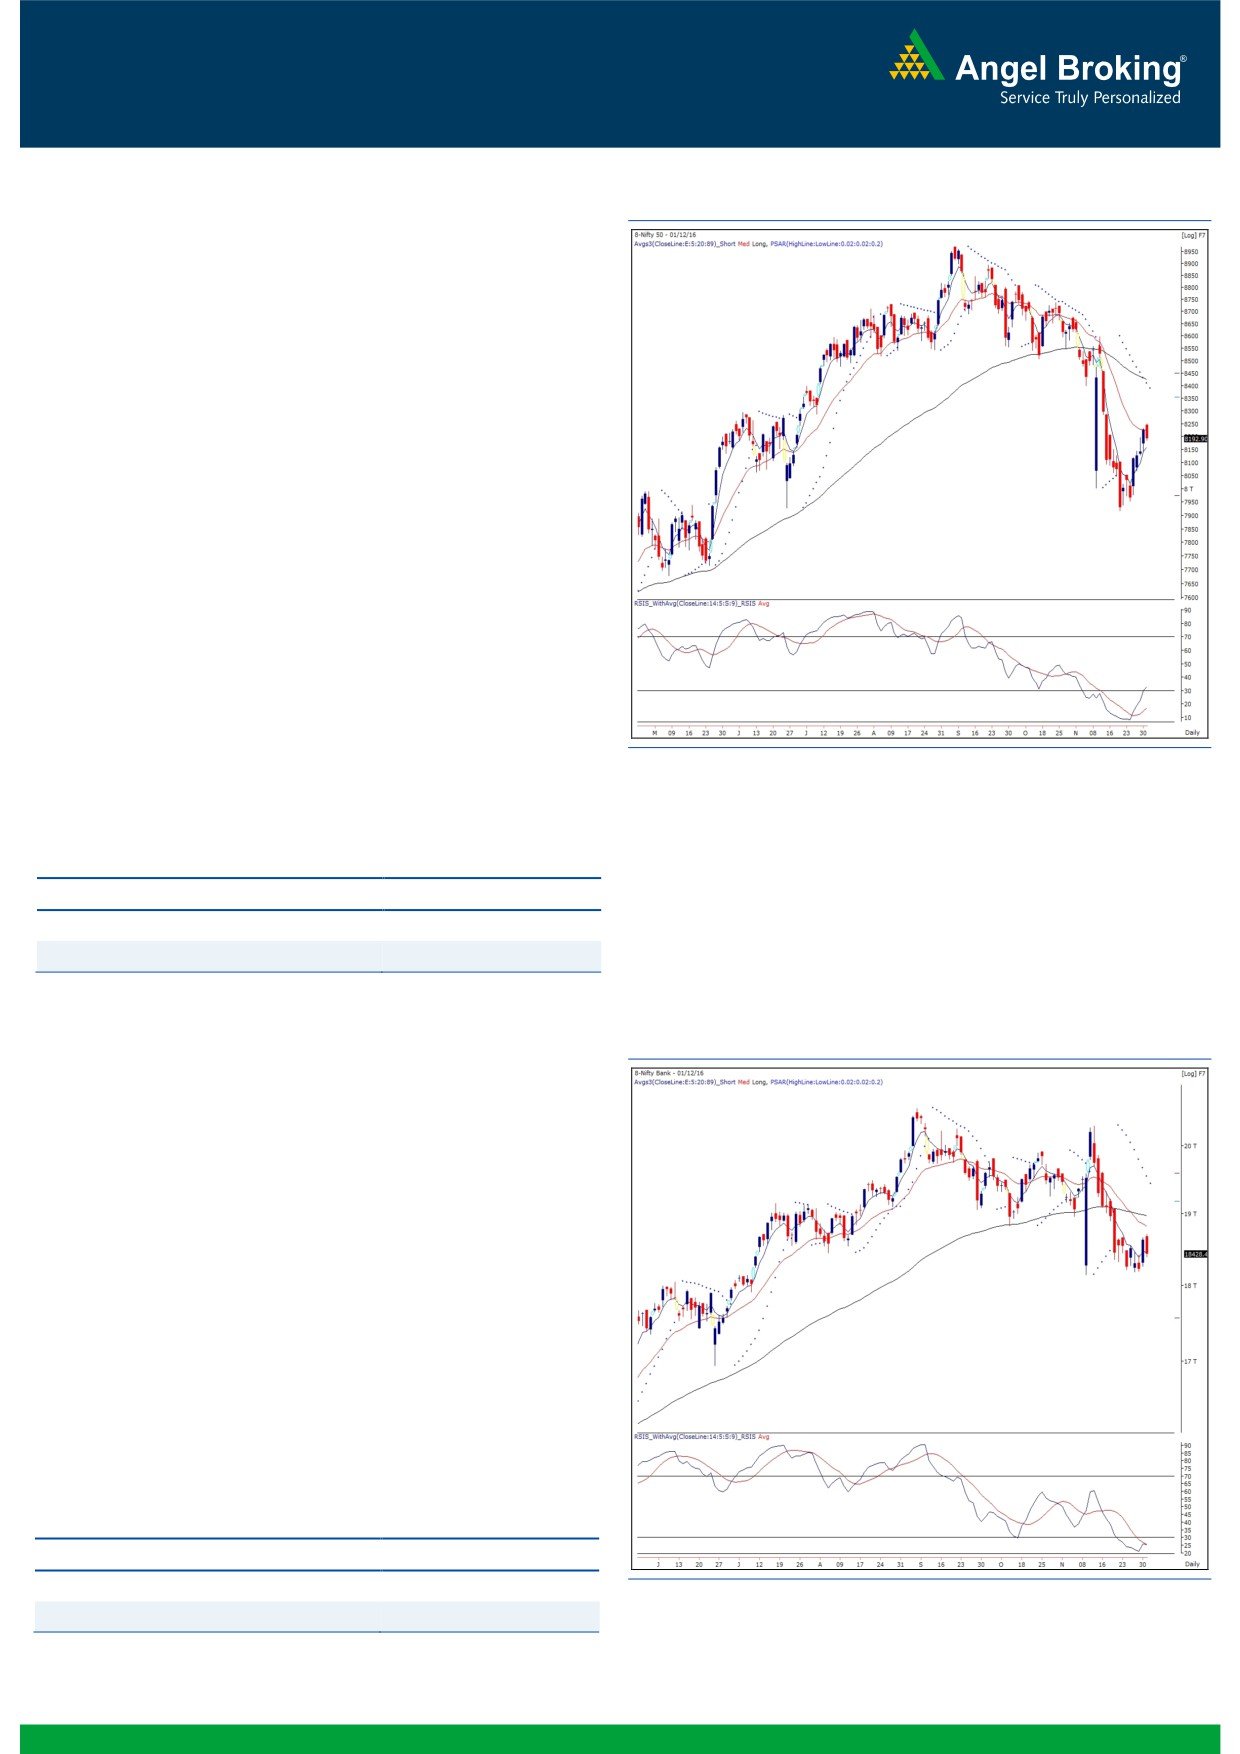
Exhibit 1: Nifty Daily Chart
Yesterday, our markets opened higher on the back of positive
cues from the Asian bourses. However, we saw strong selling
pressure at higher levels which dragged the index lower to close
tad below the 8200 mark with a cut of 0.38% over its previous
close.
Yesterday’s correction, though it has come due to a strong
resistance of daily ‘20 EMA’; but it was certainly not expected for
us. We were expecting a follow-up rally in the banking
conglomerates, but the entire space disappointed us after a very
good start. This was probably because of the weekly expiry factor
in ‘Bank Nifty’. But now, despite yesterday’s corrective move, we
are still convinced on the further move towards 8250 - 8320.
Technically speaking, the index is trading in the vicinity of ‘200
SMA’ as well as ’89 EMA’ on the hourly chart. Hence, 8170 -
8130 would be seen as a strong support zone. In addition, the
‘RSI-Smoothened’ on daily chart has turned northwards from the
oversold territory with a positive crossover; indicating strength in
prices. Hence, traders are still advised to stay away from going
short and focus more on individual stocks which are likely to give
a decent bounce in forthcoming sessions.
Key Levels
Support 1 - 8170
Resistance 1 - 8250
Support 2 - 8130
Resistance 2 - 8320
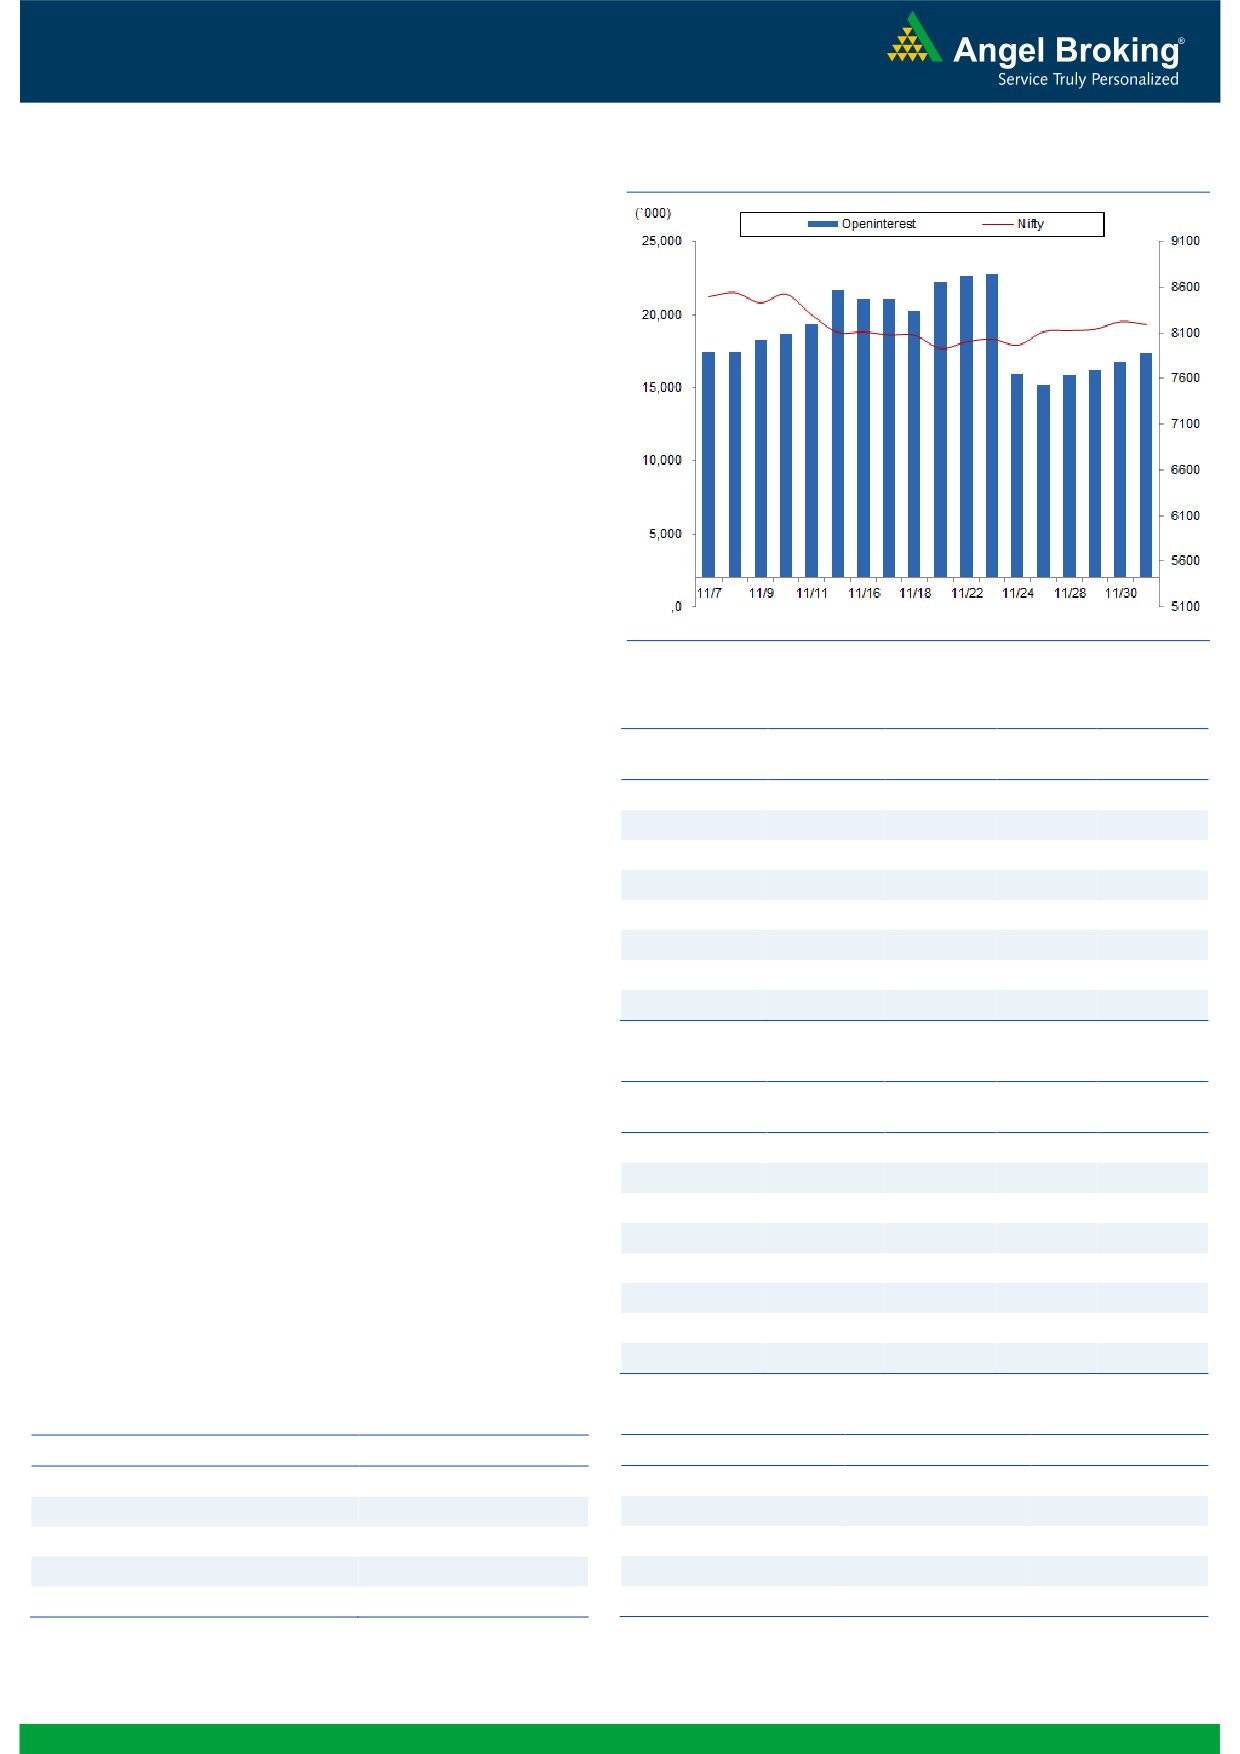
Nifty Bank Outlook - (18428)
Exhibit 2: Nifty Bank Daily Chart
As mentioned above, the Nifty Bank index unexpectedly corrected
in yesterday's session and ended the day with loss of
1.07
percent.
Although the bears seemed to be active in the banking stocks
yesterday, we advise traders to refrain from creating short
positions in the index. If we analyze the trading activity in last few
sessions, the index, post a consolidation has managed to close
firmly above the resistance of '20 DEMA' after 11 trading sessions.
This, coupled with the positive crossover of momentum readings
on lower time frame charts indicates limited downside which
should lead to a pullback move in near term. Traders are also
advised to trade with proper risk management. The intraday
supports for the index are placed around 18300 and 18160
whereas resistances are seen around 18650 and 18845.
Key Levels
Support 1 - 18300
Resistance 1 - 18650
Support 2 - 18160
Resistance 2 - 18845
1
Technical & Derivatives Report
December 02, 2016
Comments
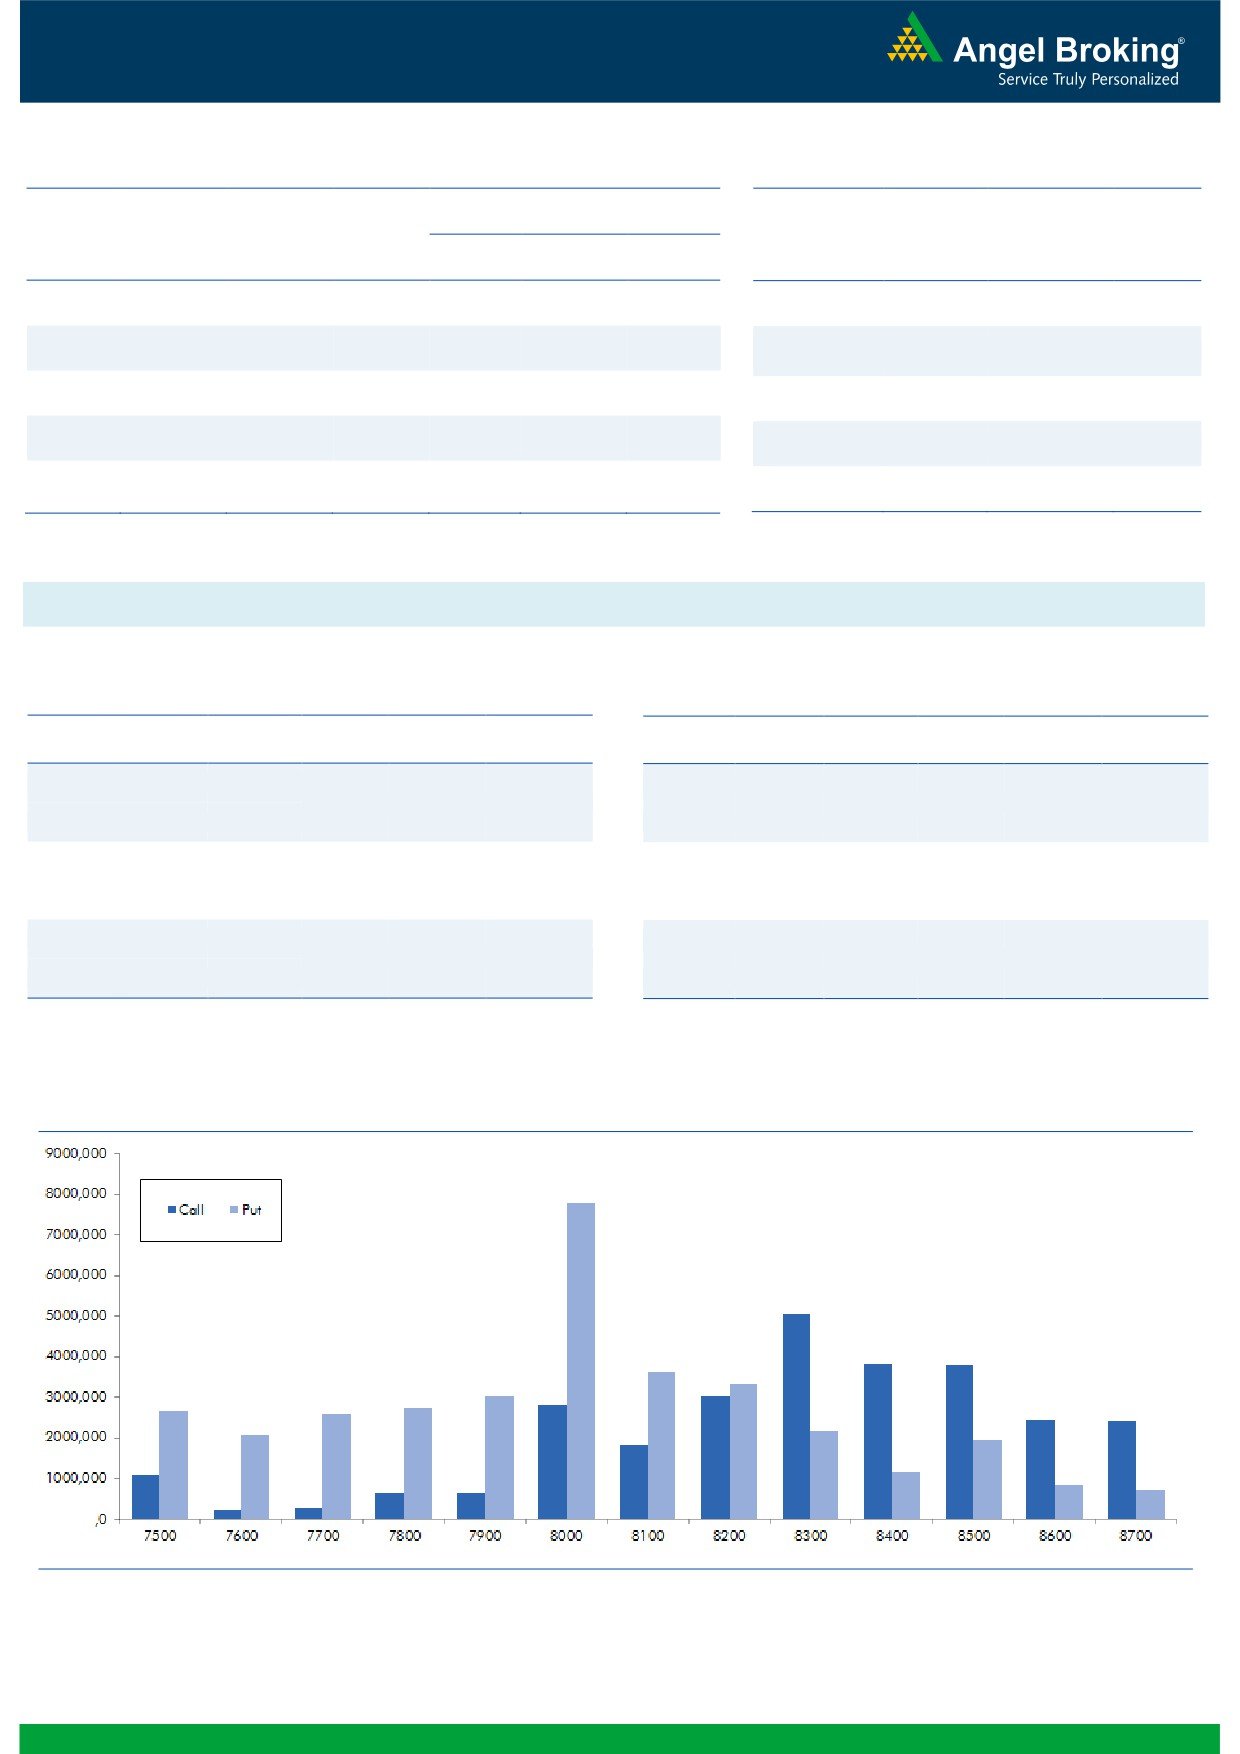
Nifty Vs OI
The Nifty futures open interest has increased by 6.99%
BankNifty futures open interest has decreased by 7.69%
as market closed at 8192.90 levels.
The Nifty December future closed with a premium of
19.10 against the premium of 35.85 points in last
trading session. The January series closed at a premium
of 54.40 points.
The Implied Volatility of at the money options has
increased from 13.91% to 14.41%. At the same time, the
PCR-OI of Nifty has increased from 1.05 to 1.06 levels.
The total OI of the market is Rs. 2,46,710/- cr. and the
stock futures OI is Rs. 66,621/- cr.
Few of the liquid counters where we have seen high cost
of carry are RPOWER, TATAELXSI, DCBBANK, ADANIENT
and IBREALEST.
OI Gainers
Views
OI
PRICE
SCRIP
OI
PRICE
Yesterday also, FIIs remained net seller in cash market
CHG. (%)
CHG. (%)
segment. They sold equities worth Rs. 403 crores. While,
IDFCBANK
51424000
77.23
67.85
-0.88
in index futures, they were net buyers worth Rs.
708
ULTRACEMCO
2530200
57.61
3560.25
-0.78
crores with rise in open interest, indicating fresh long
BPCL
14985600
30.79
628.70
-2.18
www.angelbroking.com
formation in previous trading session.
TORNTPHARM
279600
26.63
1394.00
0.60
In Index options segment, FIIs were net buyers of Rs. 724
HINDPETRO
23169300
23.98
448.50
-4.25
crores with some rise in open interest. In call options,
APOLLOHOSP
556800
21.78
1211.55
0.86
8300 strike was quite active and added decent amount
OIL
1358300
20.15
430.20
1.97
of positions; followed by some unwinding in 8200 strike.
IGL
1481700
17.95
839.90
0.75
While in put options, OI addition was seen in 8000 -
8200 strikes. Highest OI in current series is visible in
OI Losers
8300 call and 8000 put option.
OI
PRICE
SCRIP
OI
PRICE
FIIs continued their buying streak in both Index Futures
CHG. (%)
CHG. (%)
and Stock Futures segment for third consecutive session.
MARUTI
2496300
-18.20
5255.85
-0.42
However, they continued to sell in cash segment.
PETRONET
3889500
-9.24
382.05
-1.77
Considering above data, we believe that the Nifty may
GODREJCP
434800
-9.19
1497.75
2.49
continue to show strength towards its near term
ICICIBANK
57247500
-9.13
260.55
-2.09
resistance of 8300 - 8350 in upcoming sessions. Thus,
DHFL
14499000
-9.07
249.10
-3.07
traders are advised to trade with a positive bias with
GODREJIND
1267500
-7.45
382.40
-1.89
proper exit strategy.
HDIL
23592000
-7.41
61.40
-1.37
AMARAJABAT
553200
-6.11
947.35
0.37
Historical Volatility
Put-Call Ratio
SCRIP
HV
SCRIP
PCR-OI
PCR-VOL
IDEA
53.51
NIFTY
1.06
0.95
HINDPETRO
45.70
BANKNIFTY
0.76
0.85
POWERGRID
36.82
SBIN
0.58
0.49
RCOM
61.23
RELIANCE
0.54
0.42
BPCL
26.59
MARUTI
1.09
0.80
2
Technical & Derivatives Report
December 02, 2016
FII Statistics for December 01, 2016
Turnover on December 01, 2016
Open Interest
No. of
Turnover
Change
Detail
Buy
Sell
Net
Instrument
Value
Change
Contracts
( in Cr. )
(%)
Contracts
(in Cr.)
(%)
INDEX
INDEX
1619.35
911.79
707.57
180599
11432.86
5.51
197248
13277.23
-22.12
FUTURES
FUTURES
INDEX
INDEX
36427.53
35703.07
724.46
949788
59284.45
1.61
5896963
424685.26
43.15
OPTIONS
OPTIONS
STOCK
6470.45
6166.85
303.59
848194
51848.95
0.43
STOCK
FUTURES
476718
31349.55
-9.10
FUTURES
STOCK
STOCK
2942.76
2889.26
53.50
55199
3569.18
10.96
OPTIONS
252533
16905.41
8.56
OPTIONS
TOTAL
47460.09
45670.97
1789.12
2033780
126135.45
1.68
TOTAL
6823462
486217.45
33.66
Nifty Spot = 8192.90
Lot Size = 75
Bull-Call Spreads
Bear-Put Spreads
Action
Strike
Price
Risk
Reward
BEP
Action
Strike
Price
Risk
Reward
BEP
Buy
8300
85.10
Buy
8100
96.00
36.75
63.25
8336.75
25.00
75.00
8075.00
Sell
8400
48.35
Sell
8000
71.00
Buy
8300
85.10
Buy
8100
96.00
60.30
139.70
8360.30
44.55
155.45
8055.45
Sell
8500
24.80
Sell
7900
51.45
Buy
8400
48.35
Buy
8000
71.00
23.55
76.45
8423.55
19.55
80.45
7980.45
Sell
8500
24.80
Sell
7900
51.45
Note: Above mentioned Bullish or Bearish Spreads in Nifty (December Series) are given as an information and not as a recommendation.
Nifty Put-Call Analysis
3
Technical & Derivatives Report
December 02, 2016
Daily Pivot Levels for Nifty Constituents
Scrips
S2
S1
PIVOT
R1
R2
ACC
1 312
1 325
1 340
1 353
1 368
ADANIPORTS
267
271
276
280
284
AMBUJACEM
202
204
209
211
215
ASIANPAINT
916
927
948
959
980
AUROPHARMA
728
735
746
754
765
AXISBANK
458
462
468
472
478
BAJAJ-AUTO
2 643
2 669
2 693
2 719
2 744
BANKBARODA
158
160
163
165
168
BHEL
126
128
129
131
132
BPCL
608
618
629
640
651
BHARTIARTL
308
313
319
324
330
INFRATEL
362
375
385
397
407
BOSCH
20 001
20 192
20 371
20 562
20 741
CIPLA
558
563
571
577
585
COALINDIA
302
304
307
309
312
DRREDDY
3 176
3 207
3 227
3 259
3 279
EICHERMOT
21 267
21 734
22 089
22 557
22 912
GAIL
418
429
437
448
456
GRASIM
852
862
873
883
893
HCLTECH
786
795
801
809
815
HDFCBANK
1 184
1 191
1 199
1 206
1 214
HDFC
1 245
1 258
1 272
1 284
1 298
HEROMOTOCO
3 102
3 146
3 189
3 233
3 276
HINDALCO
165
168
173
176
181
HINDUNILVR
833
841
848
856
863
ICICIBANK
251
255
262
266
272
IDEA
69
71
74
76
79
INDUSINDBK
1 063
1 072
1 080
1 089
1 098
INFY
959
967
975
984
992
ITC
229
231
233
235
237
KOTAKBANK
732
739
748
754
763
LT
1 358
1 373
1 388
1 403
1 418
LUPIN
1 478
1 495
1 517
1 534
1 556
M&M
1 133
1 147
1 170
1 184
1 207
MARUTI
5 151
5 202
5 255
5 305
5 358
NTPC
159
160
163
164
166
ONGC
286
289
294
297
302
POWERGRID
178
181
187
190
196
RELIANCE
983
990
1 003
1 010
1 023
SBIN
251
253
257
260
263
SUNPHARMA
700
711
718
728
735
TCS
2 233
2 248
2 269
2 284
2 305
TATAMTRDVR
286
289
294
298
303
TATAMOTORS
440
444
451
455
462
TATAPOWER
71
72
73
74
76
TATASTEEL
401
405
412
416
423
TECHM
463
469
477
483
491
ULTRACEMCO
3 525
3 548
3 584
3 607
3 644
WIPRO
461
465
468
471
475
YESBANK
1 140
1 150
1 168
1 178
1 195
ZEEL
450
454
459
463
467
4
Technical & Derivatives Report
December 02, 2016
Research Team Tel: 022 - 39357800
For Technical Queries
For Derivatives Queries
DISCLAIMER
Angel Broking Private Limited (hereinafter referred to as “Angel”) is a registered Member of National Stock Exchange of India Limited,
Bombay Stock Exchange Limited and Metropolitan Stock Exchange Limited. It is also registered as a Depository Participant with CDSL
and Portfolio Manager with SEBI. It also has registration with AMFI as a Mutual Fund Distributor. Angel Broking Private Limited is a
registered entity with SEBI for Research Analyst in terms of SEBI (Research Analyst) Regulations, 2014 vide registration number
INH000000164. Angel or its associates has not been debarred/ suspended by SEBI or any other regulatory authority for accessing
/dealing in securities Market. Angel or its associates/analyst has not received any compensation / managed or co-managed public
offering of securities of the company covered by Analyst during the past twelve months.
This document is solely for the personal information of the recipient, and must not be singularly used as the basis of any investment
decision. Nothing in this document should be construed as investment or financial advice. Each recipient of this document should
make such investigations as they deem necessary to arrive at an independent evaluation of an investment in the securities of the
companies referred to in this document (including the merits and risks involved), and should consult their own advisors to determine
the merits and risks of such an investment.
Reports based on technical and derivative analysis center on studying charts of a stock's price movement, outstanding positions and
trading volume, as opposed to focusing on a company's fundamentals and, as such, may not match with a report on a company's
fundamentals. Investors are advised to refer the Fundamental and Technical Research Reports available on our website to evaluate the
contrary view, if any.
The information in this document has been printed on the basis of publicly available information, internal data and other reliable
sources believed to be true, but we do not represent that it is accurate or complete and it should not be relied on as such, as this
document is for general guidance only. Angel Broking Pvt. Limited or any of its affiliates/ group companies shall not be in any way
responsible for any loss or damage that may arise to any person from any inadvertent error in the information contained in this report.
Angel Broking Pvt. Limited has not independently verified all the information contained within this document. Accordingly, we cannot
testify, nor make any representation or warranty, express or implied, to the accuracy, contents or data contained within this document.
While Angel Broking Pvt. Limited endeavors to update on a reasonable basis the information discussed in this material, there may be
regulatory, compliance, or other reasons that prevent us from doing so.
This document is being supplied to you solely for your information, and its contents, information or data may not be reproduced,
redistributed or passed on, directly or indirectly.
Neither Angel Broking Pvt. Limited, nor its directors, employees or affiliates shall be liable for any loss or damage that may arise from
or in connection with the use of this information.
5