Technical & Derivatives Report
November 02, 2015
Sensex (26657) / Nifty (8066)
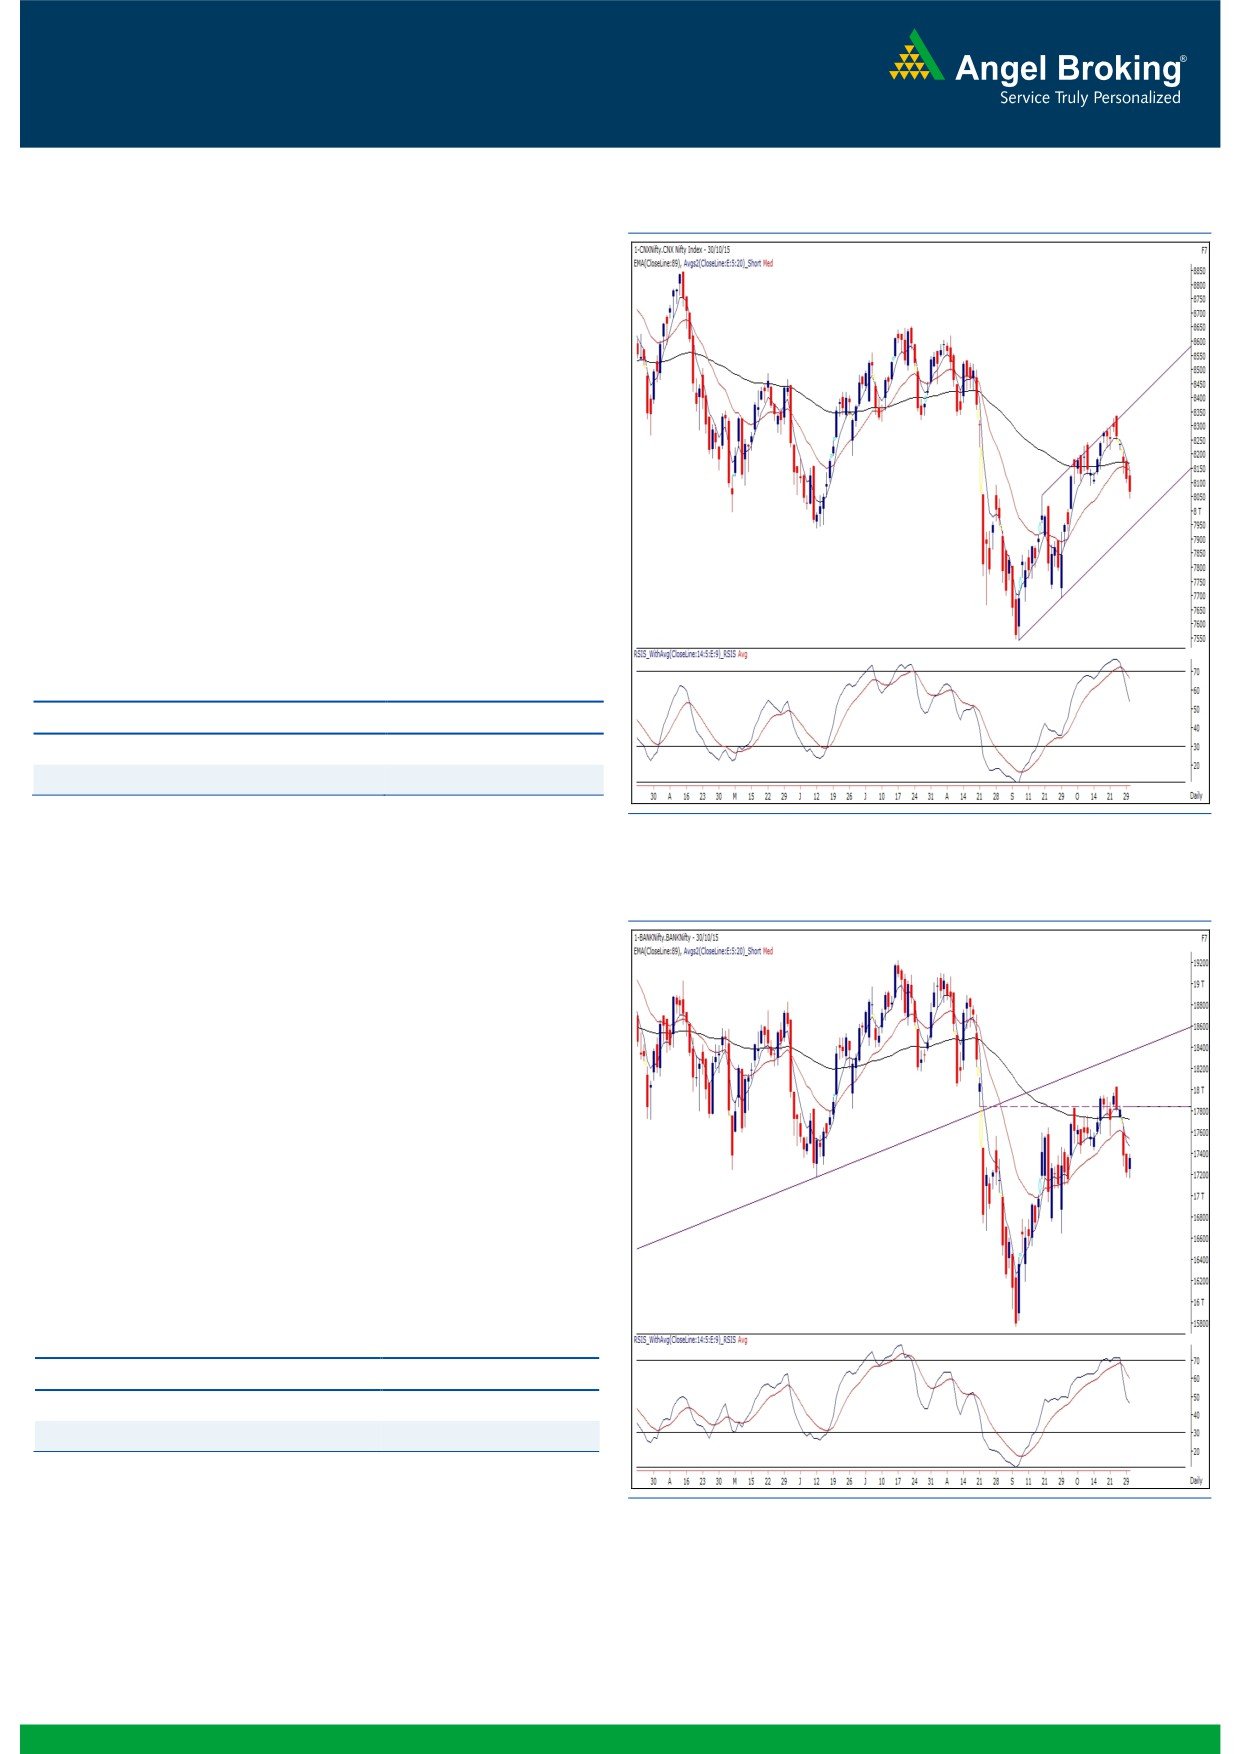
Exhibit 1: Nifty Daily Chart
On Friday, our markets opened on a flat note considering
subdued global cues. The index then continued its previous day’s
momentum and went on to conclude the week well below the
8100 mark.
The Nifty is now entering a strong support zone of 8055 (previous
resistance) - 8000 (the lower end of the ‘Channel’ pattern). Thus,
going forward, 8000 has become a major support in the near
term. A breach of this support may trigger pessimism in the
market, which may result in a continuation of this downward
move towards 7850 - 7800 levels. On the higher side, in case of
an intra-week bounce, 8180 - 8250 is likely to act as a strong
resistance for the Nifty. It’s advisable not to trade aggressively on
the long side and follow strict stop losses for existing positions.
Key Levels
Support 1 - 8055
Resistance 1 - 8145
Support 2 - 8000
Resistance 2 - 8180
Exhibit 2: Bank Nifty Daily Chart
Bank Nifty Outlook - (17355)
The Bank Nifty opened with negligible gains on Friday and
started moving higher from the initial trades. The better quarterly
earnings from two index heavyweights viz. ICICI Bank Ltd and
Kotak Mahindra Bank cheered sentiments and as a result, the
banking index outperformed the broader indices. Eventually, the
Bank Nifty managed to snap the falling streak of last four
sessions and ended the concluding session of the week with gains
of 0.83 percent. On Friday, the Bank Nifty faced a resistance
around Thursday’s high of
17400.20. Going forward, a
sustainable move above 17400 may pull the Bank Nifty towards
17565 and 17680 levels. On the flipside, the immediate support
for the index is placed at 17170 and 17070 levels.
Key Levels
Support 1 - 17170
Resistance 1 - 17400
Support 2 - 17070
Resistance 2 - 17565
1
Technical & Derivatives Report
November 02, 2015
Comments
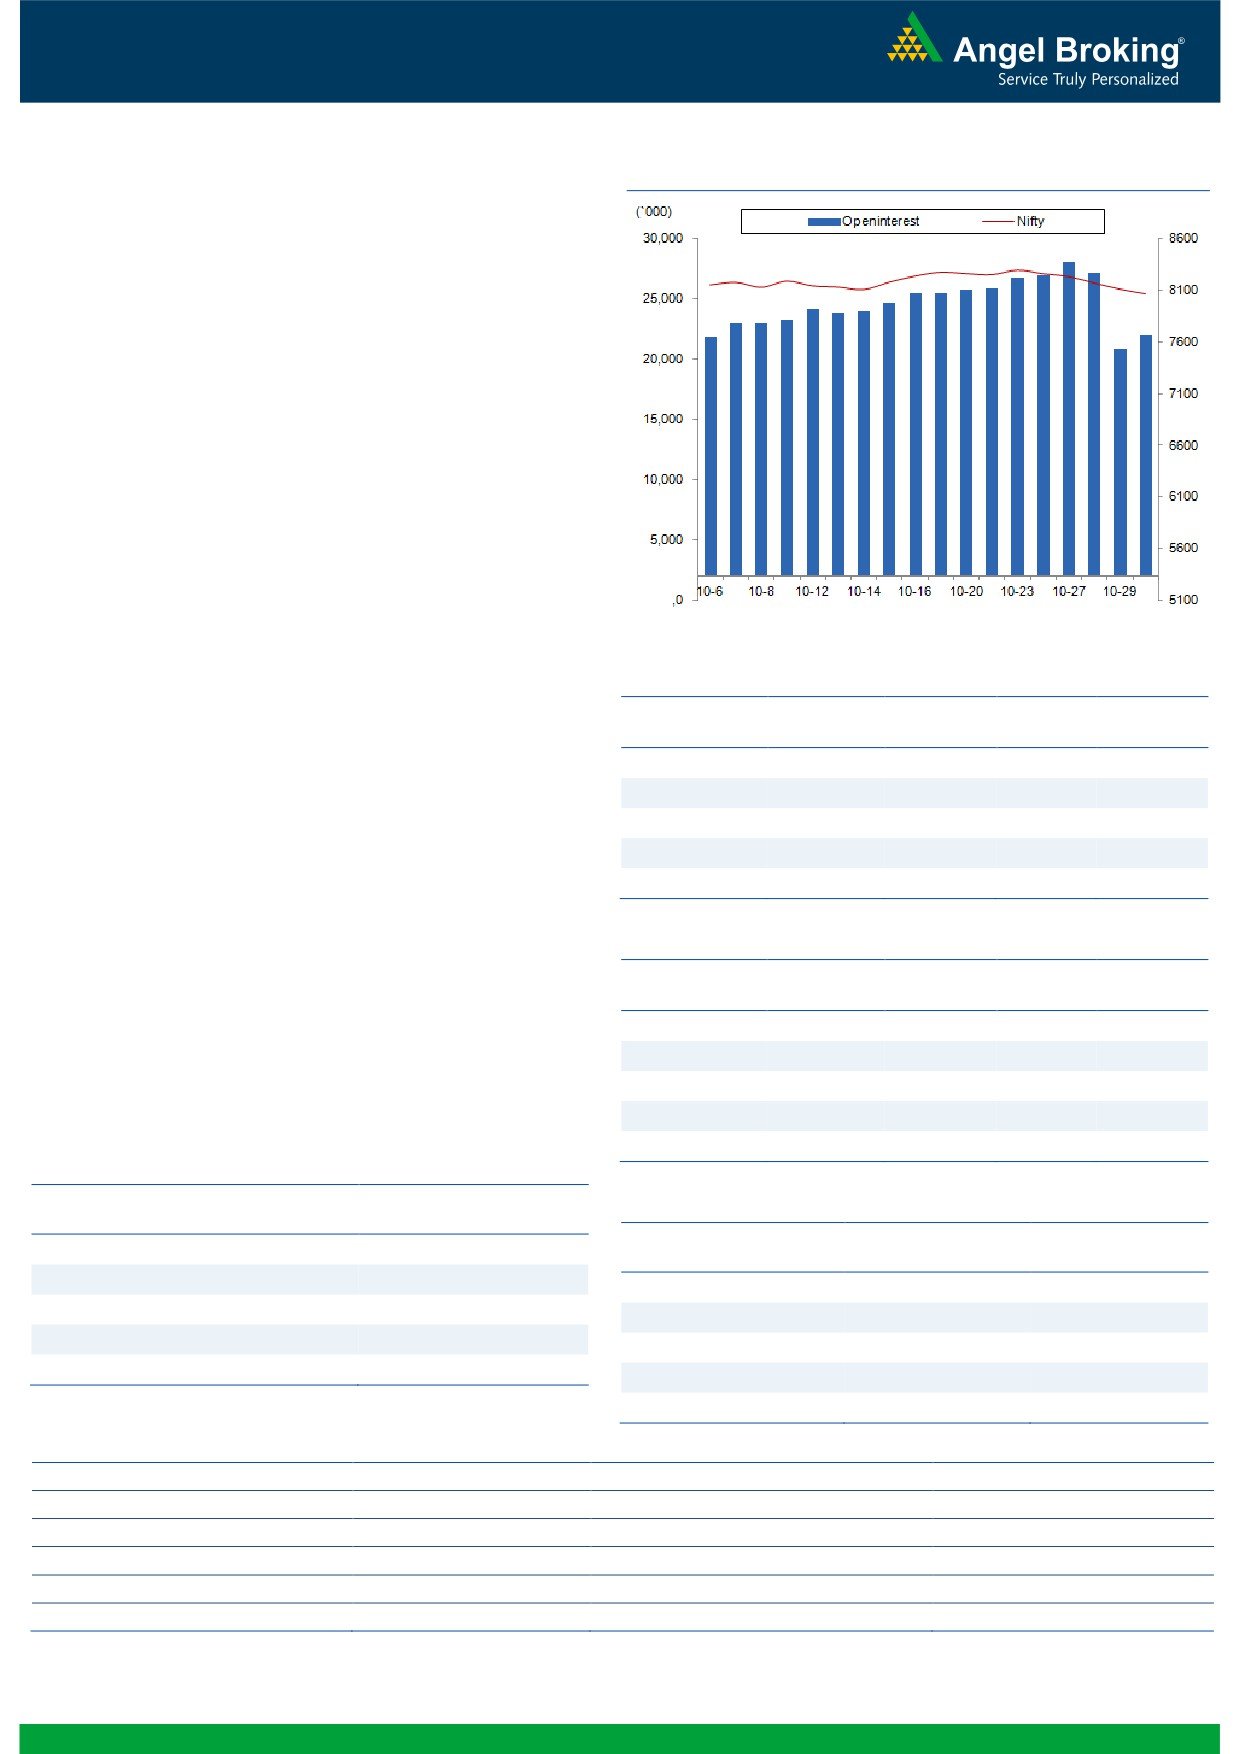
Nifty Vs OI
The Nifty futures open interest has increased by 5.37%
BankNifty futures open interest has decreased by 5.72%
as market closed at 8065.80 levels.
The Nifty November future closed at a premium of 28.90
points against a premium of
30.95 points. The
December series closed at a premium of 70.05 points.
The Implied Volatility of at the money options has
increased from 16.22% to 16.40%.
The total OI of the market is Rs. 1,79,446/- cr. and the
stock futures OI is Rs. 58,369/- cr.
Few of the liquid counters where we have seen high cost
of carry are NHPC, GMRINFRA, IFCI, NCC and
JPASSOCIAT.
Views
OI Gainers
OI
PRICE
FIIs were net sellers in cash market segment to the tune
SCRIP
OI
PRICE
CHG. (%)
CHG. (%)
of Rs. 731 crores. They bought Index Futures of worth Rs.
HEXAWARE
4406000
23.69
235.55
-5.31
334 crores with marginal change in OI, suggesting short
LT
10304100
22.01
1415.25
-4.27
covering in last trading session.
ZEEL
8416200
17.84
410.45
-1.84
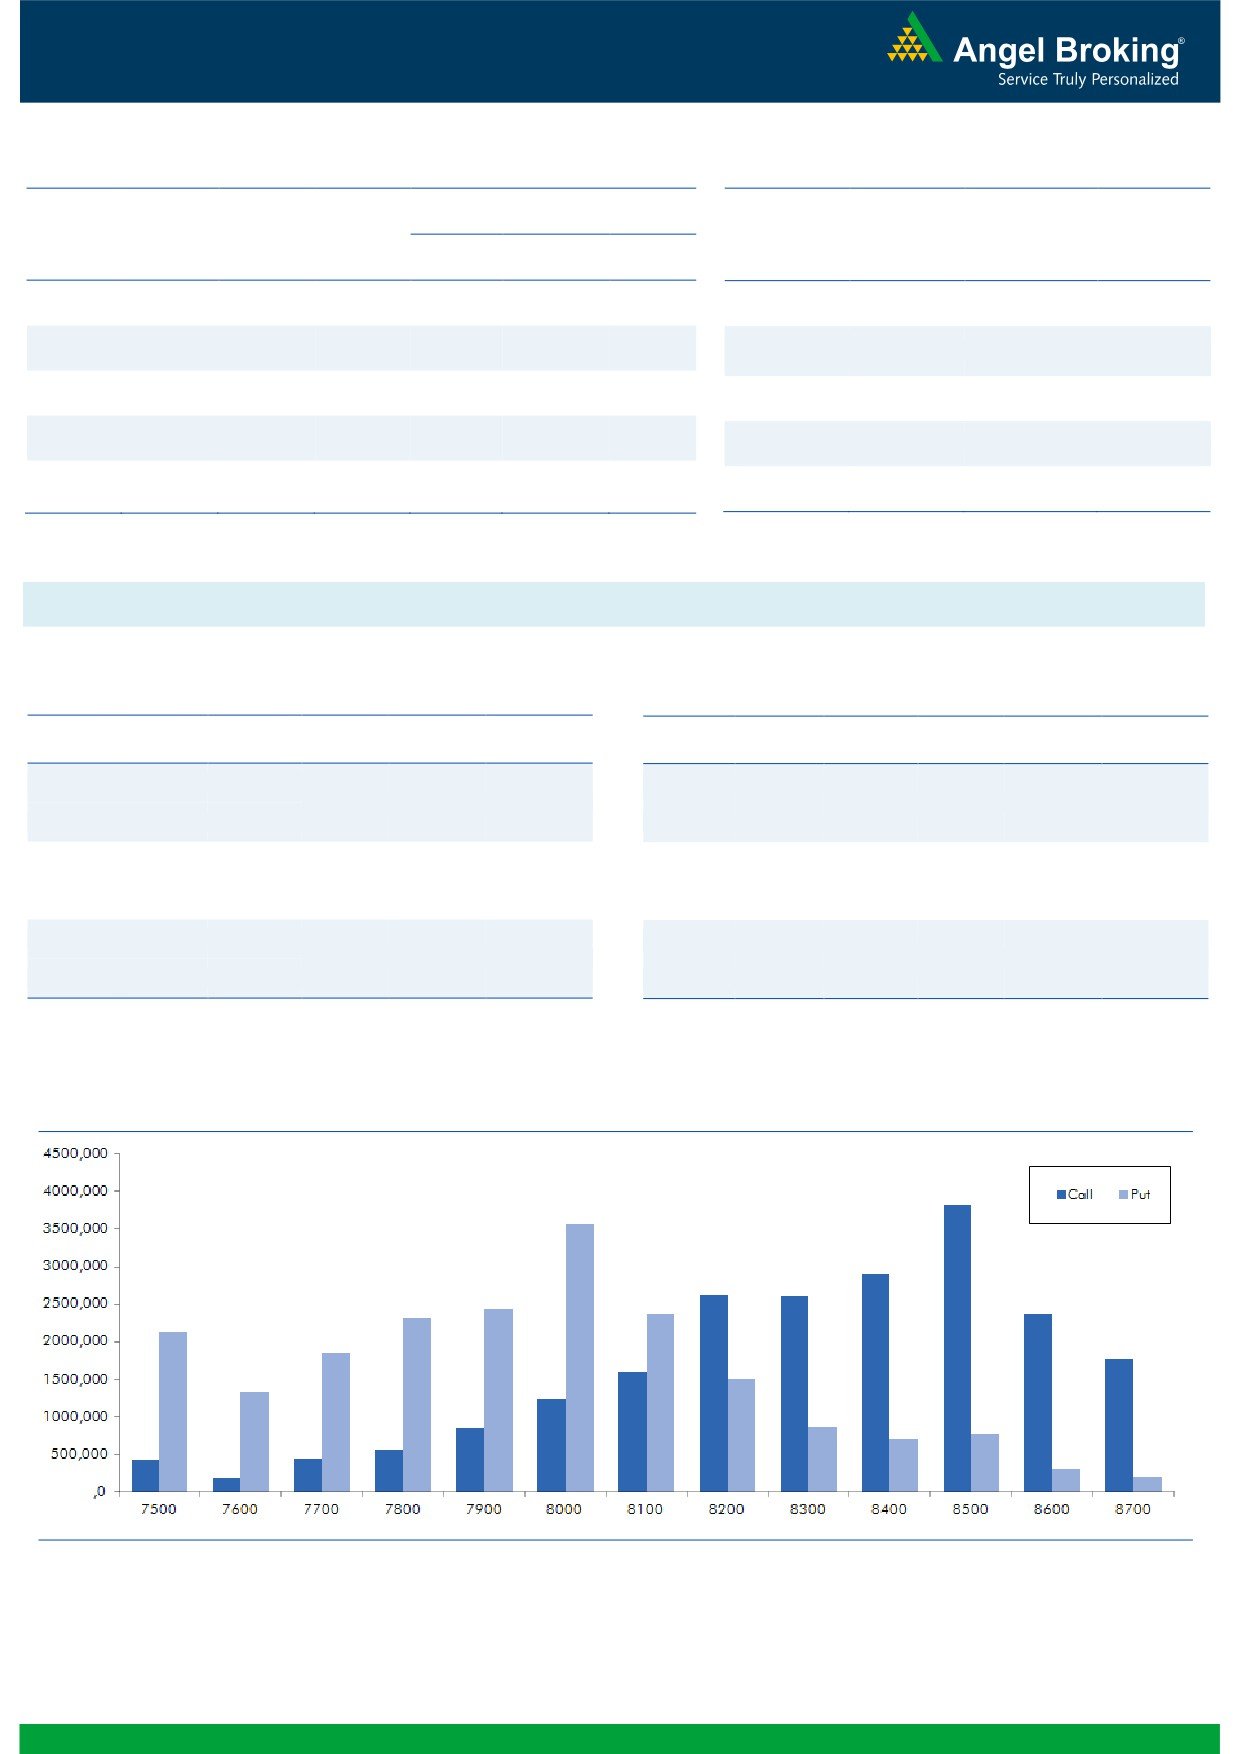
In Index Options front, they bought of Rs. 2153 crores
JUSTDIAL
2247000
17.55
800.30
-6.01
with good amount of rise in OI. In call options, we sawng.co
MARUTI
2429625
16.40
4465.85
0.03
open interest addition in the range of 8200-8500 strikes.
While in put options, 7900 and 8000 strikes added
OI Losers
decent OI. Maximum OI in current series is seen in 8500
OI
PRICE
call and 8000 put options. Seeing the over all data we
SCRIP
OI
PRICE
CHG. (%)
CHG. (%)
believe Nifty may trade in range of 7800-7850 on the
BHARATFORG
4134000
-9.50
857.85
4.83
lower side and 8300-8350 on the higher side. One
ARVIND
2896800
-5.49
277.50
-2.36
should trade accordingly.
HDFCBANK
26004000
-3.86
1103.60
-0.70
AMARAJABAT
1049400
-3.10
908.80
0.64
HINDPETRO
9457200
-3.10
771.15
1.34
Historical Volatility
SCRIP
HV
Put-Call Ratio
ITC
32.83
SCRIP
PCR-OI
PCR-VOL
NMDC
48.16
NIFTY
0.86
0.76
VOLTAS
48.00
BANKNIFTY
0.77
0.64
APOLLOTYRE
54.32
LT
0.53
0.66
LT
36.12
AXISBANK
0.39
0.42
ICICIBANK
0.58
0.59
Strategy Date
Symbol
Strategy
Status
2
Technical & Derivatives Report
November 02, 2015
FII Statistics for 30-October 2015
Turnover on 30-October 2015
Open Interest
No. of
Turnover
Change
Detail
Buy
Sell
Net
Instrument
Value
Change
Contracts
( in Cr. )
(%)
Contracts
(in Cr.)
(%)
INDEX
INDEX
2268.61
1934.55
334.06
285238
17025.83
(0.41)
279804
16080.39
-39.44
FUTURES
FUTURES
INDEX
INDEX
17034.89
14881.34
2153.55
859525
51734.97
18.25
1765907
107387.77
-73.20
OPTIONS
OPTIONS
STOCK
3502.82
3580.10
(77.28)
893650
45027.15
1.17
STOCK
FUTURES
624231
32010.11
-53.83
FUTURES
STOCK
STOCK
2391.28
2170.19
221.09
28822
1442.03
2419.41
OPTIONS
284275
14798.72
-24.40
OPTIONS
TOTAL
25197.60
22566.19
2631.41
2067235
115229.98
8.93
TOTAL
2954217
170276.99
-67.01
Nifty Spot = 8065.80
Lot Size = 25
Bull-Call Spreads
Bear-Put Spreads
Action
Strike
Price
Risk
Reward
BEP
Action
Strike
Price
Risk
Reward
BEP
Buy
8100
136.45
Buy
8000
107.45
48.00
52.00
8148.00
29.45
70.55
7970.55
Sell
8200
88.45
Sell
7900
78.00
Buy
8100
136.45
Buy
8000
107.45
82.80
117.20
8182.80
50.80
149.20
7949.20
Sell
8300
53.65
Sell
7800
56.65
Buy
8200
88.45
Buy
7900
78.00
34.80
65.20
8234.80
21.35
78.65
7878.65
Sell
8300
53.65
Sell
7800
56.65
Note: Above mentioned Bullish or Bearish Spreads in Nifty (Nov. Series) are given as an information and not as a recommendation.
Nifty Put-Call Analysis
3
Technical & Derivatives Report
November 02, 2015
Daily Pivot Levels for Nifty 50 Stocks
Scrips
S2
S1
PIVOT
R1
R2
ACC
1,357
1,368
1,383
1,395
1,410
ADANIPORTS
289
293
298
301
306
AMBUJACEM
204
205
208
210
212
ASIANPAINT
819
825
832
838
846
AXISBANK
460
467
473
481
486
BAJAJ-AUTO
2,515
2,533
2,558
2,576
2,601
BANKBARODA
156
158
162
163
167
BHARTIARTL
335
342
352
358
368
BHEL
194
196
200
203
207
BOSCHLTD
19,852
20,155
20,701
21,004
21,551
BPCL
851
861
875
885
899
CAIRN
149
151
155
157
160
CIPLA
678
684
694
700
710
COALINDIA
314
317
322
325
329
DRREDDY
4,156
4,218
4,292
4,354
4,427
GAIL
299
304
310
315
322
GRASIM
3,635
3,674
3,716
3,755
3,797
HCLTECH
863
867
872
877
882
HDFC
1,232
1,244
1,259
1,271
1,286
HDFCBANK
1,079
1,089
1,101
1,111
1,122
HEROMOTOCO
2,526
2,554
2,592
2,619
2,657
HINDALCO
81
82
85
86
89
HINDUNILVR
786
793
802
809
818
ICICIBANK
267
272
276
281
285
IDEA
138
139
141
142
143
INDUSINDBK
892
902
912
922
932
INFY
1,122
1,129
1,137
1,144
1,152
ITC
318
327
339
347
360
KOTAKBANK
649
668
681
700
713
LT
1,338
1,375
1,436
1,472
1,534
LUPIN
1,895
1,912
1,928
1,945
1,962
M&M
1,141
1,162
1,195
1,216
1,248
MARUTI
4,371
4,410
4,439
4,478
4,507
NTPC
123
128
133
138
142
ONGC
241
244
247
250
254
PNB
126
127
129
130
132
POWERGRID
126
127
130
131
133
RELIANCE
932
940
948
956
964
SBIN
232
235
238
240
243
SUNPHARMA
95
98
102
104
108
TATAMOTORS
870
880
886
896
903
TATAPOWER
379
382
386
389
394
TATASTEEL
67
68
70
71
73
TCS
239
243
249
253
259
TECHM
2,470
2,483
2,497
2,510
2,524
ULTRACEMCO
529
534
542
547
555
VEDL
2,807
2,846
2,896
2,935
2,985
WIPRO
564
568
574
578
584
YESBANK
734
747
756
768
778
ZEEL
397
403
412
418
427
4
Technical & Derivatives Report
November 02, 2015
Research Team Tel: 022 - 39357800
For Technical Queries
For Derivatives Queries
DISCLAIMER
Angel Broking Private Limited (hereinafter referred to as “Angel”) is a registered Member of National Stock Exchange of India Limited,
Bombay Stock Exchange Limited and MCX Stock Exchange Limited. It is also registered as a Depository Participant with CDSL and
Portfolio Manager with SEBI. It also has registration with AMFI as a Mutual Fund Distributor. Angel Broking Private Limited is a
registered entity with SEBI for Research Analyst in terms of SEBI (Research Analyst) Regulations, 2014 vide registration number
INH000000164. Angel or its associates has not been debarred/ suspended by SEBI or any other regulatory authority for accessing
/dealing in securities Market. Angel or its associates including its relatives/analyst do not hold any financial interest/beneficial
ownership of more than 1% in the company covered by Analyst. Angel or its associates/analyst has not received any compensation /
managed or co-managed public offering of securities of the company covered by Analyst during the past twelve months. Angel/analyst
has not served as an officer, director or employee of company covered by Analyst and has not been engaged in market making activity
of the company covered by Analyst.
This document is solely for the personal information of the recipient, and must not be singularly used as the basis of any investment
decision. Nothing in this document should be construed as investment or financial advice. Each recipient of this document should
make such investigations as they deem necessary to arrive at an independent evaluation of an investment in the securities of the
companies referred to in this document (including the merits and risks involved), and should consult their own advisors to determine
the merits and risks of such an investment.
Reports based on technical and derivative analysis center on studying charts of a stock's price movement, outstanding positions and
trading volume, as opposed to focusing on a company's fundamentals and, as such, may not match with a report on a company's
fundamentals.
The information in this document has been printed on the basis of publicly available information, internal data and other reliable
sources believed to be true, but we do not represent that it is accurate or complete and it should not be relied on as such, as this
document is for general guidance only. Angel Broking Pvt. Limited or any of its affiliates/ group companies shall not be in any way
responsible for any loss or damage that may arise to any person from any inadvertent error in the information contained in this report.
Angel Broking Pvt. Limited has not independently verified all the information contained within this document. Accordingly, we cannot
testify, nor make any representation or warranty, express or implied, to the accuracy, contents or data contained within this document.
While Angel Broking Pvt. Limited endeavors to update on a reasonable basis the information discussed in this material, there may be
regulatory, compliance, or other reasons that prevent us from doing so.
This document is being supplied to you solely for your information, and its contents, information or data may not be reproduced,
redistributed or passed on, directly or indirectly.
Neither Angel Broking Pvt. Limited, nor its directors, employees or affiliates shall be liable for any loss or damage that may arise from
or in connection with the use of this information.
Note: Please refer to the important ‘Stock Holding Disclosure' report on the Angel website (Research Section). Also, please refer to the
latest update on respective stocks for the disclosure status in respect of those stocks. Angel Broking Pvt. Limited and its affiliates may
have investment positions in the stocks recommended in this report.
5