Technical & Derivatives Report
September 02, 2016
Sensex (28423) / Nifty (8775)
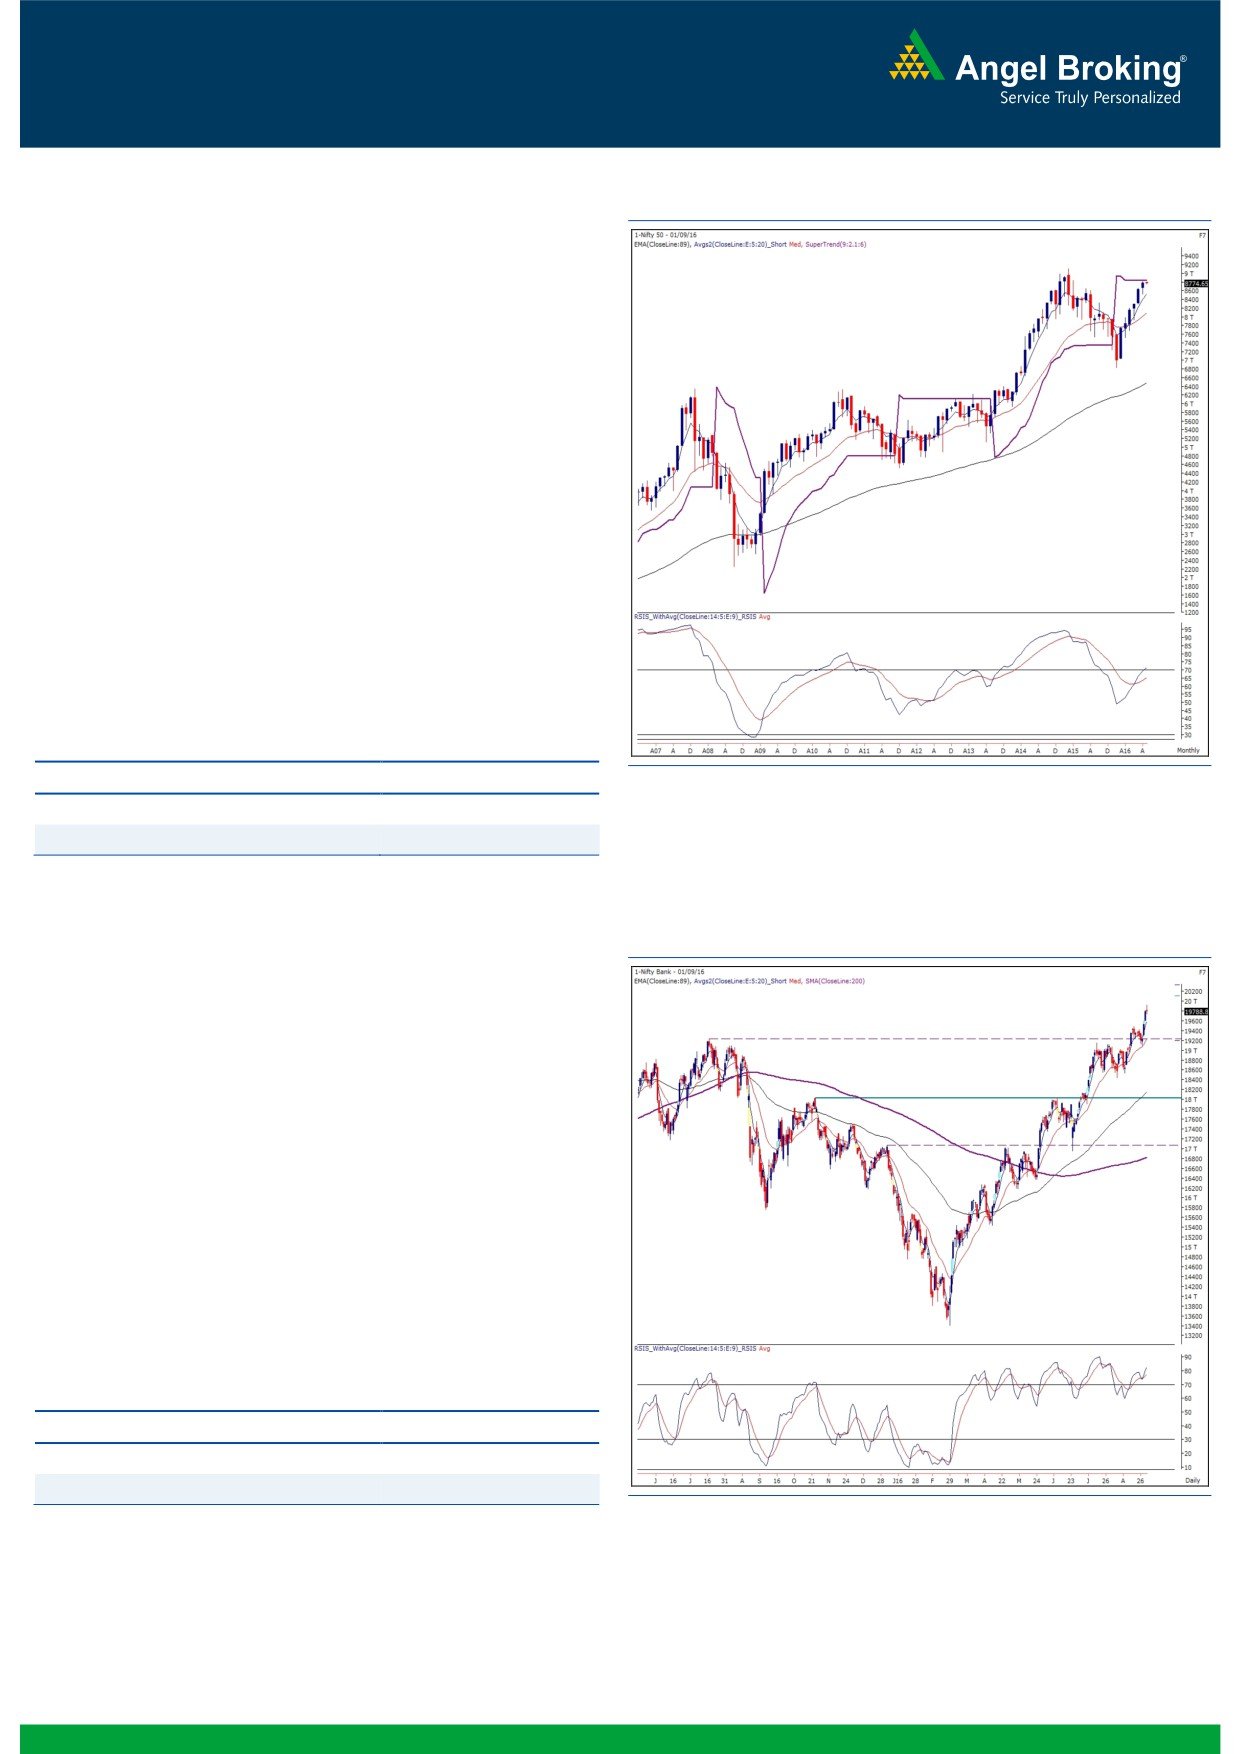
Exhibit 1: Nifty Monthly Chart
Yesterday's session opened on a flat note in-line with mixed
global cues. Subsequently, the index extended its previous
session's optimism to surpass the 8800 mark. However, we
witnessed some selling pressure at higher levels. As a result, the
index corrected below 8800 and then consolidated for the
remaining part of the day.
Yesterday, we saw some hints of profit booking as the cautious
traders chose to take some money off the table after entering our
mentioned resistance zone of 8800 - 8850 levels. However, still
there is no sign of trend reversal on the chart. We would maintain
our view that traders should to keep booking profits in the
mentioned zone. Now, we expect some consolidation in the
market; but, meanwhile, stock specific moves are likely to
continue and hence traders should keep following stock specific
approach with proper exit strategy. The intraday support for the
Nifty are placed around 8750 and 8696.
Key Levels
Support 1 - 8750
Resistance 1 - 8800
Support 2 - 8696
Resistance 2 - 8850
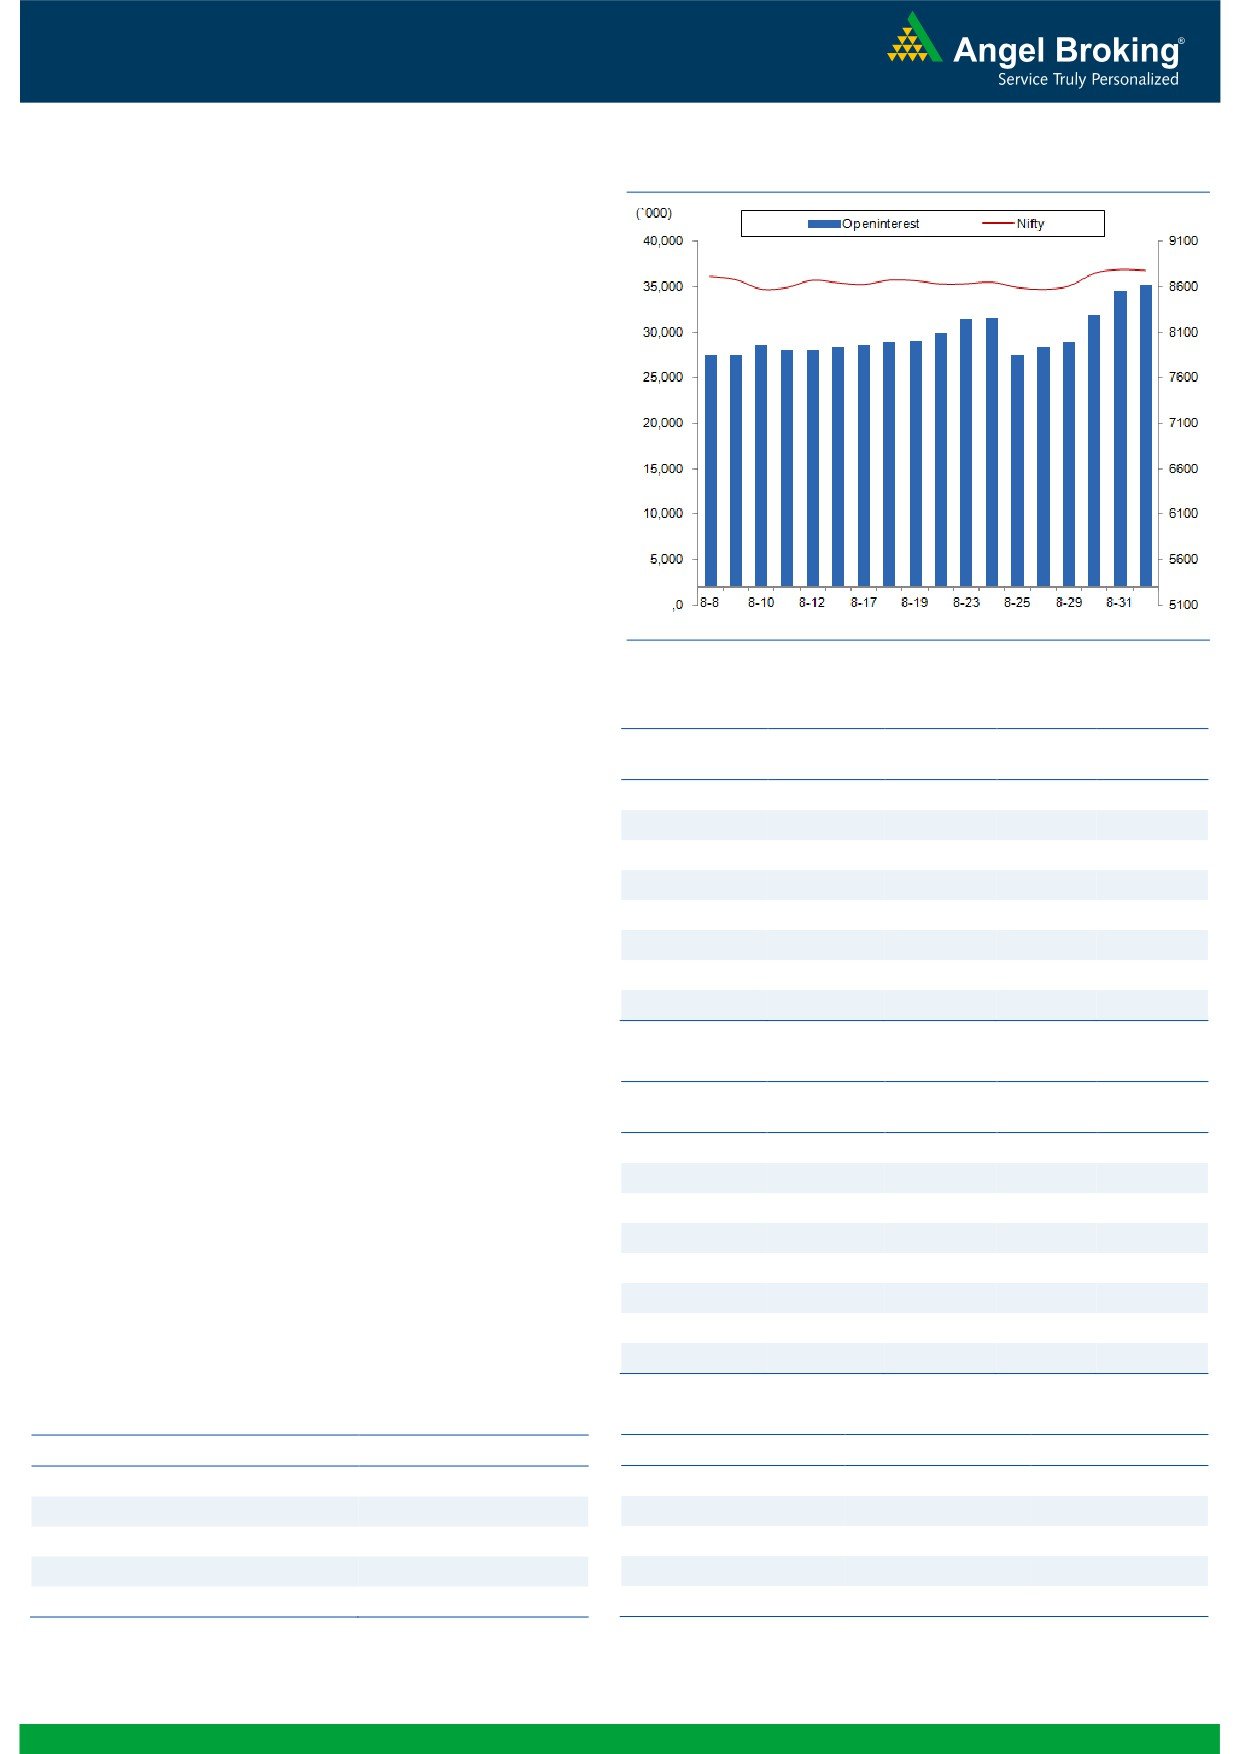
Nifty Bank Outlook - (19789)
Exhibit 2: Nifty Bank Daily Chart
The Nifty Bank index opened yesterday's session on a flat note
and rallied higher till noon. In the course of action, the index
tested the range of 19900 - 20000 which we had mentioned in
our last couple of day's outlook. The index ended on a flat note
and formed a 'Doji' candle on daily charts.
Going ahead, we are expecting stock specific momentum to
continue and hence, traders are advised to follow stock centric
approach with proper risk management. The individual
heavyweights could continue with the positive momentum and
since there are no signs of reversal, traders should refrain from
creating short positions. The intraday support for the index are
placed around 19664 and 19620 whereas resistance is seen in
range of 19900 - 20000.
Key Levels
Support 1 - 19664
Resistance 1 - 19900
Support 2 - 19620
Resistance 2 - 20000
1
Technical & Derivatives Report
September 02, 2016
Comments
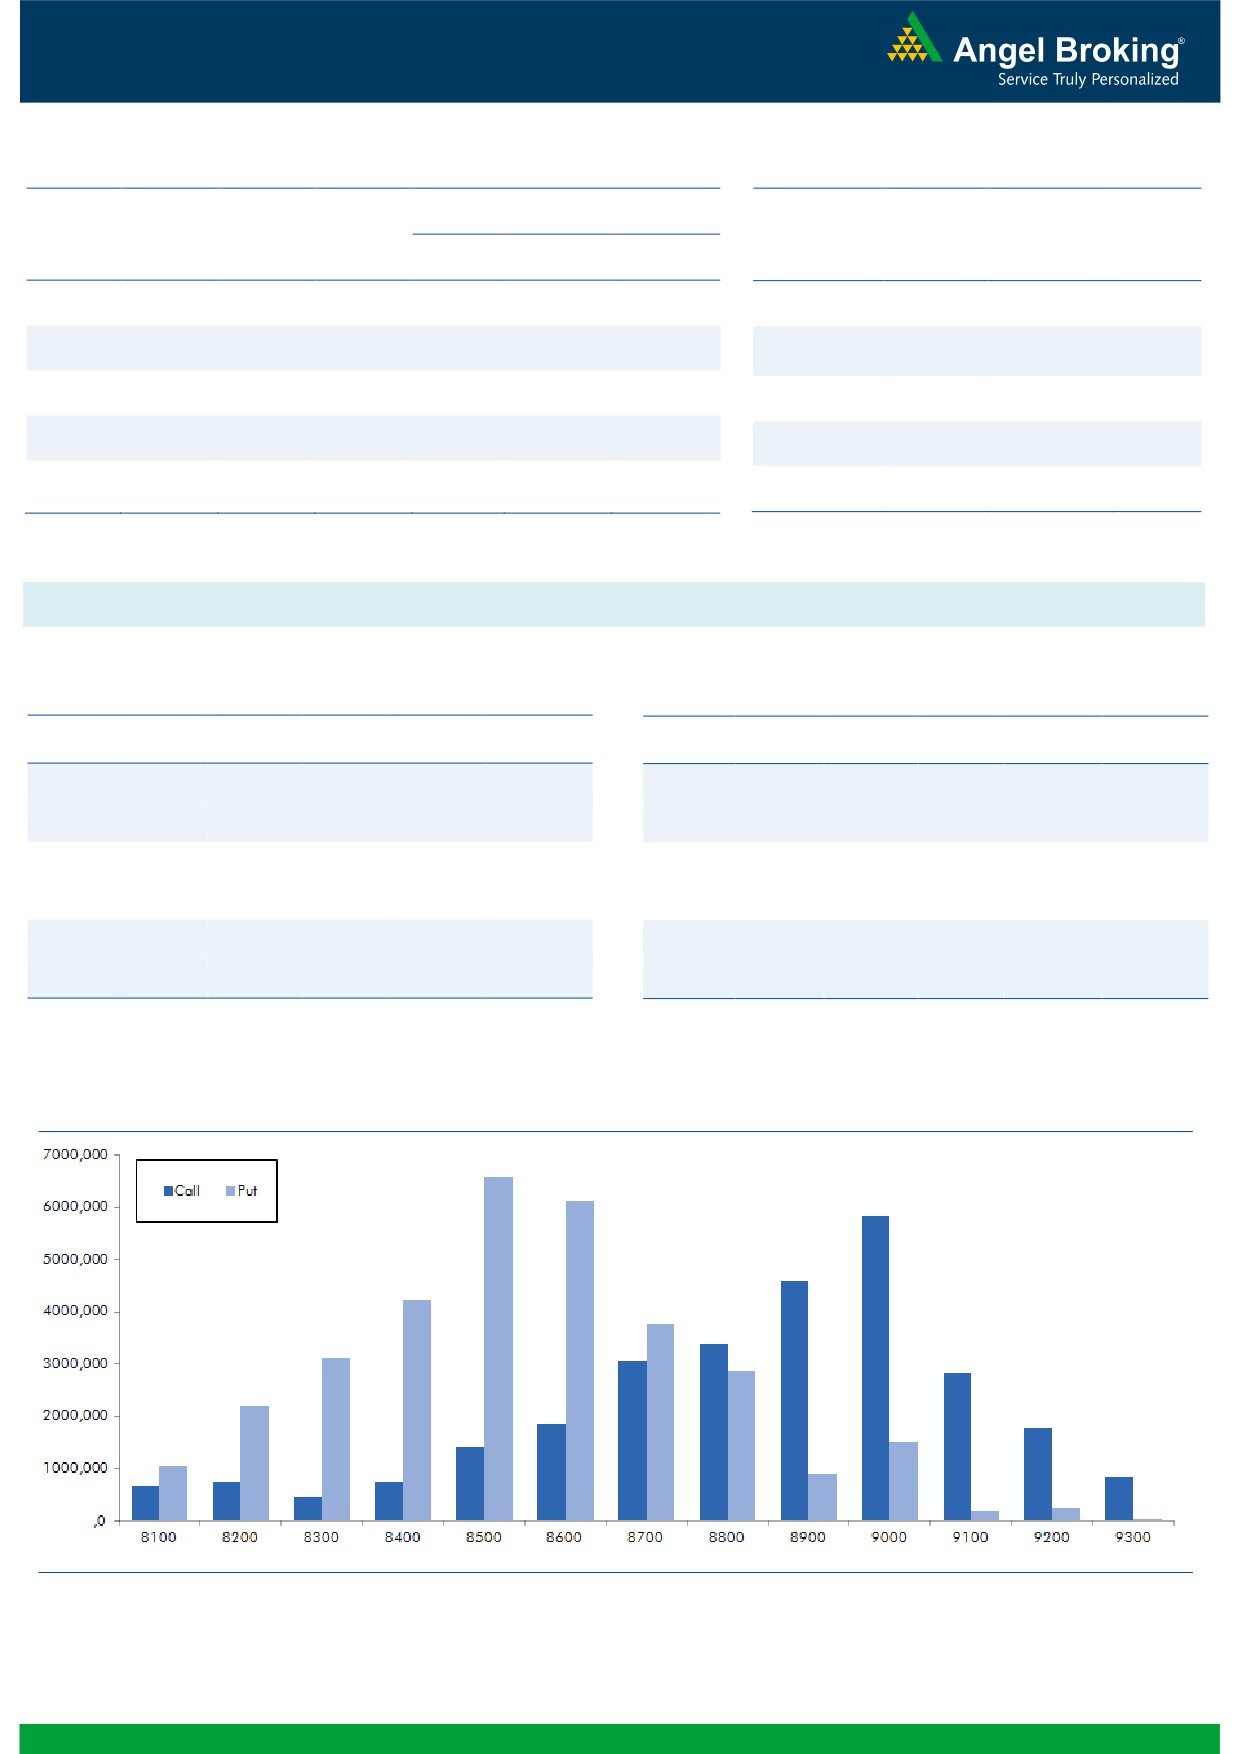
Nifty Vs OI
The Nifty futures open interest has increased by 1.87%
BankNifty futures open interest has increased by 2.88%
as market closed at 8774.65 levels.
The Nifty September future closed with a premium of
33.70 points against a premium of 49.95 points in
previous session. The October series closed at a
premium of 73.85 points.
The Implied Volatility of at the money options has
decreased from 11.55% to 11.47%. At the same time,
the PCR-OI of Nifty has increased from 1.09 to 1.11.
The total OI of the market is Rs. 2,89,641/- cr. and the
stock futures OI is Rs. 82,401/- cr.
Few of the liquid counters where we have seen high cost
of carry are INDIACEM, CESC, ICIL, CEATLTD and
TATAELXSI.
Views
OI Gainers
OI
PRICE
Yesterday, FIIs were net seller in equity cash segment
SCRIP
OI
PRICE
CHG. (%)
CHG. (%)
worth Rs. 302 crores. This sell number can be mainly due
IDEA
57825000
24.57
83.00
-11.18
to huge delivery based selling seen in telecom
BHARTIARTL
31810500
19.23
310.35
-6.98
companies. On the other hand, they bought Index
IBREALEST
46360000
15.41
79.10
-4.41
Futures to the tune of Rs. 364 crores with.riseeinrOI,ng.com
ULTRACEMCO
951400
15.35
4078.25
0.68
indicating formation of long positions in last trading
ENGINERSIN
5981500
14.31
269.45
2.94
session.
RELIANCE
23680000
11.75
1036.30
-2.54
On Index Options front, FIIs were net buyers of Rs. 806
RCOM
139170000
9.65
49.35
-9.28
crores with good amount of rise in OI. In call options,
INDIACEM
24052000
9.22
152.65
1.09
8900 was active and added fresh positions. While in put
options, except some unwinding in 8400 strike, we didn’t
witness any meaningful activity in any strikes. Highest OI
OI Losers
OI
PRICE
in September series is visible in 9000 call and 8500 put
SCRIP
OI
PRICE
CHG. (%)
CHG. (%)
options.
NCC
28200000
-7.84
86.20
0.76
FIIs continued their buying streak in index future segment
FEDERALBNK
32241000
-7.71
69.90
1.23
for fifth consecutive session. They also bought call
SRF
299500
-5.52
1713.30
-0.59
options in last few sessions. At current juncture, there is
PFC
26394000
-5.48
122.30
-1.53
no sign of weakness in market as per derivative data.
APOLLOTYRE
9855000
-5.30
186.75
1.58
Thus, intraday dips are buying opportunities in Nifty as
HAVELLS
3094000
-5.27
424.60
0.90
we may see 8950-9000 in near term. Hence, traders are
SYNDIBANK
13176000
-5.18
74.20
-4.26
advised to trade with positive bias.
M&M
6713000
-4.85
1460.50
0.92
Historical Volatility
Put-Call Ratio
SCRIP
HV
SCRIP
PCR-OI
PCR-VOL
IDEA
70.40
NIFTY
1.11
1.19
BHARTIARTL
43.76
BANKNIFTY
1.28
0.94
RCOM
60.35
RELIANCE
0.45
0.55
RPOWER
30.15
SBIN
0.79
0.67
KSCL
39.31
TATAMOTORS
1.17
0.89
2
Technical & Derivatives Report
September 02, 2016
FII Statistics for 01, September 2016
Turnover on 01, September 2016
Open Interest
No. of
Turnover
Change
Detail
Buy
Sell
Net
Instrument
Value
Contracts
( in Cr. )
(%)
Contracts
Change (%)
(in Cr.)
INDEX
INDEX
2042.38
1678.68
363.70
441567
29683.45
4.07
194664
13972.89
-25.01
FUTURES
FUTURES
INDEX
INDEX
43716.68
42910.76
805.92
1021953
68520.40
4.58
5287812
402277.44
35.57
OPTIONS
OPTIONS
STOCK
6595.38
7000.48
(405.10)
870715
57872.13
0.90
STOCK
FUTURES
624470
41988.59
-14.04
FUTURES
STOCK
STOCK
5115.60
5098.01
17.59
74851
5097.75
11.56
OPTIONS
379718
24920.90
6.41
OPTIONS
TOTAL
57470.04
56687.94
782.11
2409086
161173.74
3.33
TOTAL
6486664
483159.82
24.64
Nifty Spot = 8774.65
Lot Size = 75
Bull-Call Spreads
Bear-Put Spreads
Action
Strike
Price
Risk
Reward
BEP
Action
Strike
Price
Risk
Reward
BEP
Buy
8900
69.00
Buy
8700
73.95
30.65
69.35
8930.65
24.60
75.40
8675.40
Sell
9000
38.35
Sell
8600
49.35
Buy
8900
69.00
Buy
8700
73.95
49.50
150.50
8949.50
40.80
159.20
8659.20
Sell
9100
19.50
Sell
8500
33.15
Buy
9000
38.35
Buy
8600
49.35
18.85
81.15
9018.85
16.20
83.80
8583.80
Sell
9100
19.50
Sell
8500
33.15
Note: Above mentioned Bullish or Bearish Spreads in Nifty (September Series) are given as an information and not as a recommendation.
Nifty Put-Call Analysis
3
Technical & Derivatives Report
September 02, 2016
Daily Pivot Levels for Nifty Constituents
Scrips
S2
S1
PIVOT
R1
R2
ACC
1,654
1,671
1,685
1,702
1,716
ADANIPORTS
254
256
260
262
266
AMBUJACEM
270
273
276
280
283
ASIANPAINT
1,132
1,145
1,154
1,167
1,176
AUROPHARMA
756
765
779
787
801
AXISBANK
586
591
597
602
608
BAJAJ-AUTO
2,928
2,963
2,991
3,026
3,054
BANKBARODA
158
160
162
163
166
BHEL
131
133
137
139
142
BPCL
569
578
592
601
616
BHARTIARTL
284
297
315
328
346
INFRATEL
332
338
348
353
363
BOSCH
23,562
23,840
24,235
24,513
24,908
CIPLA
567
573
577
583
587
COALINDIA
330
334
337
340
343
DRREDDY
3,048
3,073
3,091
3,116
3,134
EICHERMOT
22,525
22,650
22,800
22,924
23,075
GAIL
378
385
390
397
402
GRASIM
4,493
4,549
4,636
4,692
4,779
HCLTECH
774
779
784
789
795
HDFCBANK
1,268
1,276
1,283
1,291
1,298
HDFC
1,395
1,410
1,420
1,435
1,445
HEROMOTOCO
3,488
3,518
3,556
3,586
3,625
HINDALCO
154
156
158
160
162
HINDUNILVR
907
916
923
932
939
ICICIBANK
256
258
261
264
266
IDEA
76
80
87
91
97
INDUSINDBK
1,171
1,178
1,187
1,194
1,203
INFY
1,028
1,033
1,037
1,041
1,045
ITC
257
259
261
263
265
KOTAKBANK
802
806
812
816
822
LT
1,493
1,500
1,509
1,516
1,524
LUPIN
1,468
1,485
1,498
1,515
1,528
M&M
1,425
1,439
1,452
1,466
1,479
MARUTI
4,979
5,020
5,060
5,101
5,141
NTPC
156
158
159
160
162
ONGC
233
235
237
239
241
POWERGRID
181
183
184
185
187
RELIANCE
996
1,012
1,043
1,059
1,090
SBIN
249
250
253
254
256
SUNPHARMA
760
765
772
777
784
TCS
2,462
2,485
2,510
2,533
2,558
TATAMTRDVR
339
342
345
347
350
TATAMOTORS
537
540
543
547
550
TATAPOWER
76
77
79
80
82
TATASTEEL
366
370
374
378
382
TECHM
461
465
471
475
481
ULTRACEMCO
3,906
3,984
4,039
4,117
4,172
WIPRO
477
480
485
489
493
YESBANK
1,351
1,358
1,367
1,374
1,384
ZEEL
526
531
538
542
549
4
Technical & Derivatives Report
September 02, 2016
Research Team Tel: 022 - 39357800
For Technical Queries
For Derivatives Queries
DISCLAIMER
Angel Broking Private Limited (hereinafter referred to as “Angel”) is a registered Member of National Stock Exchange of India Limited,
Bombay Stock Exchange Limited and Metropolitan Stock Exchange Limited. It is also registered as a Depository Participant with CDSL
and Portfolio Manager with SEBI. It also has registration with AMFI as a Mutual Fund Distributor. Angel Broking Private Limited is a
registered entity with SEBI for Research Analyst in terms of SEBI (Research Analyst) Regulations, 2014 vide registration number
INH000000164. Angel or its associates has not been debarred/ suspended by SEBI or any other regulatory authority for accessing
/dealing in securities Market. Angel or its associates/analyst has not received any compensation / managed or co-managed public
offering of securities of the company covered by Analyst during the past twelve months.
This document is solely for the personal information of the recipient, and must not be singularly used as the basis of any investment
decision. Nothing in this document should be construed as investment or financial advice. Each recipient of this document should
make such investigations as they deem necessary to arrive at an independent evaluation of an investment in the securities of the
companies referred to in this document (including the merits and risks involved), and should consult their own advisors to determine
the merits and risks of such an investment.
Reports based on technical and derivative analysis center on studying charts of a stock's price movement, outstanding positions and
trading volume, as opposed to focusing on a company's fundamentals and, as such, may not match with a report on a company's
fundamentals. Investors are advised to refer the Fundamental and Technical Research Reports available on our website to evaluate the
contrary view, if any.
The information in this document has been printed on the basis of publicly available information, internal data and other reliable
sources believed to be true, but we do not represent that it is accurate or complete and it should not be relied on as such, as this
document is for general guidance only. Angel Broking Pvt. Limited or any of its affiliates/ group companies shall not be in any way
responsible for any loss or damage that may arise to any person from any inadvertent error in the information contained in this report.
Angel Broking Pvt. Limited has not independently verified all the information contained within this document. Accordingly, we cannot
testify, nor make any representation or warranty, express or implied, to the accuracy, contents or data contained within this document.
While Angel Broking Pvt. Limited endeavors to update on a reasonable basis the information discussed in this material, there may be
regulatory, compliance, or other reasons that prevent us from doing so.
This document is being supplied to you solely for your information, and its contents, information or data may not be reproduced,
redistributed or passed on, directly or indirectly.
Neither Angel Broking Pvt. Limited, nor its directors, employees or affiliates shall be liable for any loss or damage that may arise from
or in connection with the use of this information.
5