Technical & Derivatives Report
June 02, 2016
Sensex (26714) / Nifty (8180)
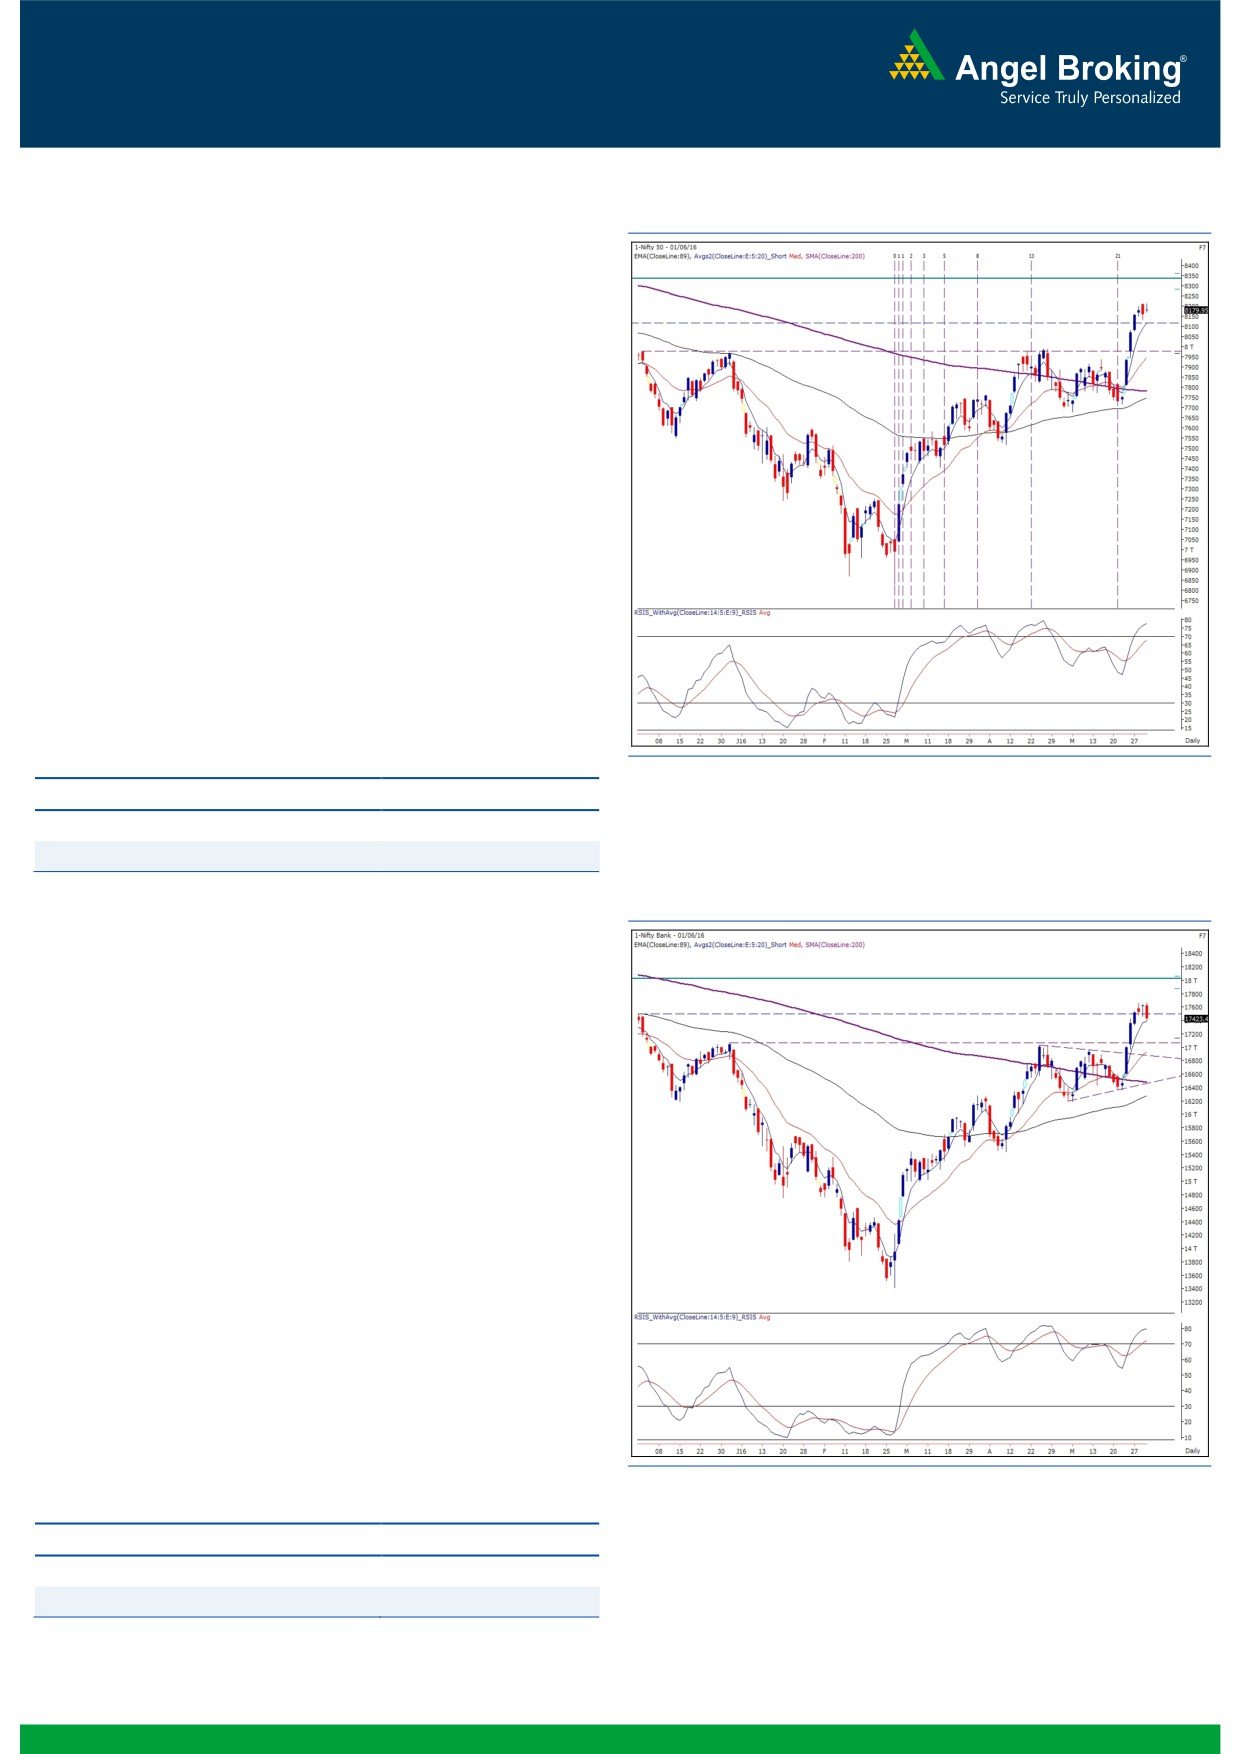
Exhibit 1: Nifty Daily Chart
Post marginal gap up opening, the Nifty surpassed the 8200
mark initially, but once again, weak traders chose to exit their
longs and as a result, we witnessed a gradual decline to trim
some part of morning gains. Eventually, Nifty ended the session
by adding 0.24% over its previous close.
Yesterday’s session was almost a replica of previous two days
movement as the index failed to sustain at higher levels. The
overall trading range has shrunk drastically after seeing a
humongous rally from 7700. Still, the chart structure remains
intact and hence, our view remains unchanged. We reiterate that
in case of any minor intraday dips, traders should look to go long
as we expect upward bias to continue in the forthcoming days as
well. We would like to keep highlighting one key point, the
market has entered a strong bullish zone and thus, traders should
now look at the support levels rather than finding resistances. The
immediate support is at 8140 - 8120 and intraday resistances at
8220 - 8250.
Key Levels
Support 1 - 8140
Resistance 1 - 8220
Support 2 - 8120
Resistance 2 - 8250
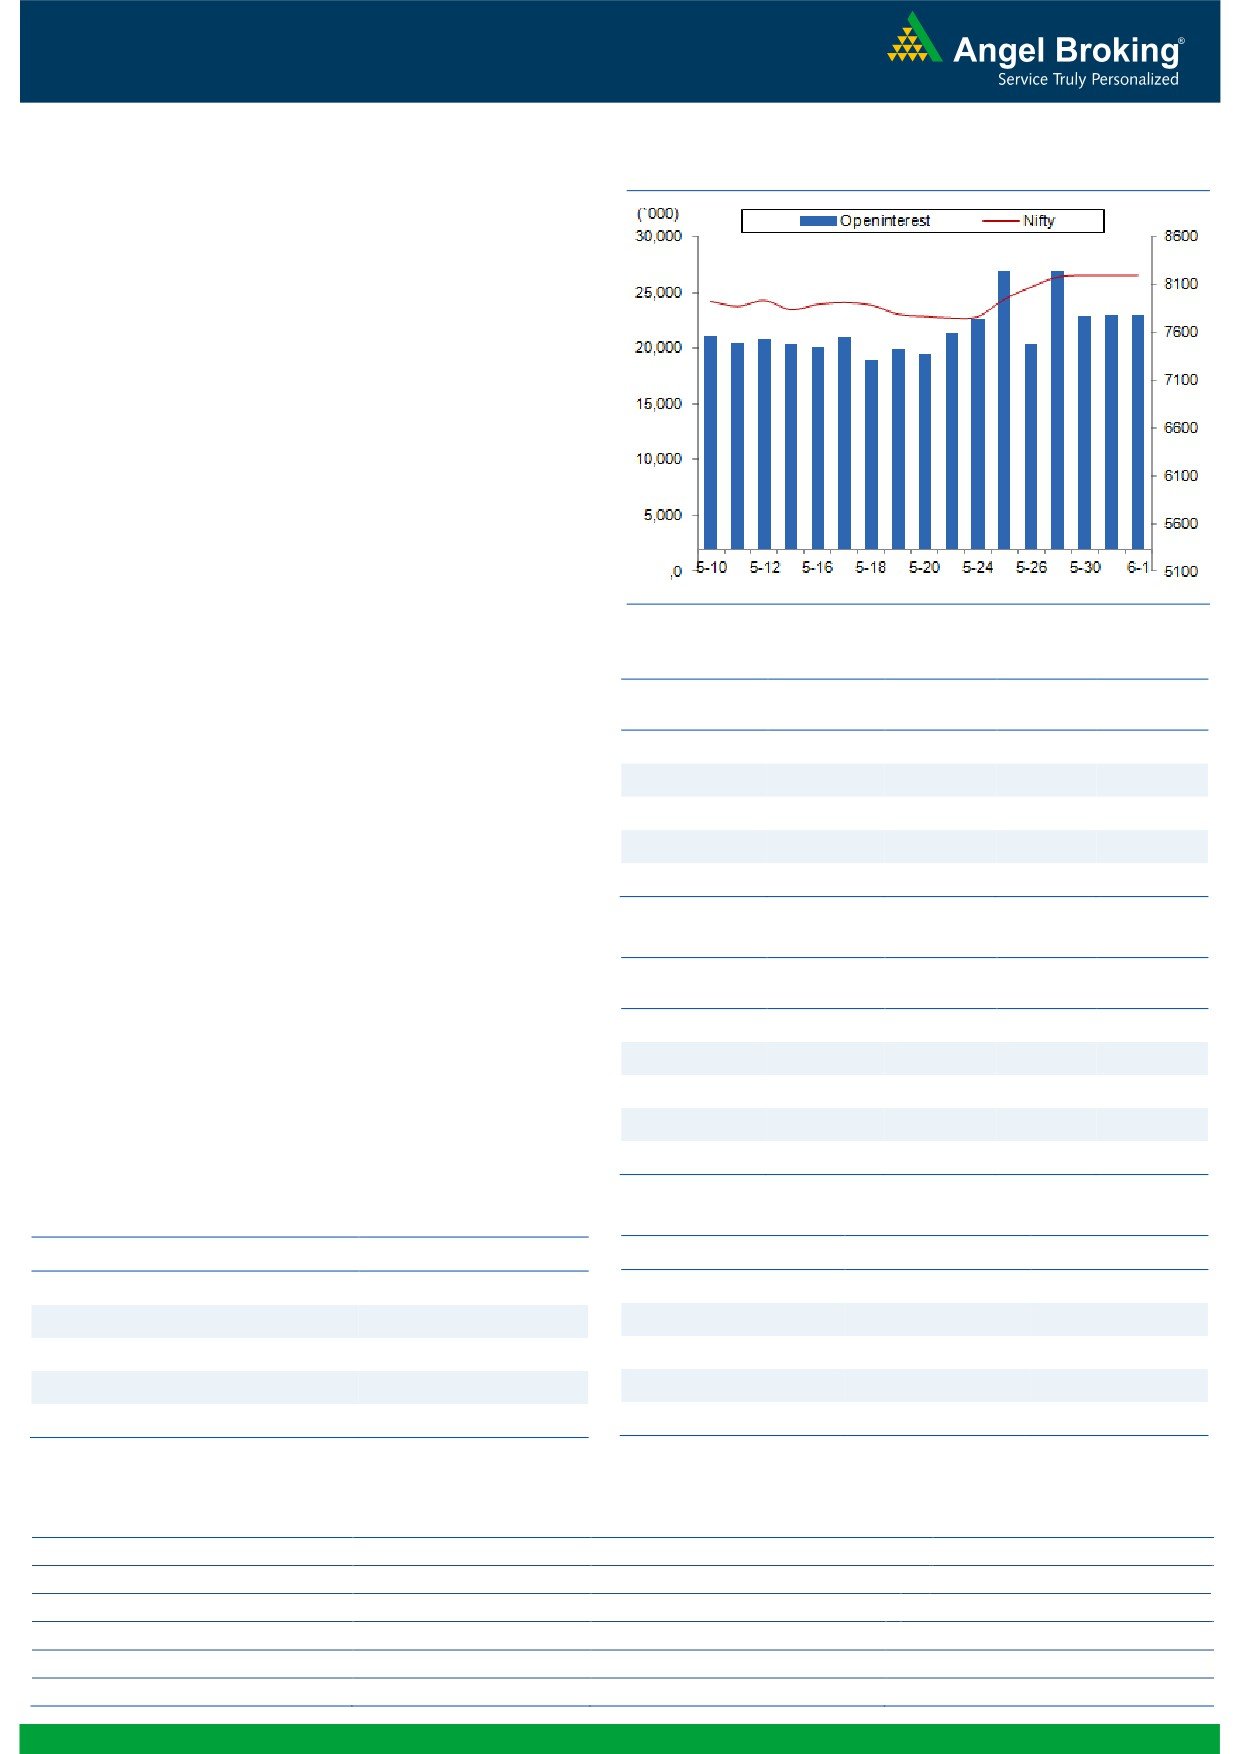
Exhibit 2: Nifty Bank Daily Chart
Nifty Bank Outlook - (17423)
In yesterday's trading session, the Nifty Bank index opened
marginally in the positive; however; it started correcting from the
opening tick and crept lower throughout the session to conclude
with losses of 1.12% over its previous session’s close.
In yesterday's report, we had mentioned about the formation of
'Dragonfly Doji' candlestick pattern in Nifty Bank index on daily
charts. It is a reversal pattern and generally implies reversal of the
trend. Although, the pattern got activated yesterday as the low of
17462 was breached, we are expecting this pattern to lead to a
temporary halt in the ongoing momentum and not reversal of the
uptrend. The prime reason for not turning bearish in spite of the
reversal pattern is the chart structure of the individual heavyweight
stocks which continues to depict the bullish trend. Hence, traders
with long positions are advised to keep holding their long
positions and not create short positions in anticipation of trend
reversal. The near term support for the index is placed around
17320 and 17100; whereas, resistances are seen around 17670
and 17780.
Key Levels
Support 1 - 17320
Resistance 1 - 17670
Support 2 - 17100
Resistance 2 - 17780
1
Technical & Derivatives Report
June 02, 2016
Comments
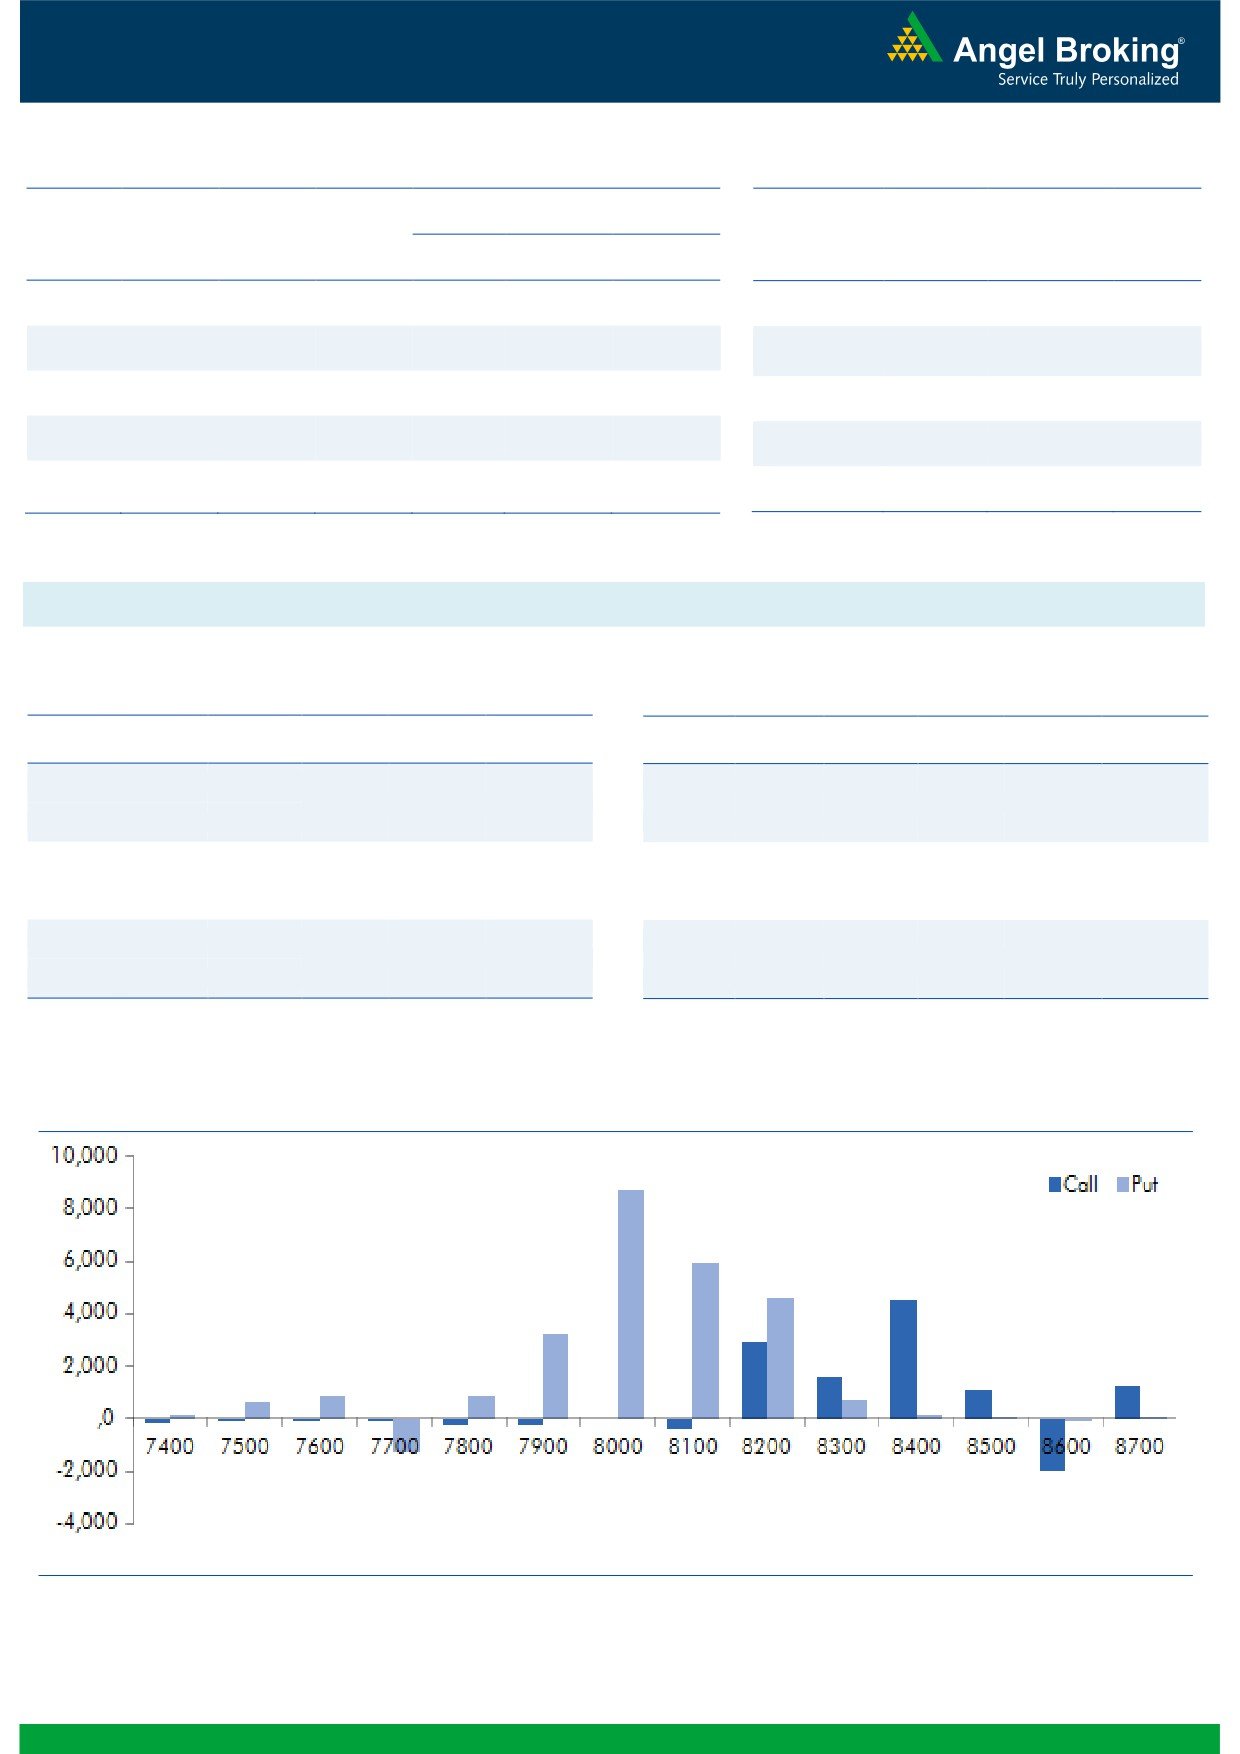
Nifty Vs OI
The Nifty futures open interest has increased by 0.12%
BankNifty futures open interest has decreased by 2.35%
as market closed at 8179.95 levels.
The Nifty June future closed with a premium of 14.60
points against a premium of 30.80 points in previous
session. The July series closed at a premium of 35.15
points.
The Implied Volatility of at the money options has
increased marginally from 14.24% to 14.27%.
The total OI of the market is Rs. 1,97,682/- cr. and the
stock futures OI is Rs. 61,205/- cr.
Few of the liquid counters where we have seen high cost
of carry are JPASSOCIAT, UNITECH, AJANTPHARMA,
KOTAKBANK and RCOM.
Views
OI Gainers
OI
PRICE
FIIs were net buyers in cash market segment yesterday;
SCRIP
OI
PRICE
CHG. (%)
CHG. (%)
they bought to the tune of Rs. 260 crores. In Index
ASIANPAINT
4043400
14.57
1021.70
3.30
Futures, they sold of Rs. 287 crores with rise in OI,
ABIRLANUVO
1209750
11.94
1080.25
3.31
indicating some short formation in last trading session.
PIDILITIND
1009000
11.49
717.65
2.04
In Index Options front, FIIs bought of worth Rs. 350
crores with good amount of rise in open interest. Overall
NMDC
8871000
8.17
86.60
-2.08
activity in call options remained subdued. While in put
HAVELLS
5490000
7.69
356.65
-1.74
options, 8000 & 8100 strikes added some build-up.
Maximum build-up in June series is visible in 8400 call
OI Losers
and 8000 put options. We believe 8000-8050 levels
OI
PRICE
SCRIP
OI
PRICE
may now act as a very strong support for market.
CHG. (%)
CHG. (%)
Yesterday’s selling figure in Index Futures is far less than
JUSTDIAL
1802200
-10.36
695.50
2.57
the quantum of buying witness in the last week of May
TORNTPHARM
177600
-7.50
1362.70
1.31
series and first two days of current series. One should
SRF
566400
-6.72
1287.85
-1.03
avoid forming any shorts at current junction, it’s a buy on
AJANTPHARM
291600
-5.08
1529.85
0.90
dip market for us.
CROMPGREAV
14958000
-4.85
68.25
3.30
Historical Volatility
Put-Call Ratio
SCRIP
HV
SCRIP
PCR-OI
PCR-VOL
ASIANPAINT
29.82
NIFTY
1.04
1.00
BHARTIARTL
32.92
BANKNIFTY
0.88
0.90
APOLLOHOSP
33.42
SBIN
0.85
0.59
EXIDEIND
35.02
ICICIBANK
0.52
0.56
RCOM
52.40
RELIANCE
0.74
0.50
Strategy Date
Symbol
Strategy
Status
May 30, 2016
TCS
Ratio Bull Call Spread
Active
2
Technical & Derivatives Report
June 02, 2016
FII Statistics for 31-May 2016
Turnover on 31-May 2016
Open Interest
No. of
Turnover
Change
Detail
Buy
Sell
Net
Instrument
Value
Contracts
( in Cr. )
(%)
Contracts
Change (%)
(in Cr.)
INDEX
INDEX
1475.96
1762.50
(286.54)
293473
17672.80
1.70
233701
13472.77
-3.97
FUTURES
FUTURES
INDEX
INDEX
21995.71
21645.72
349.99
884552
53771.42
4.27
2081752
122112.71
6.09
OPTIONS
OPTIONS
STOCK
5029.87
4469.12
560.74
1041846
51586.40
2.06
STOCK
FUTURES
578417
29550.65
-23.92
FUTURES
STOCK
STOCK
2667.55
2618.05
49.50
65860
3373.76
16.20
OPTIONS
304778
15864.24
-14.74
OPTIONS
TOTAL
31169.08
30495.39
673.69
2285731
126404.38
3.22
TOTAL
3198648
181000.38
-2.99
Nifty Spot = 8179.95
Lot Size = 75
Bull-Call Spreads
Bear-Put Spreads
Action
Strike
Price
Risk
Reward
BEP
Action
Strike
Price
Risk
Reward
BEP
Buy
8200
126.40
Buy
8200
134.05
47.40
52.60
8247.40
38.75
61.25
8161.25
Sell
8300
79.00
Sell
8100
95.30
Buy
8200
126.40
Buy
8200
134.05
81.25
118.75
8281.25
66.85
133.15
8133.15
Sell
8400
45.15
Sell
8000
67.20
Buy
8300
79.00
Buy
8100
95.30
33.85
66.15
8333.85
28.10
71.90
8071.90
Sell
8400
45.15
Sell
8000
67.20
Note: Above mentioned Bullish or Bearish Spreads in Nifty (June Series) are given as an information and not as a recommendation.
Nifty Put-Call Analysis
3
Technical & Derivatives Report
June 02, 2016
Daily Pivot Levels for Nifty Constituents
Scrips
S2
S1
PIVOT
R1
R2
ACC
1,515
1,534
1,547
1,566
1,579
ADANIPORTS
189
195
199
206
210
AMBUJACEM
227
229
231
233
235
ASIANPAINT
976
999
1,012
1,035
1,048
AUROPHARMA
776
782
793
799
809
AXISBANK
498
505
517
524
537
BAJAJ-AUTO
2,578
2,591
2,613
2,626
2,648
BANKBARODA
135
137
140
142
146
BHEL
115
117
119
121
124
BPCL
975
981
988
995
1,002
BHARTIARTL
348
356
360
368
372
INFRATEL
370
378
382
389
393
BOSCH
21,907
22,087
22,286
22,466
22,665
CIPLA
456
460
467
472
479
COALINDIA
285
291
295
301
306
DRREDDY
3,144
3,164
3,192
3,211
3,240
EICHERMOT
18,365
18,539
18,674
18,848
18,983
GAIL
366
369
372
375
378
GRASIM
4,301
4,329
4,359
4,387
4,417
HCLTECH
724
729
737
742
750
HDFCBANK
1,164
1,170
1,176
1,182
1,188
HDFC
1,222
1,233
1,241
1,251
1,259
HEROMOTOCO
3,036
3,062
3,097
3,124
3,159
HINDALCO
101
102
104
105
107
HINDUNILVR
838
846
855
864
872
ICICIBANK
235
238
242
244
248
IDEA
113
115
117
119
121
INDUSINDBK
1,091
1,098
1,103
1,109
1,114
INFY
1,235
1,247
1,258
1,269
1,280
ITC
350
356
359
365
368
KOTAKBANK
736
741
745
750
755
LT
1,447
1,456
1,470
1,479
1,493
LUPIN
1,467
1,479
1,489
1,501
1,511
M&M
1,314
1,324
1,336
1,346
1,359
MARUTI
4,122
4,144
4,172
4,194
4,222
NTPC
140
142
144
146
147
ONGC
208
209
211
213
215
POWERGRID
147
148
149
150
152
RELIANCE
943
948
957
963
971
SBIN
189
194
201
206
213
SUNPHARMA
741
748
759
766
778
TCS
2,543
2,588
2,617
2,662
2,691
TATAMTRDVR
302
305
312
315
322
TATAMOTORS
438
443
451
457
464
TATAPOWER
71
72
73
74
76
TATASTEEL
324
328
334
338
344
TECHM
534
537
540
543
546
ULTRACEMCO
3,180
3,204
3,232
3,256
3,284
WIPRO
542
548
552
558
562
YESBANK
991
1,004
1,019
1,033
1,047
ZEEL
438
444
448
454
458
4
Technical & Derivatives Report
June 02, 2016
Research Team Tel: 022 - 39357800
For Technical Queries
For Derivatives Queries
DISCLAIMER
Angel Broking Private Limited (hereinafter referred to as “Angel”) is a registered Member of National Stock Exchange of India Limited,
Bombay Stock Exchange Limited and MCX Stock Exchange Limited. It is also registered as a Depository Participant with CDSL and
Portfolio Manager with SEBI. It also has registration with AMFI as a Mutual Fund Distributor. Angel Broking Private Limited is a
registered entity with SEBI for Research Analyst in terms of SEBI (Research Analyst) Regulations, 2014 vide registration number
INH000000164. Angel or its associates has not been debarred/ suspended by SEBI or any other regulatory authority for accessing
/dealing in securities Market. Angel or its associates including its relatives/analyst do not hold any financial interest/beneficial
ownership of more than 1% in the company covered by Analyst. Angel or its associates/analyst has not received any compensation /
managed or co-managed public offering of securities of the company covered by Analyst during the past twelve months. Angel/analyst
has not served as an officer, director or employee of company covered by Analyst and has not been engaged in market making activity
of the company covered by Analyst.
This document is solely for the personal information of the recipient, and must not be singularly used as the basis of any investment
decision. Nothing in this document should be construed as investment or financial advice. Each recipient of this document should
make such investigations as they deem necessary to arrive at an independent evaluation of an investment in the securities of the
companies referred to in this document (including the merits and risks involved), and should consult their own advisors to determine
the merits and risks of such an investment.
Reports based on technical and derivative analysis center on studying charts of a stock's price movement, outstanding positions and
trading volume, as opposed to focusing on a company's fundamentals and, as such, may not match with a report on a company's
fundamentals.
The information in this document has been printed on the basis of publicly available information, internal data and other reliable
sources believed to be true, but we do not represent that it is accurate or complete and it should not be relied on as such, as this
document is for general guidance only. Angel Broking Pvt. Limited or any of its affiliates/ group companies shall not be in any way
responsible for any loss or damage that may arise to any person from any inadvertent error in the information contained in this report.
Angel Broking Pvt. Limited has not independently verified all the information contained within this document. Accordingly, we cannot
testify, nor make any representation or warranty, express or implied, to the accuracy, contents or data contained within this document.
While Angel Broking Pvt. Limited endeavors to update on a reasonable basis the information discussed in this material, there may be
regulatory, compliance, or other reasons that prevent us from doing so.
This document is being supplied to you solely for your information, and its contents, information or data may not be reproduced,
redistributed or passed on, directly or indirectly.
Neither Angel Broking Pvt. Limited, nor its directors, employees or affiliates shall be liable for any loss or damage that may arise from
or in connection with the use of this information.
Note: Please refer to the important ‘Stock Holding Disclosure' report on the Angel website (Research Section). Also, please refer to the
latest update on respective stocks for the disclosure status in respect of those stocks. Angel Broking Pvt. Limited and its affiliates may
have investment positions in the stocks recommended in this report.
5