Technical & Derivatives Report
May 02, 2016
Sensex (25607) / Nifty (7850)
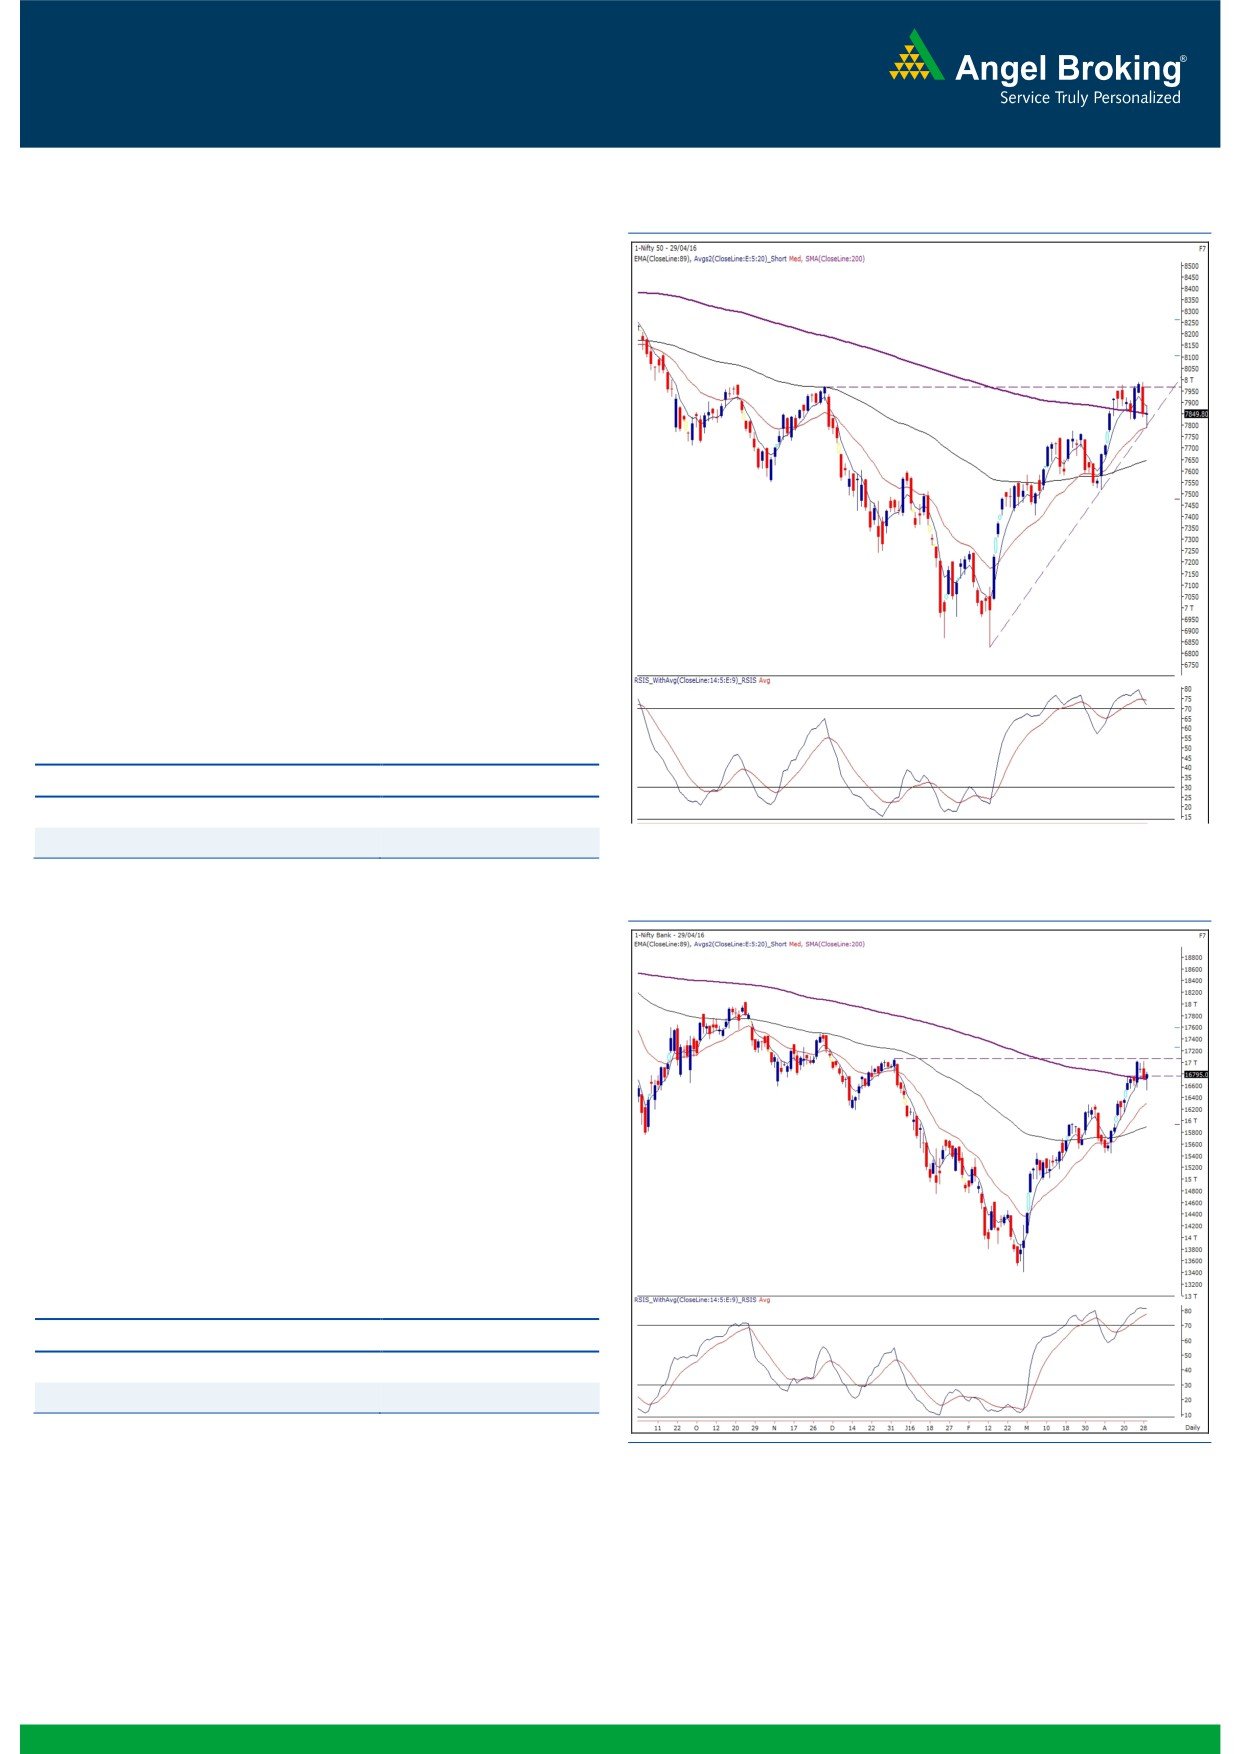
Exhibit 1: Nifty Daily Chart
The Nifty has been trading within a range of 200 points in the
past two consecutive weeks and it has now reached the lower end
of the range. The range of 7800 - 7750 coincides with multiple
technical evidences, namely, the daily ’20 EMA’, ‘Parabolic SAR’
indicator and an ‘Upward Sloping Trend Line’. Hence, it could be
considered as a strong support zone to be relied on. If we go by
the ‘Trend is your Friend’ assumption, the recent down move
should be construed as a pull back towards the support zone. As
long as the Nifty manages to hold these important supports, the
possibility of it surpassing the 8000 mark increases while the
7750 mark on the downside should be seen as a trend deciding
level in the near term. A sustainable move below this level could
possibly accelerate the ongoing downward momentum and the
correction could then extend till 7600 - 7516 levels. We suggest
one should now look for buying opportunities, invariably backing
up trades with strict stop losses, given that the Nifty has a strong
support at 7750.
Key Levels
Support 1 - 7800
Resistance 1 - 7910
Support 2 - 7750
Resistance 2 - 7950
Exhibit 2: Nifty Bank Daily Chart
Nifty Bank Outlook - (16795)
On Friday the Nifty Bank index traded in a narrow range and
ended the session with marginal gains of 0.47 percent.
The near term trend of the index continues to be positive as it has
been forming higher top higher bottom. However, the RSI is
showing initial signs of negative crossover from its average after
reaching the overbought zone. This is a sign of cautious, though,
it needs to be confirmed with correction in price. Unless any
reversal seen, traders are advised to continue to trade in direction
of the trend and focus on stock specific trades at the moment. The
intraday support in the index are placed around 16572 and
16450 whereas resistances are seen around 16900 and 17030.
Key Levels
Support 1 - 16572
Resistance 1 - 16900
Support 2 - 16450
Resistance 2 - 17030
1
Technical & Derivatives Report
May 02, 2016
Comments
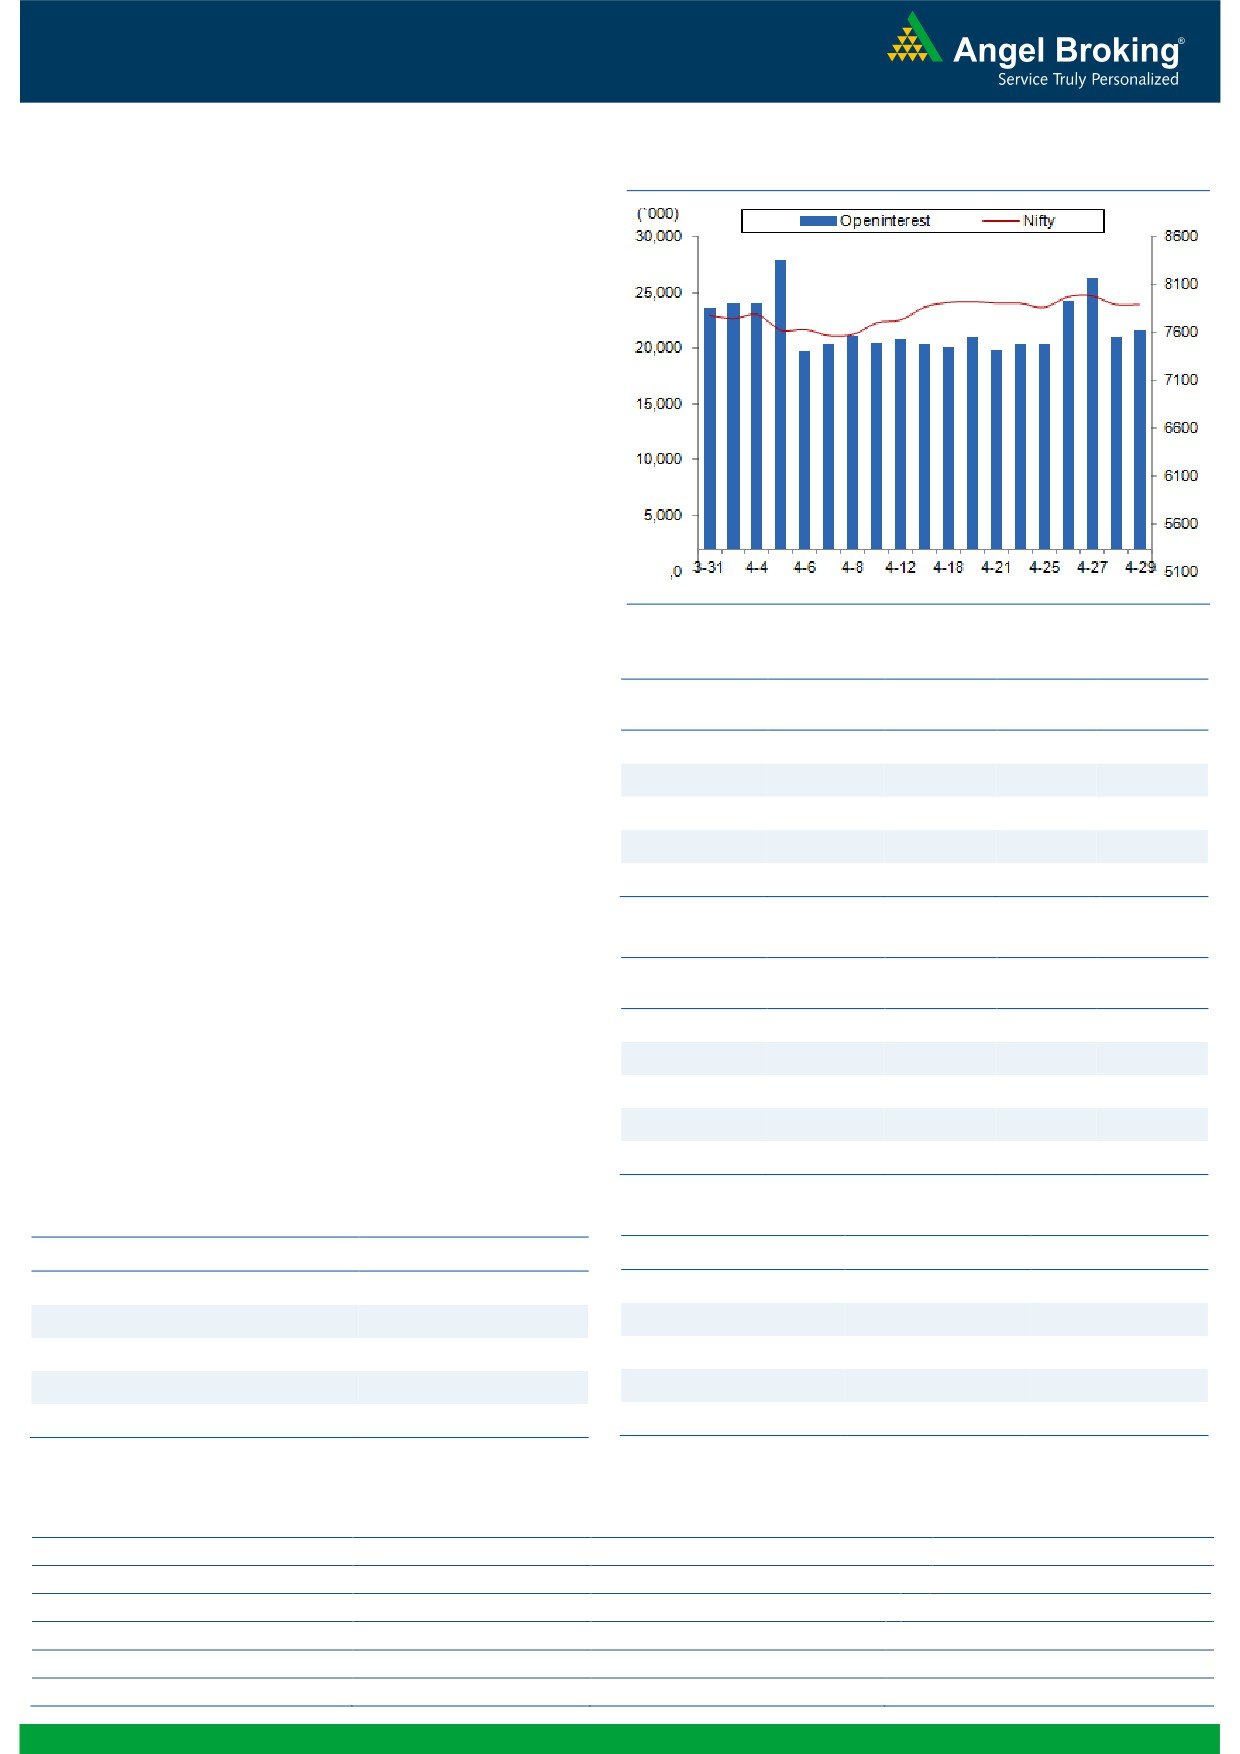
Nifty Vs OI
The Nifty futures open interest has increased by 3.23%
BankNifty futures open interest has increased by 9.13%
as market closed at 7849.80 levels.
The Nifty May future closed at a premium of 45.00
points against a premium of 48.05 points. The June
series closed at a premium of 57.80 points.
The Implied Volatility of at the money options has
decreased from 15.31% to 15.03%.
The total OI of the market is Rs. 2,54,423/- cr. and the
stock futures OI is Rs. 64,842/- cr.
Few of the liquid counters where we have seen high cost
of carry are NHPC, GMRINFRA, UNITECH, ICIL and
INDIACEM.
Views
FIIs were net sellers in both cash market segment and in
OI Gainers
Index Futures. They sold equities to the tune of Rs. 205
OI
PRICE
SCRIP
OI
PRICE
crores. While in Index Futures they sold of Rs. 268 crores
CHG. (%)
CHG. (%)
HCLTECH
9436300
33.11
750.30
-6.25
with rise in OI, which suggests fresh short formation in
last trading session.
NCC
10368000
17.07
78.10
-0.69
BIOCON
2843500
15.61
585.40
2.49
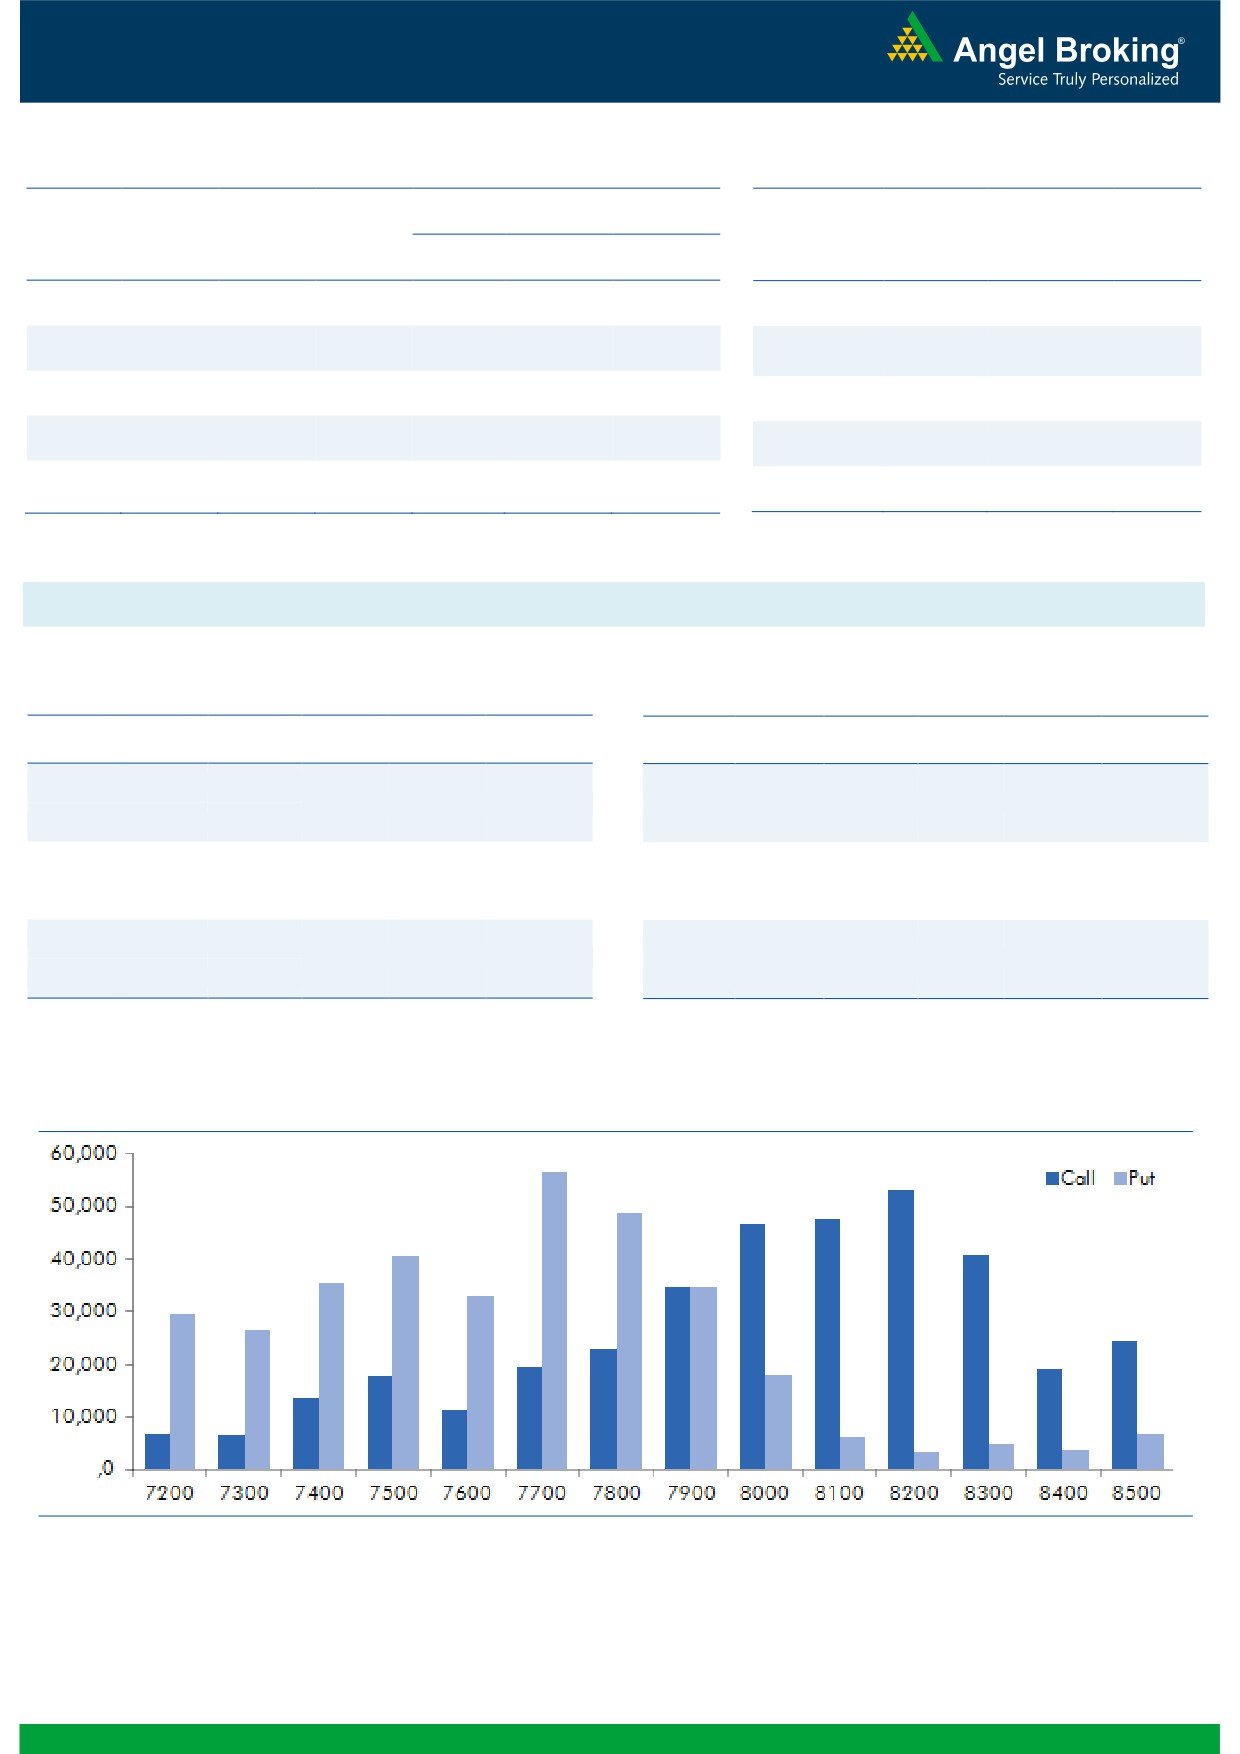
In Index Options front, FIIs bought significantly of worth
ARVIND
3940600
15.15
277.35
-1.60
Rs. 2411 crores with meaningful rise in OI. In call
CEATLTD
1880200
14.59
1098.60
-8.06
options, 7900-8200 strikes were active and they also
added good amount of open interest. On the other hand
in put options, unexpectedly deep out the money puts,
OI Losers
7200-7400 strikes added fresh build-up. Some OI
OI
PRICE
SCRIP
OI
PRICE
addition was also visible in 7800 put options. Maximum
CHG. (%)
CHG. (%)
NHPC
64638000
-8.06
20.65
-0.95
OI in May series is visible in 8200 call and 7700 put
options. After long time we are witnessing selling in both
CUMMINSIND
216600
-4.75
885.15
2.61
cash and Index Futures, at the same time out the money
M&MFIN
9826000
-4.01
300.00
0.47
puts are also adding decent build-up. Seeing this data,
SUNTV
3074000
-3.76
372.45
5.08
we would suggest trader to trade light as of now.
UNIONBANK
11631000
-3.70
127.40
-0.19
Historical Volatility
Put-Call Ratio
SCRIP
HV
SCRIP
PCR-OI
PCR-VOL
HCLTECH
42.19
NIFTY
0.94
1.01
IDEA
63.33
BANKNIFTY
0.87
0.91
CEATLTD
59.97
SBIN
0.57
0.51
BATAINDIA
37.41
ICICIBANK
0.72
0.82
SUNTV
37.24
RELIANCE
0.42
0.44
Strategy Date
Symbol
Strategy
Status
2
Technical & Derivatives Report
May 02, 2016
FII Statistics for 29-April 2016
Turnover on 29-April 2016
Open Interest
No. of
Turnover
Change
Detail
Buy
Sell
Net
Instrument
Value
Contracts
( in Cr. )
(%)
Contracts
Change (%)
(in Cr.)
INDEX
INDEX
1510.88
1779.13
(268.24)
295615
17158.87
0.92
384384
21244.16
-41.05
FUTURES
FUTURES
INDEX
INDEX
32595.50
30184.74
2410.76
774221
45378.88
12.71
2656119
155111.20
-75.56
OPTIONS
OPTIONS
STOCK
4621.36
5230.68
(609.32)
948186
45903.27
2.37
STOCK
FUTURES
647638
31947.78
-58.76
FUTURES
STOCK
STOCK
3091.79
3013.68
78.11
23002
1140.86
1404.38
OPTIONS
320727
15808.92
-41.93
OPTIONS
TOTAL
41819.53
40208.23
1611.30
2041024
109581.88
7.00
TOTAL
4008868
224112.07
-71.10
Nifty Spot = 7849.80
Lot Size = 75
Bull-Call Spreads
Bear-Put Spreads
Action
Strike
Price
Risk
Reward
BEP
Action
Strike
Price
Risk
Reward
BEP
Buy
7900
123.70
Buy
7900
130.20
44.60
55.40
7944.60
39.35
60.65
7860.65
Sell
8000
79.10
Sell
7800
90.85
Buy
7900
123.70
Buy
7900
130.20
76.40
123.60
7976.40
67.35
132.65
7832.65
Sell
8100
47.30
Sell
7700
62.85
Buy
8000
79.10
Buy
7800
90.85
31.80
68.20
8031.80
28.00
72.00
7772.00
Sell
8100
47.30
Sell
7700
62.85
Note: Above mentioned Bullish or Bearish Spreads in Nifty (May Series) are given as an information and not as a recommendation.
Nifty Put-Call Analysis
3
Technical & Derivatives Report
May 02, 2016
Daily Pivot Levels for Nifty Constituents
Scrips
S2
S1
PIVOT
R1
R2
ACC
1,414
1,428
1,444
1,458
1,474
ADANIPORTS
230
234
237
241
244
AMBUJACEM
217
219
222
224
227
ASIANPAINT
854
860
868
874
882
AUROPHARMA
744
752
763
772
783
AXISBANK
459
466
472
478
484
BAJAJ-AUTO
2,447
2,470
2,485
2,508
2,523
BANKBARODA
148
153
158
162
167
BHEL
121
123
125
127
129
BPCL
952
965
973
986
995
BHARTIARTL
353
359
366
371
378
INFRATEL
362
369
372
379
383
BOSCH
19,215
19,439
19,770
19,994
20,324
CIPLA
523
531
534
542
546
COALINDIA
282
285
287
290
293
DRREDDY
3,047
3,068
3,088
3,109
3,129
EICHERMOT
19,752
19,893
20,092
20,233
20,431
GAIL
350
355
361
366
372
GRASIM
4,014
4,050
4,091
4,128
4,169
HCLTECH
717
734
764
780
811
HDFCBANK
1,095
1,114
1,125
1,144
1,155
HDFC
1,060
1,074
1,088
1,102
1,116
HEROMOTOCO
2,825
2,861
2,888
2,924
2,951
HINDALCO
91
94
96
99
102
HINDUNILVR
849
858
869
878
889
ICICIBANK
224
231
238
244
251
IDEA
110
114
120
124
129
INDUSINDBK
1,017
1,033
1,043
1,059
1,070
INFY
1,194
1,201
1,212
1,219
1,231
ITC
318
321
324
327
330
KOTAKBANK
687
702
711
726
735
LT
1,235
1,245
1,255
1,265
1,276
LUPIN
1,549
1,578
1,598
1,627
1,647
M&M
1,304
1,318
1,332
1,345
1,359
MARUTI
3,685
3,740
3,780
3,835
3,875
NTPC
134
137
139
141
143
ONGC
213
215
218
220
223
POWERGRID
139
141
143
145
146
RELIANCE
967
975
987
995
1,006
SBIN
182
186
190
193
197
SUNPHARMA
798
804
809
816
820
TCS
2,497
2,516
2,529
2,548
2,561
TATAMTRDVR
289
293
299
304
310
TATAMOTORS
398
403
408
414
419
TATAPOWER
67
69
70
72
73
TATASTEEL
338
345
349
356
360
TECHM
470
477
483
490
496
ULTRACEMCO
3,122
3,142
3,169
3,189
3,216
WIPRO
544
548
553
557
561
YESBANK
918
930
941
954
965
ZEEL
397
406
411
420
425
4
Technical & Derivatives Report
May 02, 2016
Research Team Tel: 022 - 39357800
For Technical Queries
For Derivatives Queries
DISCLAIMER
Angel Broking Private Limited (hereinafter referred to as “Angel”) is a registered Member of National Stock Exchange of India Limited,
Bombay Stock Exchange Limited and MCX Stock Exchange Limited. It is also registered as a Depository Participant with CDSL and
Portfolio Manager with SEBI. It also has registration with AMFI as a Mutual Fund Distributor. Angel Broking Private Limited is a
registered entity with SEBI for Research Analyst in terms of SEBI (Research Analyst) Regulations, 2014 vide registration number
INH000000164. Angel or its associates has not been debarred/ suspended by SEBI or any other regulatory authority for accessing
/dealing in securities Market. Angel or its associates including its relatives/analyst do not hold any financial interest/beneficial
ownership of more than 1% in the company covered by Analyst. Angel or its associates/analyst has not received any compensation /
managed or co-managed public offering of securities of the company covered by Analyst during the past twelve months. Angel/analyst
has not served as an officer, director or employee of company covered by Analyst and has not been engaged in market making activity
of the company covered by Analyst.
This document is solely for the personal information of the recipient, and must not be singularly used as the basis of any investment
decision. Nothing in this document should be construed as investment or financial advice. Each recipient of this document should
make such investigations as they deem necessary to arrive at an independent evaluation of an investment in the securities of the
companies referred to in this document (including the merits and risks involved), and should consult their own advisors to determine
the merits and risks of such an investment.
Reports based on technical and derivative analysis center on studying charts of a stock's price movement, outstanding positions and
trading volume, as opposed to focusing on a company's fundamentals and, as such, may not match with a report on a company's
fundamentals.
The information in this document has been printed on the basis of publicly available information, internal data and other reliable
sources believed to be true, but we do not represent that it is accurate or complete and it should not be relied on as such, as this
document is for general guidance only. Angel Broking Pvt. Limited or any of its affiliates/ group companies shall not be in any way
responsible for any loss or damage that may arise to any person from any inadvertent error in the information contained in this report.
Angel Broking Pvt. Limited has not independently verified all the information contained within this document. Accordingly, we cannot
testify, nor make any representation or warranty, express or implied, to the accuracy, contents or data contained within this document.
While Angel Broking Pvt. Limited endeavors to update on a reasonable basis the information discussed in this material, there may be
regulatory, compliance, or other reasons that prevent us from doing so.
This document is being supplied to you solely for your information, and its contents, information or data may not be reproduced,
redistributed or passed on, directly or indirectly.
Neither Angel Broking Pvt. Limited, nor its directors, employees or affiliates shall be liable for any loss or damage that may arise from
or in connection with the use of this information.
Note: Please refer to the important ‘Stock Holding Disclosure' report on the Angel website (Research Section). Also, please refer to the
latest update on respective stocks for the disclosure status in respect of those stocks. Angel Broking Pvt. Limited and its affiliates may
have investment positions in the stocks recommended in this report.
5