Technical & Derivatives Report
March 02, 2016
Sensex (23779) / Nifty (7222)
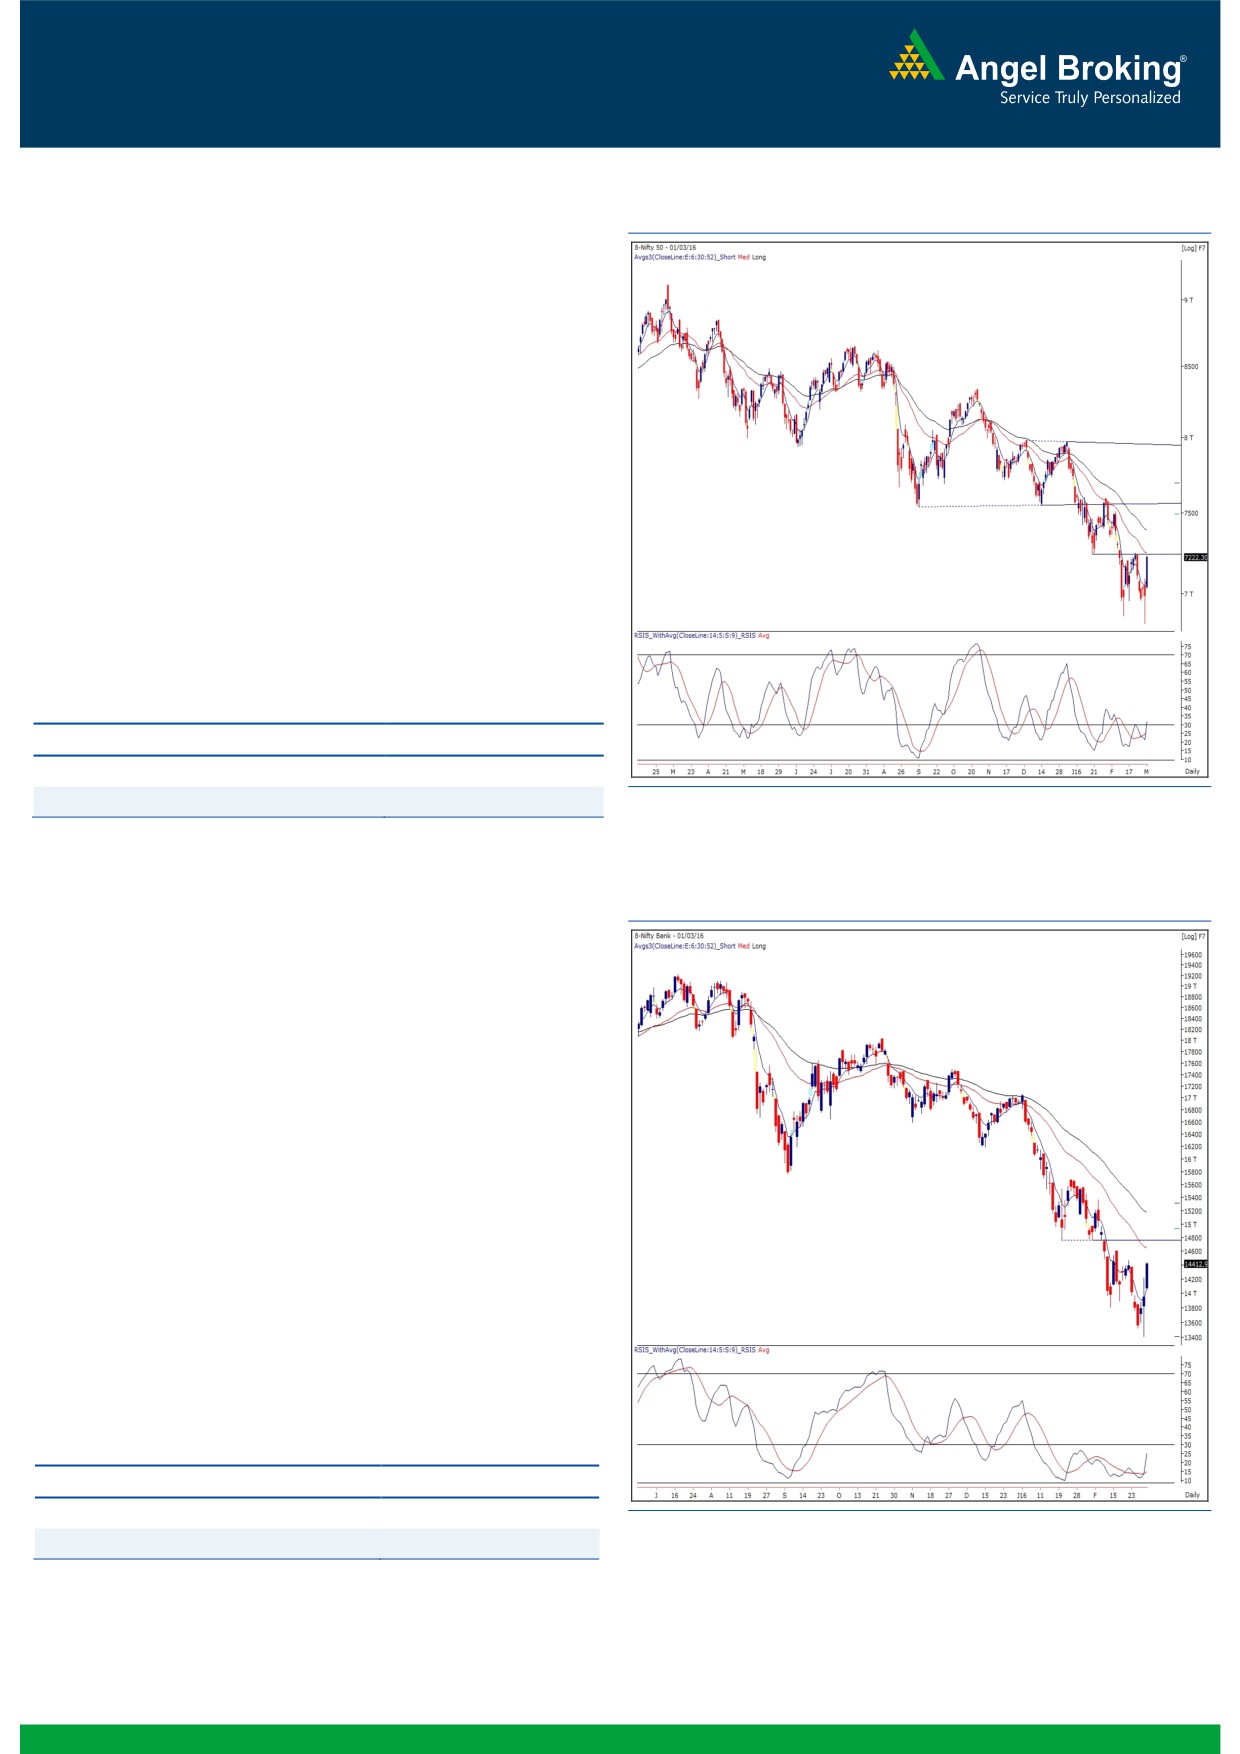
Exhibit 1: Nifty Daily Chart
After witnessing a see-saw ride on ‘Union Budget Day’, our
benchmark index opened on a cheerful note. The optimism
accelerated in the initial hour and as a result, the Nifty went
on thrash previous day’s high of 7094.60 with an ease. This
positive development provided impetus to broad based rally
throughout the session. As a result, the Nifty managed to close
well above the 7200 mark by posting whopping single day
gains of 3.37 percent.
As discussed in the previous report, a positive divergence in
‘RSI-Smoothened’ oscillator on the daily chart certainly played
its part. Now, Nifty has confirmed a trend line breakout with a
strong daily closing above 7200. We expect this optimism to
continue beyond recent swing high of 7252. A next important
hurdle would be then seen at 7350. On the flipside, 7177 -
7094 would act as important support levels.
Key Levels
Support 1 - 7177
Resistance 1 - 7252
Support 2 - 7094
Resistance 2 -
7350
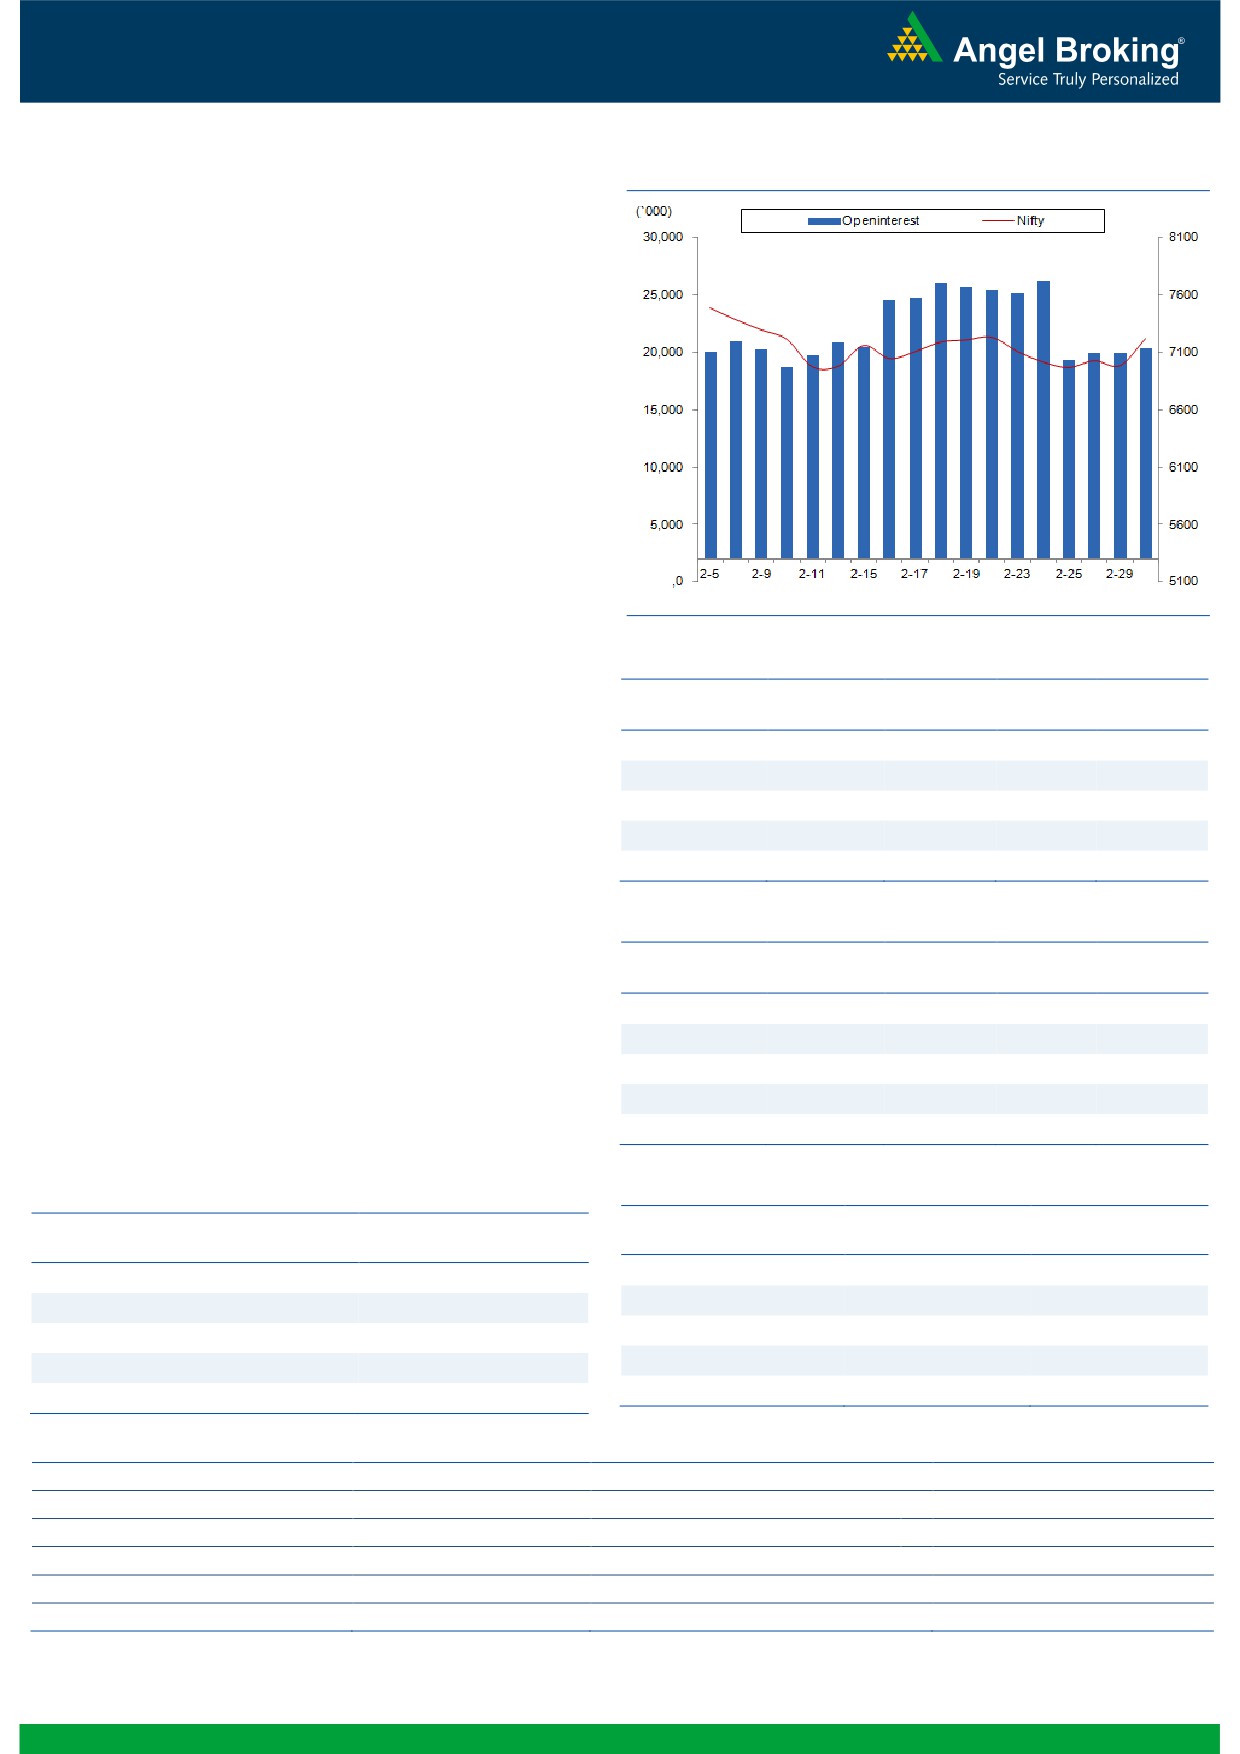
Exhibit 2: Bank Nifty Daily Chart
Bank Nifty Outlook - (14413)
The Nifty Bank index opened on a positive note yesterday and
formed 'Higher Top Higher Bottom' throughout the session to
end the day with the huge gains of 3.34℅.
As we had mentioned in yesterday's report, the index had
formed a 'Spinning Top' candlestick pattern on Monday which
indicated indecisiveness amongst market participants.
Yesterday's upmove indicates that the buyers were more
aggressive post tug of war on Monday and this could lead to a
short term positive momentum. The private sector banks have
taken the lead and since they constitute major part of the Nifty
Bank index, we could see further upside in the index in near
term. Hence traders are advised to trade with positive bias
until any reversal signs seen on lower time frame charts. The
near term support for the index are placed around 14222 and
14060, whereas resistances are seen around 14600 and
14755.
Key Levels
Support 1 - 14222
Resistance 1 - 14600
Support 2 - 14060
Resistance 2 - 14755
1
Technical & Derivatives Report
March 02, 2016
Comments
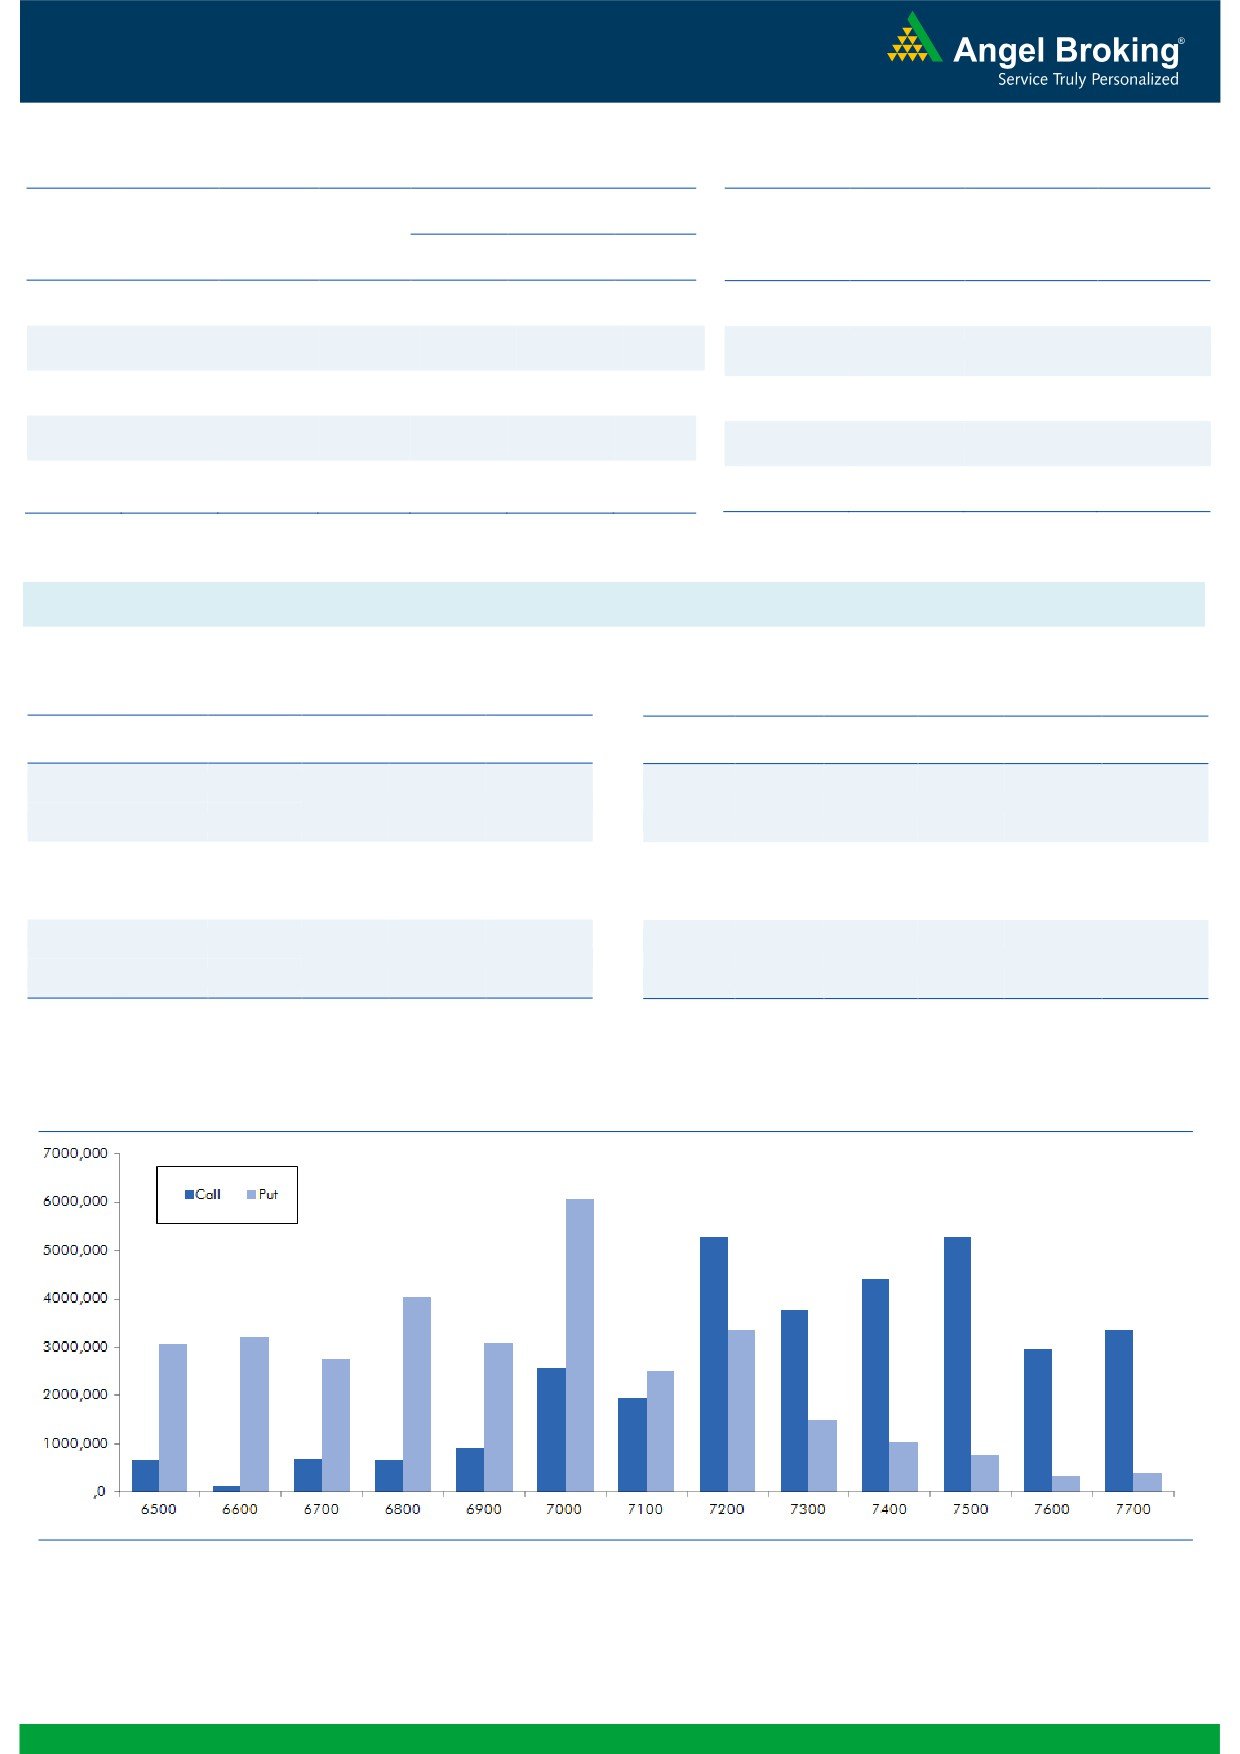
Nifty Vs OI
The Nifty futures open interest has increased by 3.34%
BankNifty futures open interest has increased by 2.61%
as market closed at 7222.30 levels.
The Nifty March future closed at a premium of 6.75
points against a premium of 21.90 points. The April
series closed at a premium of 32.90 points.
The Implied Volatility of at the money options has
decreased from 19.04% to 17.32%.
The total OI of the market is Rs. 1,89,767/- cr. and the
stock futures OI is Rs. 5,33,78/- cr.
Few of the liquid counters where we have seen high cost
of carry are JPASSOCIAT, UNITECH, IFCI, ADANIENT
and GMRINFRA.
Views
FIIs after long time have been net buyers in equity
OI Gainers
segment, they bought to the tune of Rs. 1760 crores.
OI
PRICE
SCRIP
OI
PRICE
While in Index Futures, they continue buying of Rs. 706
CHG. (%)
CHG. (%)
crores with decent rise in OI, suggesting fresh long
TATAELXSI
280500
51.79
1805.50
6.00
formation in yesterday’s trading session.
GRANULES
1160000
47.77
113.25
5.84
In Index Options front, FIIs bought sigfnificantly with
CUMMINSIND
60000
47.06
834.85
2.00
good amount of rise in OI. In call options, 7200 and
PCJEWELLER
1248000
39.94
324.80
3.51
7400 strikes were quite active and they also added freshng.com
ICIL
119500
26.46
898.55
7.98
build-up. We believe these OI addition in call options is
long formation expecting further strenght. Whereas, in
OI Losers
put options, 7000-7200 strikes added good amount of
OI
PRICE
SCRIP
OI
PRICE
fresh build-up, which may be lend of long and shorts.
CHG. (%)
CHG. (%)
Maximum OI in current series is visible in 7500 call and
POWERGRID
12496000
-8.74
133.90
2.37
7000 put options. From last three trading sessions, FIIs
KSCL
1469250
-6.67
361.80
2.43
have been net buyers in Index Futures, these is positive
GAIL
6223000
-6.62
321.70
5.03
sign. We believe Nifty may breach 7300-7350 levels,
IOC
6974400
-6.54
386.50
4.18
trade with a positive bias.
HAVELLS
2690000
-6.40
286.55
4.81
Historical Volatility
Put-Call Ratio
SCRIP
PCR-OI
PCR-VOL
SCRIP
HV
NIFTY
0.87
0.91
ITC
53.30
BANKNIFTY
1.00
0.79
HEROMOTOCO
46.06
SBIN
0.57
0.38
MARUTI
55.32
ITC
1.65
0.76
TCS
34.13
ICICIBANK
0.79
0.46
IBULHSGFIN
59.91
Strategy Date
Symbol
Strategy
Status
Feruary 29, 2016
RELIANCE
Ratio Bull Call Spread
Active
2
Technical & Derivatives Report
March 02, 2016
FII Statistics for 01-March 2016
Turnover on 01-March 2016
Open Interest
No. of
Turnover
Change
Detail
Buy
Sell
Net
Instrument
Value
Change
Contracts
( in Cr. )
(%)
Contracts
(in Cr.)
(%)
INDEX
INDEX
2916.29
2210.11
706.17
231519
11944.62
4.25
382343
19100.15
-42.92
FUTURES
FUTURES
INDEX
INDEX
36770.25
31952.76
4817.49
1056860
56768.65
11.74
3489649
183972.96
-39.44
OPTIONS
OPTIONS
STOCK
4201.18
3706.08
495.10
1090497
46782.48
0.44
STOCK
FUTURES
596703
25760.82
-21.37
FUTURES
STOCK
STOCK
1942.56
1808.32
134.24
39555
1655.01
36.52
OPTIONS
285397
12651.36
-19.58
OPTIONS
TOTAL
45830.28
39677.27
6153.01
2418431
117150.76
5.95
TOTAL
4754092
241485.29
-37.39
Nifty Spot = 7222.30
Lot Size = 75
Bull-Call Spreads
Bear-Put Spreads
Action
Strike
Price
Risk
Reward
BEP
Action
Strike
Price
Risk
Reward
BEP
Buy
7300
104.00
Buy
7200
127.85
38.90
61.10
7338.90
34.90
65.10
7165.10
Sell
7400
65.10
Sell
7100
92.95
Buy
7300
104.00
Buy
7200
127.85
65.50
134.50
7365.50
61.00
139.00
7139.00
Sell
7500
38.50
Sell
7000
66.85
Buy
7400
65.10
Buy
7100
92.95
26.60
73.40
7426.60
26.10
73.90
7073.90
Sell
7500
38.50
Sell
7000
66.85
Note: Above mentioned Bullish or Bearish Spreads in Nifty (March Series) are given as an information and not as a recommendation.
Nifty Put-Call Analysis
3
Technical & Derivatives Report
March 02, 2016
Daily Pivot Levels for Nifty 50 Stocks
Scrips
S2
S1
PIVOT
R1
R2
ACC
1,175
1,204
1,224
1,253
1,272
ADANIPORTS
192
200
204
211
215
AMBUJACEM
187
189
190
192
193
ASIANPAINT
841
856
866
881
890
AXISBANK
375
384
388
397
402
BAJAJ-AUTO
2,182
2,220
2,243
2,282
2,305
BANKBARODA
131
134
135
138
139
BHARTIARTL
306
313
318
325
330
BHEL
90
91
92
94
95
BOSCHLTD
16,570
16,797
16,968
17,195
17,366
BPCL
757
775
788
806
818
CAIRN
113
118
121
126
130
CIPLA
504
510
516
522
528
COALINDIA
306
312
315
321
325
DRREDDY
2,975
3,000
3,025
3,049
3,074
GAIL
296
309
316
329
336
GRASIM
3,259
3,342
3,394
3,477
3,529
HCLTECH
795
814
828
846
860
HDFC
1,037
1,053
1,063
1,080
1,090
HDFCBANK
966
975
981
990
996
HEROMOTOCO
2,443
2,555
2,618
2,731
2,794
HINDALCO
68
69
70
71
72
HINDUNILVR
812
818
824
830
836
ICICIBANK
191
198
202
209
213
IDEA
102
104
105
107
108
INDUSINDBK
821
841
854
874
888
INFY
1,081
1,103
1,117
1,139
1,152
ITC
297
311
319
333
341
KOTAKBANK
612
625
633
646
654
LT
1,063
1,094
1,111
1,142
1,159
LUPIN
1,713
1,737
1,760
1,784
1,806
M&M
1,180
1,224
1,252
1,296
1,324
MARUTI
3,093
3,294
3,402
3,603
3,711
NTPC
118
120
122
124
125
ONGC
186
189
191
194
197
PNB
71
72
73
74
75
POWERGRID
129
131
133
135
137
RELIANCE
957
969
977
989
997
SBIN
157
159
161
164
166
VEDL
69
72
74
77
79
SUNPHARMA
843
855
864
877
886
TATAMOTORS
295
305
311
321
327
TATAPOWER
56
57
58
59
60
TATASTEEL
242
250
254
261
266
TCS
2,118
2,197
2,241
2,321
2,364
TECHM
409
421
428
440
447
ULTRACEMCO
2,717
2,801
2,857
2,941
2,997
WIPRO
517
526
533
542
548
YESBANK
680
700
711
730
742
ZEEL
367
379
387
399
406
4
Technical & Derivatives Report
March 02, 2016
Research Team Tel: 022 - 39357800
For Technical Queries
For Derivatives Queries
DISCLAIMER
Angel Broking Private Limited (hereinafter referred to as “Angel”) is a registered Member of National Stock Exchange of India Limited,
Bombay Stock Exchange Limited and MCX Stock Exchange Limited. It is also registered as a Depository Participant with CDSL and
Portfolio Manager with SEBI. It also has registration with AMFI as a Mutual Fund Distributor. Angel Broking Private Limited is a
registered entity with SEBI for Research Analyst in terms of SEBI (Research Analyst) Regulations, 2014 vide registration number
INH000000164. Angel or its associates has not been debarred/ suspended by SEBI or any other regulatory authority for accessing
/dealing in securities Market. Angel or its associates including its relatives/analyst do not hold any financial interest/beneficial
ownership of more than 1% in the company covered by Analyst. Angel or its associates/analyst has not received any compensation /
managed or co-managed public offering of securities of the company covered by Analyst during the past twelve months. Angel/analyst
has not served as an officer, director or employee of company covered by Analyst and has not been engaged in market making activity
of the company covered by Analyst.
This document is solely for the personal information of the recipient, and must not be singularly used as the basis of any investment
decision. Nothing in this document should be construed as investment or financial advice. Each recipient of this document should
make such investigations as they deem necessary to arrive at an independent evaluation of an investment in the securities of the
companies referred to in this document (including the merits and risks involved), and should consult their own advisors to determine
the merits and risks of such an investment.
Reports based on technical and derivative analysis center on studying charts of a stock's price movement, outstanding positions and
trading volume, as opposed to focusing on a company's fundamentals and, as such, may not match with a report on a company's
fundamentals.
The information in this document has been printed on the basis of publicly available information, internal data and other reliable
sources believed to be true, but we do not represent that it is accurate or complete and it should not be relied on as such, as this
document is for general guidance only. Angel Broking Pvt. Limited or any of its affiliates/ group companies shall not be in any way
responsible for any loss or damage that may arise to any person from any inadvertent error in the information contained in this report.
Angel Broking Pvt. Limited has not independently verified all the information contained within this document. Accordingly, we cannot
testify, nor make any representation or warranty, express or implied, to the accuracy, contents or data contained within this document.
While Angel Broking Pvt. Limited endeavors to update on a reasonable basis the information discussed in this material, there may be
regulatory, compliance, or other reasons that prevent us from doing so.
This document is being supplied to you solely for your information, and its contents, information or data may not be reproduced,
redistributed or passed on, directly or indirectly.
Neither Angel Broking Pvt. Limited, nor its directors, employees or affiliates shall be liable for any loss or damage that may arise from
or in connection with the use of this information.
Note: Please refer to the important ‘Stock Holding Disclosure' report on the Angel website (Research Section). Also, please refer to the
latest update on respective stocks for the disclosure status in respect of those stocks. Angel Broking Pvt. Limited and its affiliates may
have investment positions in the stocks recommended in this report.
5