Technical & Derivatives Report
February 02, 2016
Sensex (24825) / Nifty (7556)
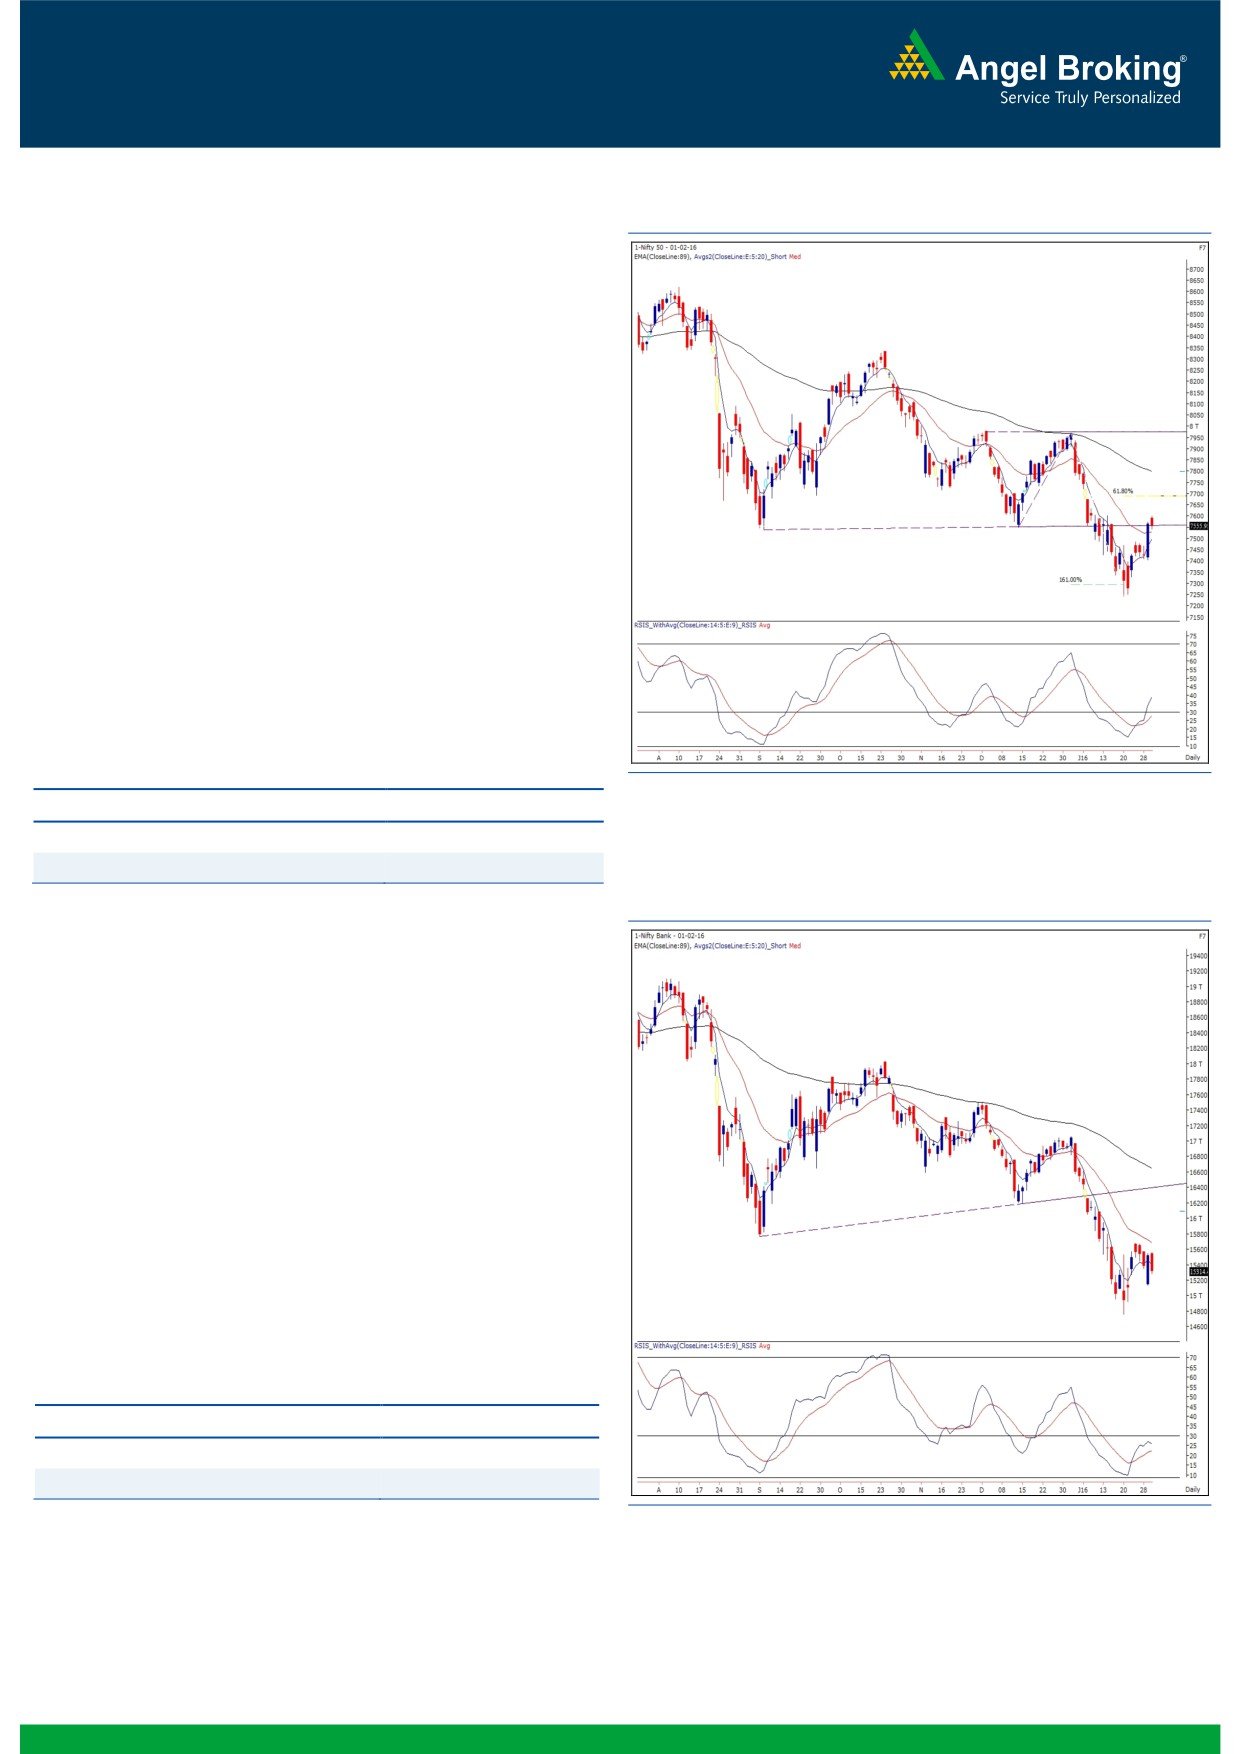
Exhibit 1: Nifty Daily Chart
Trading for the week began marginally higher owing to
positive cues from the US bourses on Friday. However, this
lead was very short lived as we witnessed a minor correction
from intraday high of 7600.45. The index remained very
range bound within a small band to conclude the day with
negligible loss.
Yesterday, the Nifty struggled to maintain its position above
the 7600 mark as some of the banking and automobiles
conglomerates started correcting ferociously in the first hour.
However, we saw lot of index balancing activity as some of
other heavyweights managed to soften this selling pressure. As
a result, the Nifty witnessed a minor cut to stay tad above the
7550 mark. We reiterate that the recent bounce is likely to
extend further towards
7650
-
7700 levels
(61.8%
retracement of the recent fall). On the flipside, the intraday
support levels are seen at 7530 - 7490. We maintain our view
that traders should refrain from shorting and rather, should
focus on stock specific ideas with a proper exit strategy.
Key Levels
Support 1 - 7530
Resistance 1 - 7650
Support 2 - 7490
Resistance 2 - 7700
Exhibit 2: Bank Nifty Daily Chart
Bank Nifty Outlook - (15315)
The Nifty Bank opened the week on a flat note and started
correcting from the initial trades. The fall accelerated as the
time progressed and as a result, the banking index continued
to make lower lows throughout the session. Eventually, the
Nifty Bank index underperformed the benchmark index by
giving a close with the loss of 1.34 percent over its previous
close.
Going forward, Friday’s low of 15136 would remain to be a
crucial support for the Nifty Bank index and a sustainable
move below this may drag the index towards
14900.
However, as of now, we rule out this possibility and instead,
expect the index to retest 15600 - 15700 levels. Considering
the ongoing volatility in the banking conglomerates, we advise
traders to trade with proper exit strategy to avoid losses.
Key Levels
Support 1 - 15136
Resistance 1 - 15600
Support 2 - 14900
Resistance 2 - 15700
1
Technical & Derivatives Report
February 02, 2016
Comments
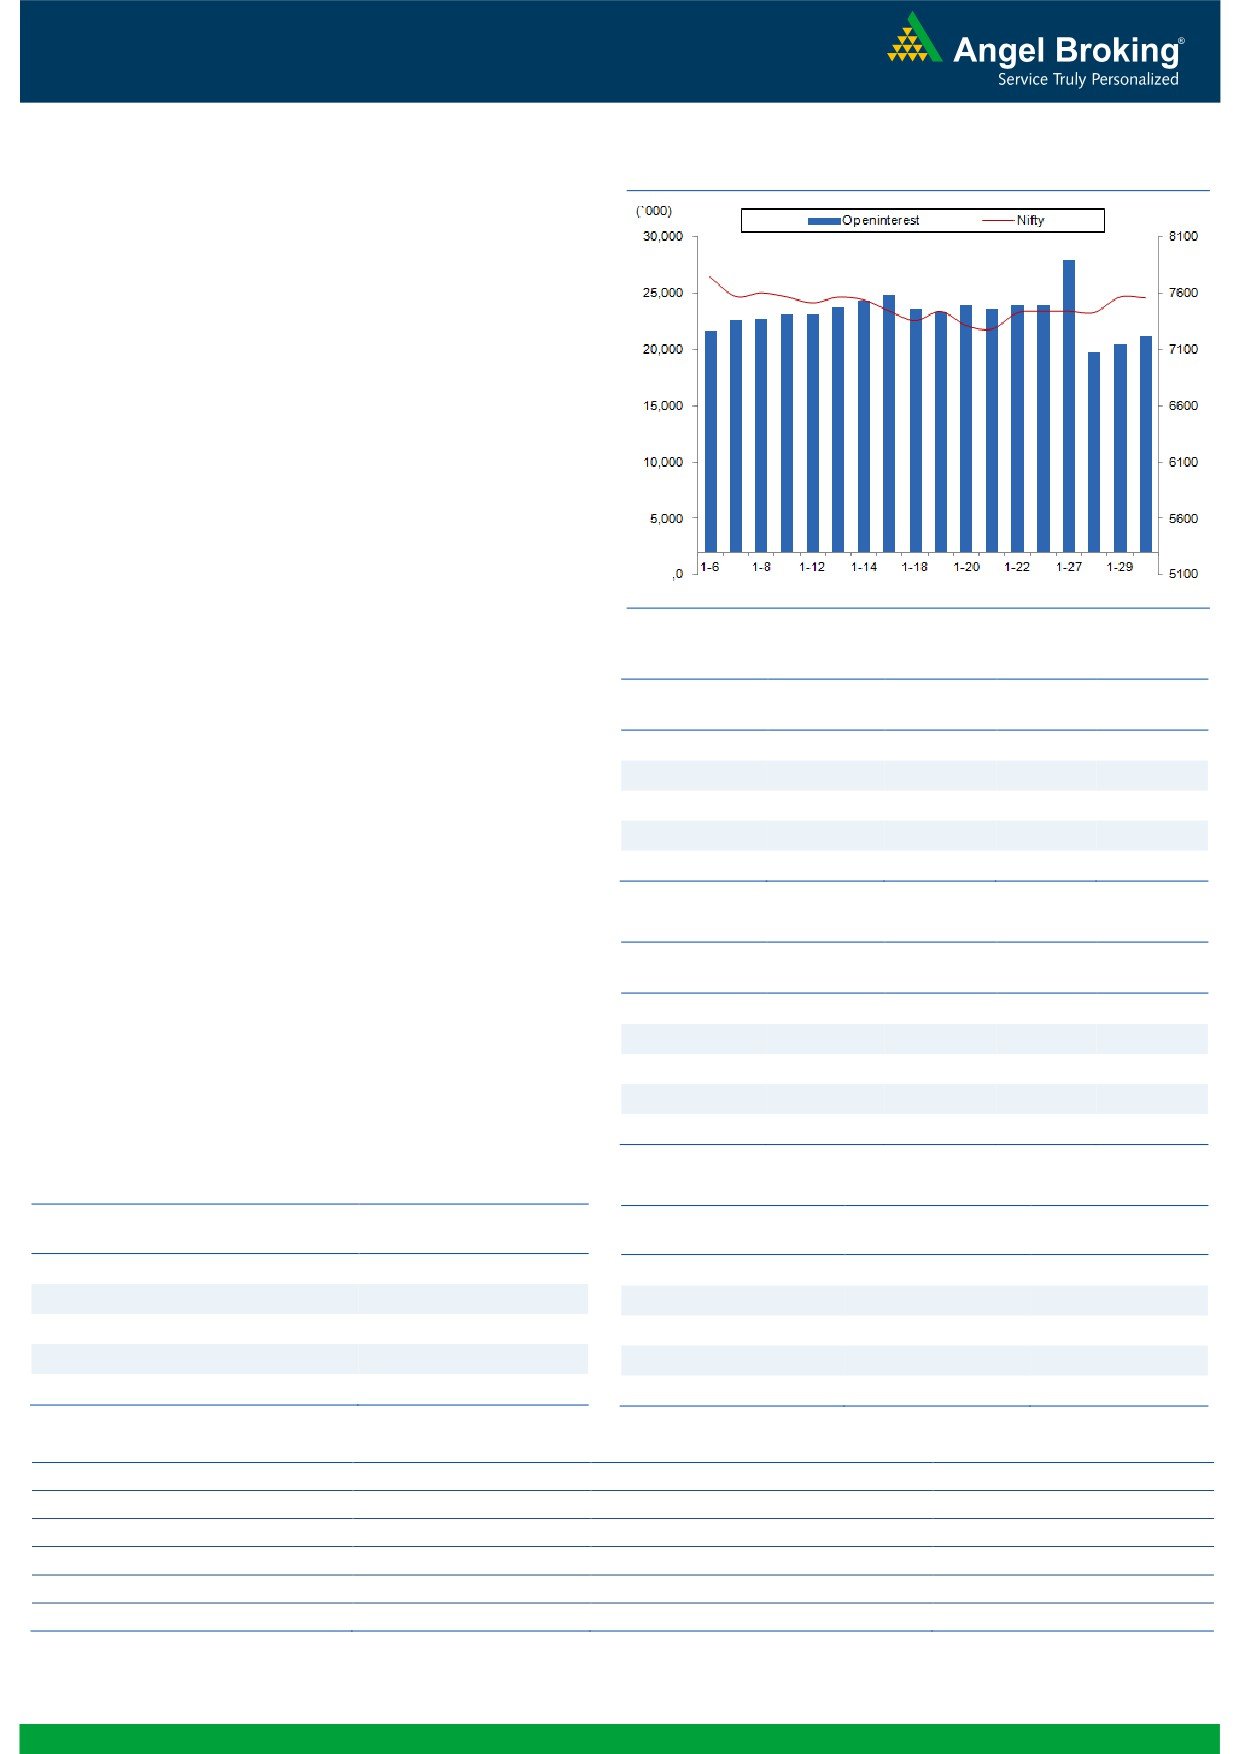
Nifty Vs OI
The Nifty futures open interest has increased by 3.71%
BankNifty futures open interest has increased by 11.41%
as market closed at 7555.95 levels.
The Nifty February future closed at a premium of 9.40
points against a premium of 4.50 points. The March
series closed at a premium of 23.55 points.
The Implied Volatility of at the money options has
increased from 15.10% to 15.70%.
The total OI of the market is Rs. 1,87,652/- cr. and the
stock futures OI is Rs. 59,655/- cr.
Few of the liquid counters where we have seen high cost
of carry are UNITECH, GMRINFRA, IDFC, DISHTV and
APOLLOTYRE.
OI Gainers
OI
PRICE
Views
SCRIP
OI
PRICE
CHG. (%)
CHG. (%)
After long time, FIIs were net buyers in both cash and
ACC
2661375
42.80
1268.45
2.16
Index Futures. They bought equities to the tune of Rs. 253
JUSTDIAL
3048500
28.52
563.45
-6.89
crores. While in Index Futures, they bought of worth Rs.
ENGINERSIN
5801400
21.97
192.00
-0.29
364 crores with good amount of rise in OI, indicating
TORNTPHARM
346400
13.95
1401.85
-0.08
long build-up in last trading session.
SYNDIBANK
10540000
13.64
63.60
-5.57
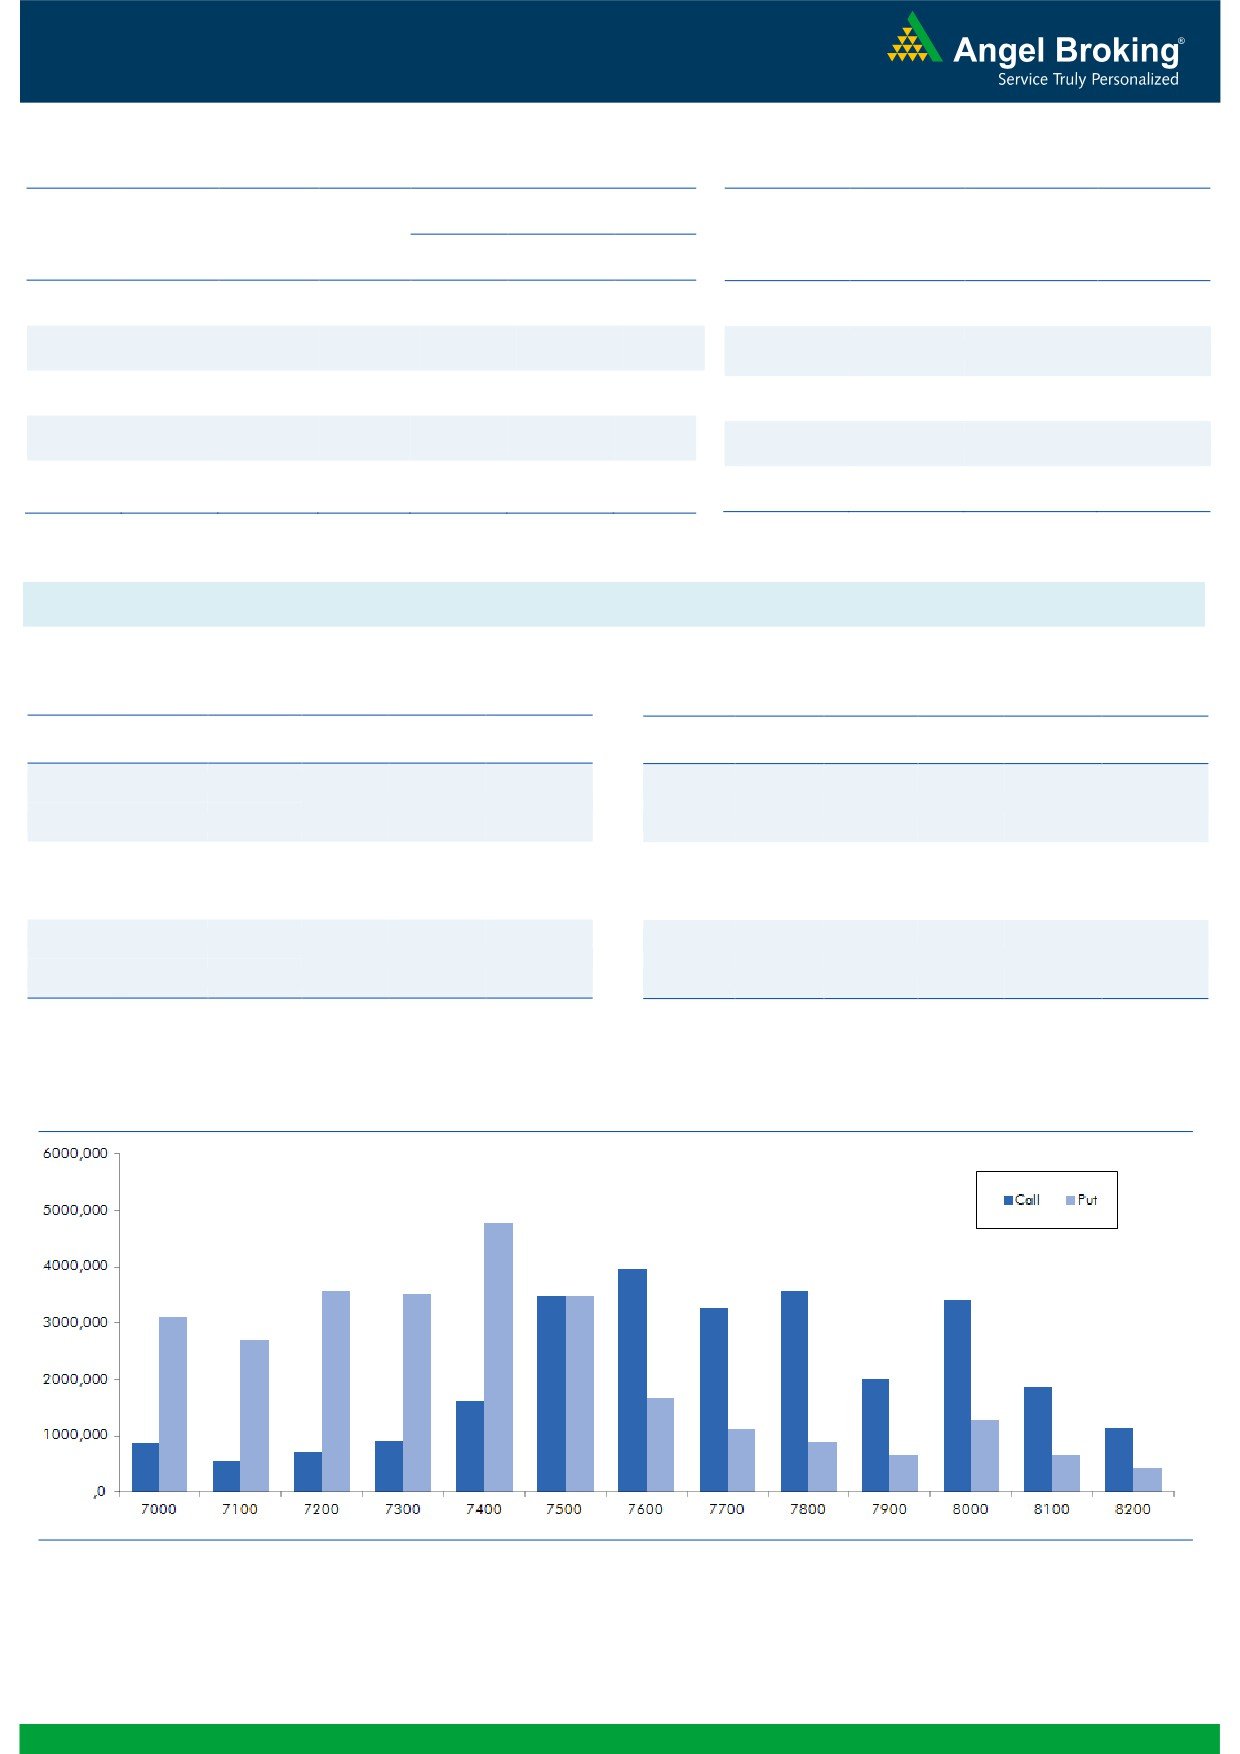
In Index Options front, FIIs were net buyers of Rs. 1996
crores with good amount of rise in OI. 7800 call and
OI Losers
7500 put option added decent build-up yesterday.
OI
PRICE
Maximum build-up in current series is now visible in
SCRIP
OI
PRICE
CHG. (%)
CHG. (%)
7600 call and 7400 put options. We are witnessing
YESBANK
14133700
-7.57
771.10
3.10
good amount of buying by FIIs, we would like to wait for
OIL
756000
-6.53
354.90
0.57
their further moves before forming any positions in Nifty.
CADILAHC
5937000
-5.38
319.00
4.37
Trade stock specific and be light in Nifty.
HEXAWARE
3340000
-4.24
230.80
0.61
MARICO
8455200
-4.10
223.70
0.56
Historical Volatility
Put-Call Ratio
SCRIP
HV
SCRIP
PCR-OI
PCR-VOL
KSCL
83.34
NIFTY
0.87
0.86
ICICIBANK
43.61
BANKNIFTY
0.92
0.79
BRITANNIA
33.63
LT
0.80
0.62
MARUTI
40.15
SBIN
0.58
0.44
AUROPHARMA
45.00
ICICIBANK
0.57
0.78
Strategy Date
Symbol
Strategy
Status
February 01, 2016
BHEL
Bull Call Spread
Active
2
Technical & Derivatives Report
February 02, 2016
FII Statistics for 01-February 2016
Turnover on 01-February 2016
Open Interest
No. of
Turnover
Change
Detail
Buy
Sell
Net
Instrument
Value
Change
Contracts
( in Cr. )
(%)
Contracts
(in Cr.)
(%)
INDEX
INDEX
1431.14
1066.19
364.94
221570
12045.80
3.90
234250
12233.81
-31.83
FUTURES
FUTURES
INDEX
INDEX
24667.45
22671.00
1996.45
977356
54794.31
8.99
1988416
111110.20
-13.52
OPTIONS
OPTIONS
STOCK
4114.42
3854.66
259.76
1067500
48363.23
2.85
STOCK
FUTURES
553477
25255.33
-22.00
FUTURES
STOCK
STOCK
2192.89
2160.02
32.86
34502
1543.61
27.97
OPTIONS
287902
13336.26
-13.51
OPTIONS
TOTAL
32405.89
29751.87
2654.02
2300928
116746.95
5.80
TOTAL
3064045
161935.60
-16.62
Nifty Spot = 7555.95
Lot Size = 75
Bull-Call Spreads
Bear-Put Spreads
Action
Strike
Price
Risk
Reward
BEP
Action
Strike
Price
Risk
Reward
BEP
Buy
7600
102.40
Buy
7500
98.60
43.35
56.65
7643.35
29.70
70.30
7470.30
Sell
7700
59.05
Sell
7400
68.90
Buy
7600
102.40
Buy
7500
98.60
71.90
128.10
7671.90
50.95
149.05
7449.05
Sell
7800
30.50
Sell
7300
47.65
Buy
7700
59.05
Buy
7400
68.90
28.55
71.45
7728.55
21.25
78.75
7378.75
Sell
7800
30.50
Sell
7300
47.65
Note: Above mentioned Bullish or Bearish Spreads in Nifty (Feb. Series) are given as an information and not as a recommendation.
Nifty Put-Call Analysis
3
Technical & Derivatives Report
February 02, 2016
Daily Pivot Levels for Nifty 50 Stocks
Scrips
S2
S1
PIVOT
R1
R2
ACC
1,225
1,248
1,264
1,287
1,302
ADANIPORTS
210
215
219
224
228
AMBUJACEM
193
197
199
202
204
ASIANPAINT
864
876
883
895
902
AXISBANK
386
392
401
408
417
BAJAJ-AUTO
2,281
2,305
2,333
2,357
2,385
BANKBARODA
118
120
123
126
129
BHARTIARTL
288
293
295
299
302
BHEL
132
136
141
145
149
BOSCHLTD
16,758
16,973
17,381
17,596
18,004
BPCL
860
870
882
892
903
CAIRN
121
123
124
126
127
CIPLA
581
590
598
607
615
COALINDIA
305
317
323
335
342
DRREDDY
2,980
3,015
3,077
3,112
3,173
GAIL
351
359
366
375
382
GRASIM
3,326
3,382
3,476
3,532
3,626
HCLTECH
855
867
879
892
903
HDFC
1,158
1,169
1,182
1,192
1,205
HDFCBANK
1,047
1,053
1,060
1,067
1,073
HEROMOTOCO
2,482
2,509
2,534
2,561
2,587
HINDALCO
70
70
71
72
72
HINDUNILVR
787
794
806
813
824
ICICIBANK
209
213
220
224
232
IDEA
102
104
105
106
107
INDUSINDBK
915
921
930
936
946
INFY
1,153
1,163
1,172
1,182
1,190
ITC
311
318
322
328
332
KOTAKBANK
675
681
686
693
698
LT
1,082
1,102
1,130
1,151
1,179
LUPIN
1,661
1,682
1,719
1,740
1,777
M&M
1,194
1,210
1,224
1,241
1,255
MARUTI
3,815
3,882
4,000
4,067
4,186
NTPC
137
139
141
143
146
ONGC
219
222
225
228
231
PNB
88
89
90
91
93
POWERGRID
145
146
147
148
149
RELIANCE
1,016
1,023
1,033
1,040
1,049
SBIN
166
169
176
179
185
VEDL
68
69
71
72
74
SUNPHARMA
848
860
874
886
901
TATAMOTORS
328
333
338
343
348
TATAPOWER
60
60
61
61
61
TATASTEEL
242
246
250
254
259
TCS
2,338
2,370
2,392
2,424
2,446
TECHM
482
490
504
512
526
ULTRACEMCO
2,769
2,794
2,827
2,853
2,886
WIPRO
550
559
566
576
583
YESBANK
733
753
764
784
796
ZEEL
405
411
417
422
428
4
Technical & Derivatives Report
February 02, 2016
Research Team Tel: 022 - 39357800
For Technical Queries
For Derivatives Queries
DISCLAIMER
Angel Broking Private Limited (hereinafter referred to as “Angel”) is a registered Member of National Stock Exchange of India Limited,
Bombay Stock Exchange Limited and MCX Stock Exchange Limited. It is also registered as a Depository Participant with CDSL and
Portfolio Manager with SEBI. It also has registration with AMFI as a Mutual Fund Distributor. Angel Broking Private Limited is a
registered entity with SEBI for Research Analyst in terms of SEBI (Research Analyst) Regulations, 2014 vide registration number
INH000000164. Angel or its associates has not been debarred/ suspended by SEBI or any other regulatory authority for accessing
/dealing in securities Market. Angel or its associates including its relatives/analyst do not hold any financial interest/beneficial
ownership of more than 1% in the company covered by Analyst. Angel or its associates/analyst has not received any compensation /
managed or co-managed public offering of securities of the company covered by Analyst during the past twelve months. Angel/analyst
has not served as an officer, director or employee of company covered by Analyst and has not been engaged in market making activity
of the company covered by Analyst.
This document is solely for the personal information of the recipient, and must not be singularly used as the basis of any investment
decision. Nothing in this document should be construed as investment or financial advice. Each recipient of this document should
make such investigations as they deem necessary to arrive at an independent evaluation of an investment in the securities of the
companies referred to in this document (including the merits and risks involved), and should consult their own advisors to determine
the merits and risks of such an investment.
Reports based on technical and derivative analysis center on studying charts of a stock's price movement, outstanding positions and
trading volume, as opposed to focusing on a company's fundamentals and, as such, may not match with a report on a company's
fundamentals.
The information in this document has been printed on the basis of publicly available information, internal data and other reliable
sources believed to be true, but we do not represent that it is accurate or complete and it should not be relied on as such, as this
document is for general guidance only. Angel Broking Pvt. Limited or any of its affiliates/ group companies shall not be in any way
responsible for any loss or damage that may arise to any person from any inadvertent error in the information contained in this report.
Angel Broking Pvt. Limited has not independently verified all the information contained within this document. Accordingly, we cannot
testify, nor make any representation or warranty, express or implied, to the accuracy, contents or data contained within this document.
While Angel Broking Pvt. Limited endeavors to update on a reasonable basis the information discussed in this material, there may be
regulatory, compliance, or other reasons that prevent us from doing so.
This document is being supplied to you solely for your information, and its contents, information or data may not be reproduced,
redistributed or passed on, directly or indirectly.
Neither Angel Broking Pvt. Limited, nor its directors, employees or affiliates shall be liable for any loss or damage that may arise from
or in connection with the use of this information.
Note: Please refer to the important ‘Stock Holding Disclosure' report on the Angel website (Research Section). Also, please refer to the
latest update on respective stocks for the disclosure status in respect of those stocks. Angel Broking Pvt. Limited and its affiliates may
have investment positions in the stocks recommended in this report.
5