Technical & Derivatives Report
December 01, 2016
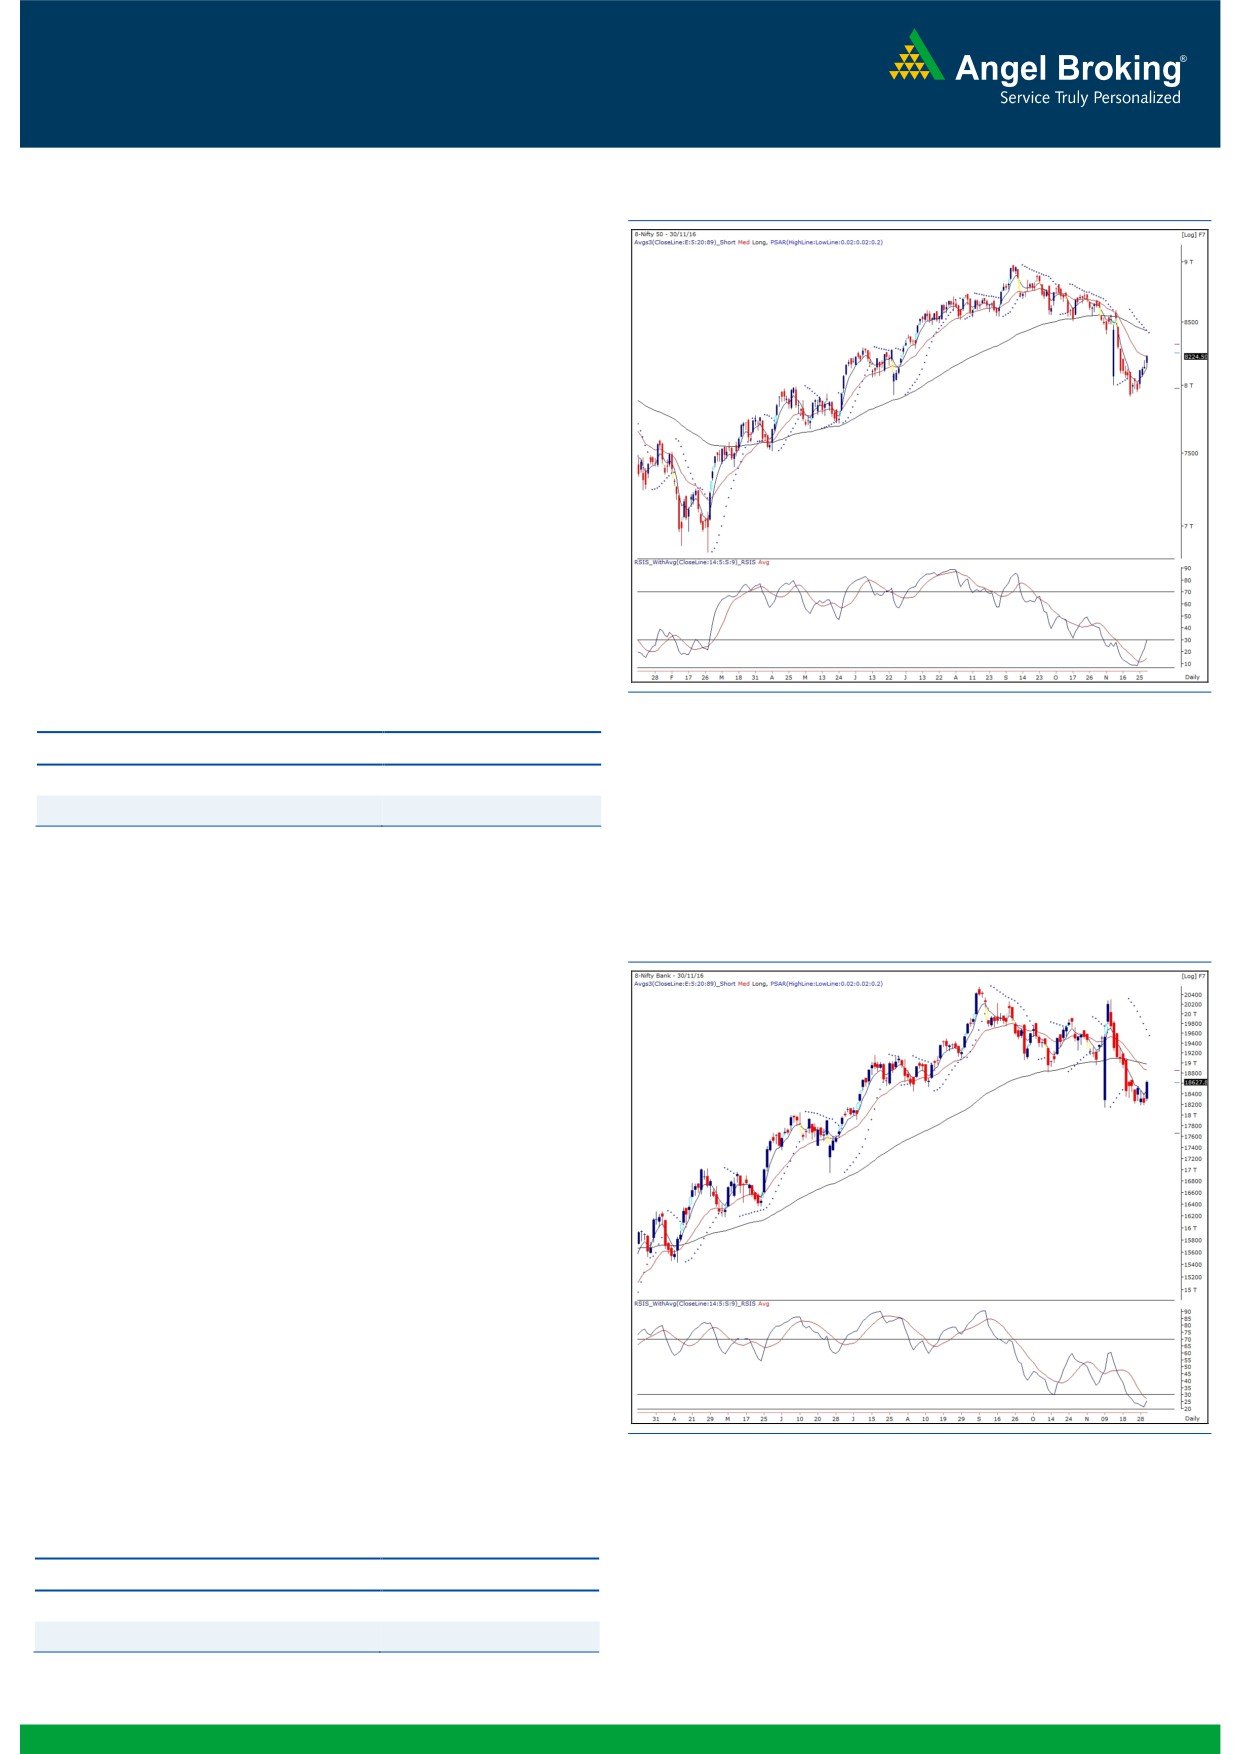
Sensex (26653) / Nifty (8225)
Exhibit 1: Nifty Daily Chart
Yesterday's session opened tad higher owing to positive global
cues. Subsequently, we saw a bit of tussle between market
participants during the first half. However, a sharp up move in
banking conglomerates during the second half propelled a strong
rally in our benchmark index to close convincingly above the
8200 mark.
The move has been very much on our expected lines as we have
been quite vocal on a probable bounce since last 4 - 5 trading
sessions. We expect this bounce back to extend towards 8250 -
8300 levels; whereas on the lower side, 8180 - 8150 would now
act as a strong support zone for the market. Going forward, we
expect stock specific bounce to continue in the market and hence,
traders should look for a buying opportunity in individual stocks
that have hammered down in the recent past and are trading
around their strong supports.
Key Levels
Support 1 - 8180
Resistance 1 - 8250
Support 2 - 8150
Resistance 2 - 8300
Nifty Bank Outlook - (18628)
Exhibit 2: Nifty Bank Daily Chart
Yesterday, the Nifty Bank index opened with marginal gains and
started moving higher from initial trades. Due to strong
momentum in banking heavyweights, the Nifty Bank index
continued to make higher highs throughout the session.
Eventually, the index posted gains of 2.22 percent over its
previous session's close.
Since last few days, we have been mentioning about how the
‘5DEMA’ had acted as resistance in the recent corrective move in
the Nifty Bank index. In yesterday's session, the index crossed over
the mentioned average which led to a sustainable upmove during
the day. After 12 trading sessions the index has managed to close
firmly above the ‘5DEMA’. Also, the momentum readings on
lower time frame chart are indicating positive traction from the
oversold zone. This should lead to further upmove in the index
upto 18860 - 18980. Thus short term traders are advised to trade
with positive bias. The intraday supports for the index are placed
around 18450 and 18340 whereas resistances are seen around
18845 and 18960.
Key Levels
Support 1 - 18450
Resistance 1 - 18845
Support 2 - 18340
Resistance 2 - 18960
1
Technical & Derivatives Report
December 01, 2016
Comments
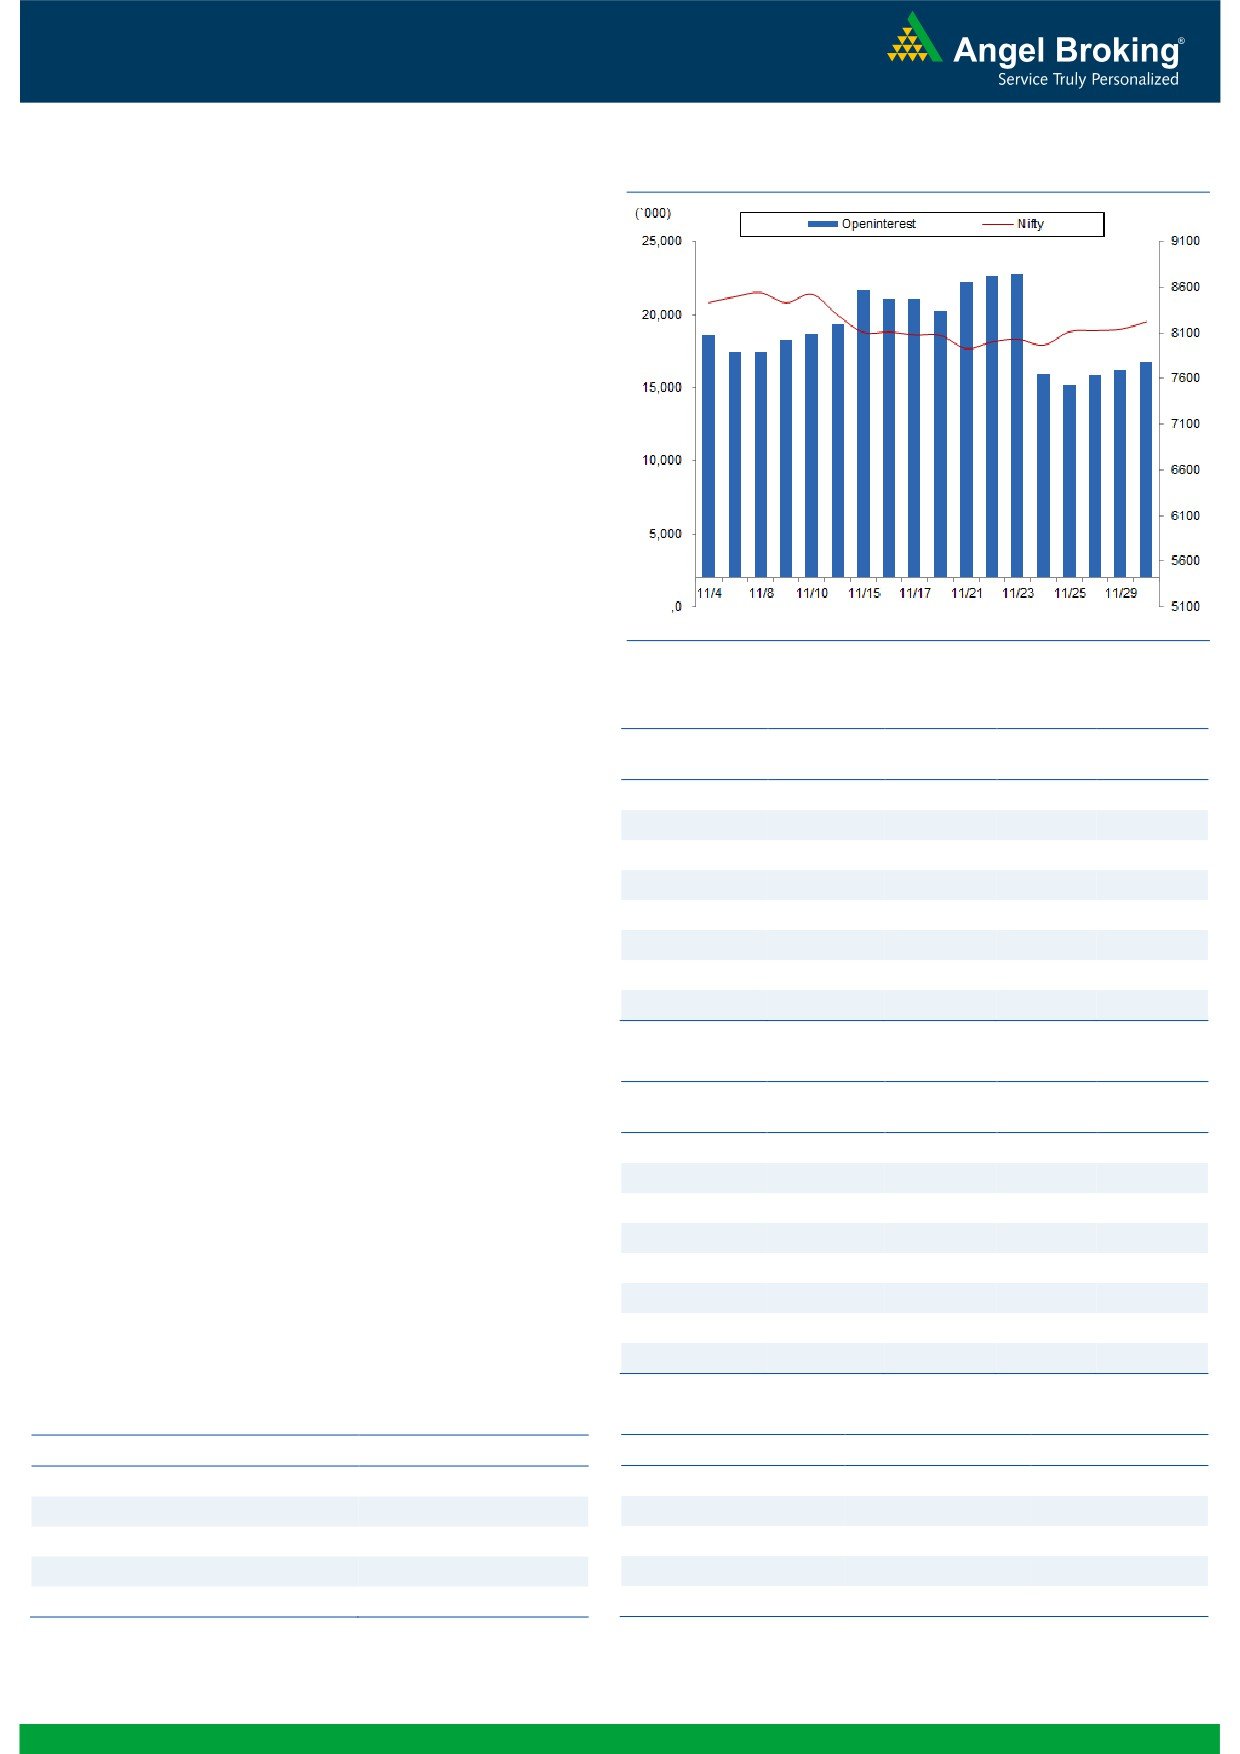
Nifty Vs OI
The Nifty futures open interest has increased by 3.61%
BankNifty futures open interest has decreased by 10.39%
as market closed at 8224.50 levels.
The Nifty December future closed with a premium of
35.85 against the premium of 29.90 points in last
trading session. The January series closed at a premium
of 70.10 points.
The Implied Volatility of at the money options has
decreased from 14.38% to 13.91%. At the same time,
the PCR-OI of Nifty has increased from 1.03 to 1.05
levels.
The total OI of the market is Rs. 2,30,457/- cr. and the
stock futures OI is Rs. 67,374/- cr.
Few of the liquid counters where we have seen high cost
of carry are CAIRN, MCLEODRUSS, SOUTHBANK, NCC
and ANDHRABANK.
OI Gainers
Views
OI
PRICE
FIIs continue selling in cash market segment to the tune
SCRIP
OI
PRICE
CHG. (%)
CHG. (%)
of Rs. 434 crores. While, in index futures, they were net
IDFCBANK
52232000
80.01
68.45
-3.46
buyers worth Rs. 659 crores with some rise in open
ULTRACEMCO
2469000
53.79
3588.15
1.79
interest, indicating fresh long formation.
TORNTPHARM
287200
30.07
1385.75
-1.28
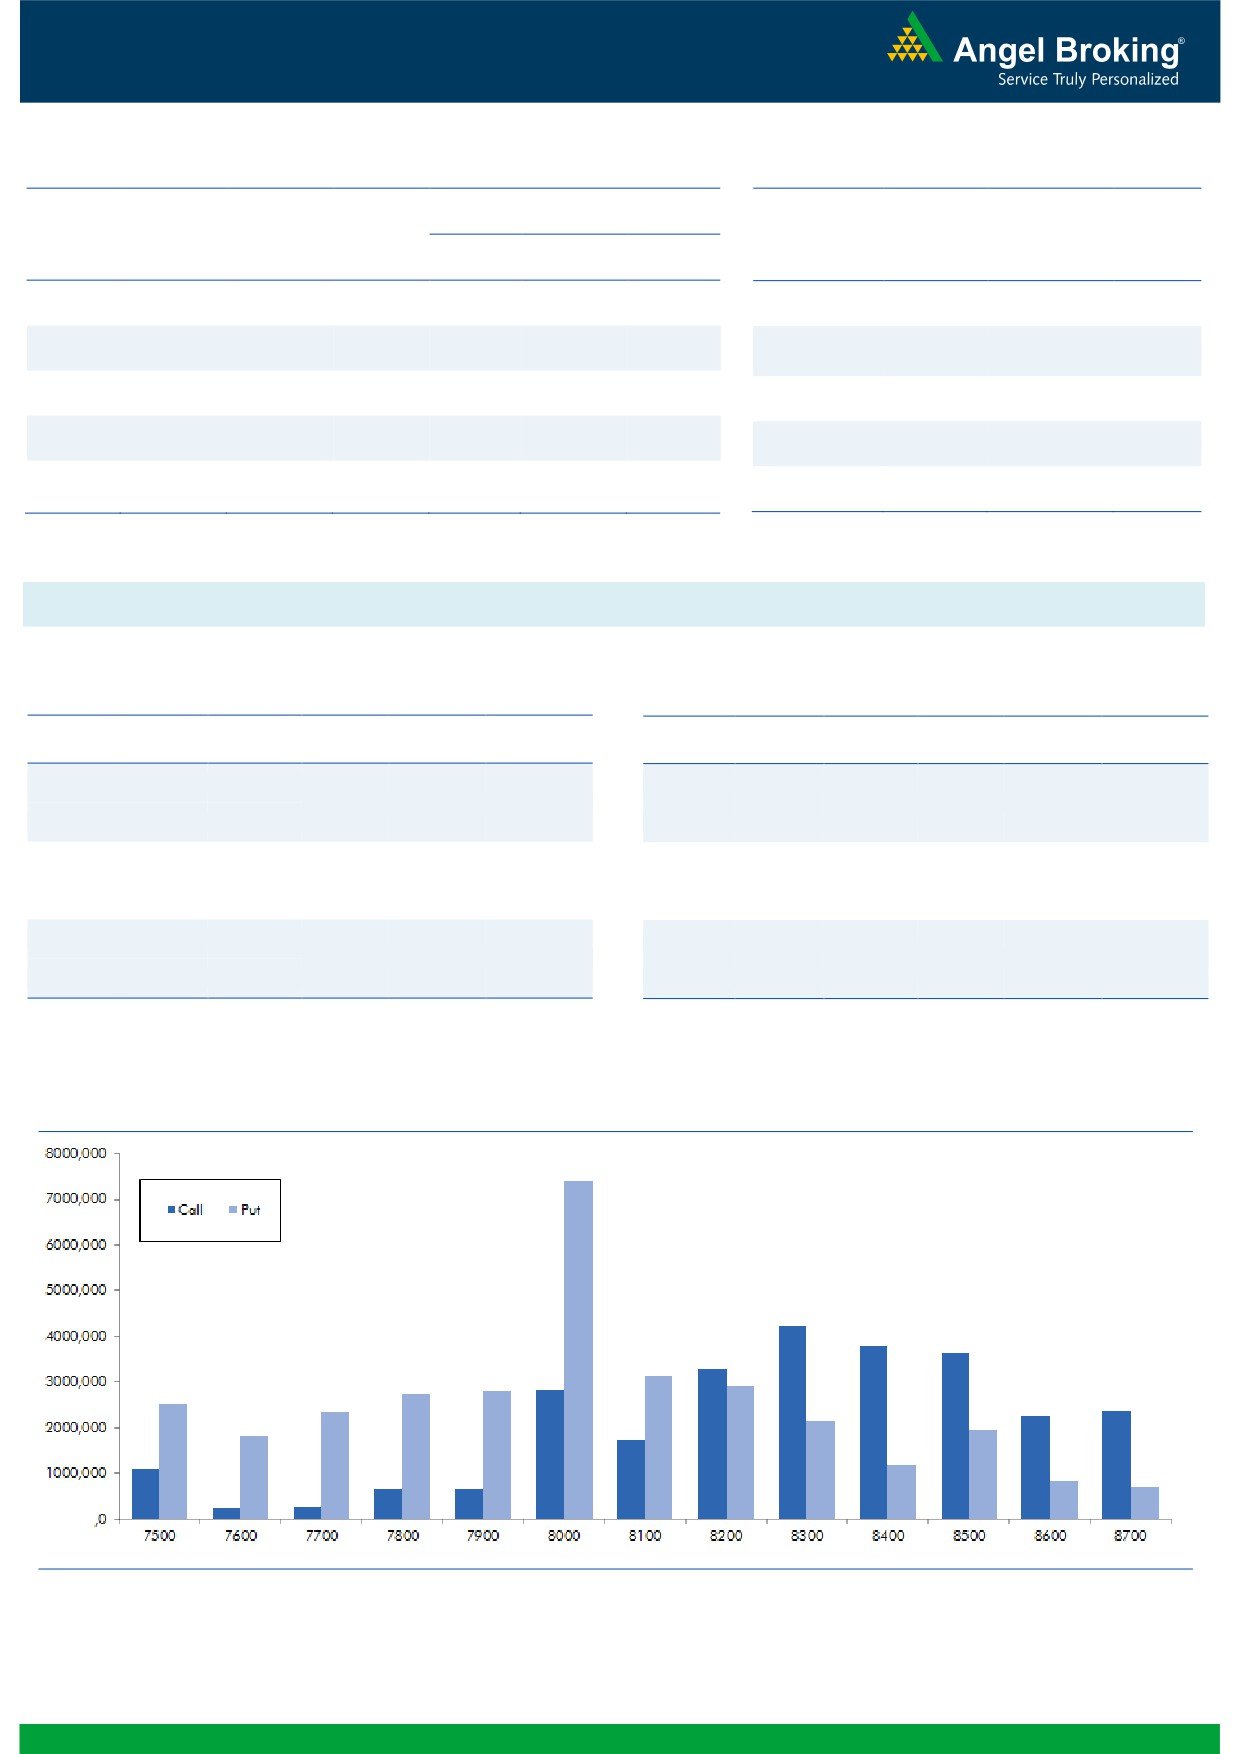
In Index options segment, FIIs were net buyers of Rs. 481ng.com
BPCL
14870400
29.79
642.70
-0.34
crores with rise in open interest. We hardly saw any
HINDPETRO
23889600
27.83
468.40
-1.54
meaningful build-up in options front. However, 8400 call
APOLLOHOSP
574000
25.55
1201.20
-2.23
and 8100 put options were comparatively active and
OIL
1317500
16.54
421.90
1.10
they also added some positions. Highest OI in December
MRF
28635
15.14
50196.90
1.94
series is visible in 8300 call and 8000 put option.
Since past two days, we are witnessing fresh long
OI Losers
formation in Index Futures by stronger hands. While, they
OI
PRICE
continue buying in stock futures too. Yesterday, banknifty
SCRIP
OI
PRICE
CHG. (%)
CHG. (%)
bounced due to good amount of short covering. While,
HDIL
23728000
-6.88
62.25
1.47
heavy weight counters like ICICIBANK, KOTAKBANK and
ICICIBANK
58857500
-6.58
266.10
3.66
HDFCBANK also showed decent amount short covering.
GODREJIND
1281000
-6.46
389.75
1.19
Large cap counters like ULTRACEMCO, ONGC,
DHFL
15153000
-4.97
257.00
1.90
EICHERMOT, ASIANPAINT and POWERGRID added
AMBUJACEM
12885000
-4.73
211.20
2.55
fresh longs. Thus, seeing the overall activity in Index and
TATAPOWER
20349000
-4.32
74.25
2.34
Stock Futures, we believe Nifty may continue to show
AMARAJABAT
564600
-4.18
943.85
1.29
strength. Hence, traders are suggested to trade with a
ORIENTBANK
13068000
-4.10
120.45
2.99
positive bias.
Historical Volatility
Put-Call Ratio
SCRIP
HV
SCRIP
PCR-OI
PCR-VOL
IBULHSGFIN
51.01
NIFTY
1.05
1.08
TVSMOTOR
43.25
BANKNIFTY
1.23
0.91
TORNTPOWER
34.93
SBIN
0.62
0.46
CEATLTD
53.90
RELIANCE
0.58
0.48
LT
24.39
MARUTI
1.32
0.68
2
Technical & Derivatives Report
December 01, 2016
FII Statistics for November 30, 2016
Turnover on November 30, 2016
Open Interest
No. of
Turnover
Change
Detail
Buy
Sell
Net
Instrument
Value
Change
Contracts
( in Cr. )
(%)
Contracts
(in Cr.)
(%)
INDEX
INDEX
2872.34
2213.79
658.55
171168
10917.20
2.83
254727
17047.55
22.27
FUTURES
FUTURES
INDEX
INDEX
32011.89
31530.98
480.91
934738
58676.42
3.18
4214418
296669.83
50.48
OPTIONS
OPTIONS
STOCK
7933.11
7562.29
370.82
844544
52214.43
2.91
STOCK
FUTURES
507839
34489.69
15.11
FUTURES
STOCK
STOCK
2485.32
2447.77
37.55
49748
3259.12
11.64
OPTIONS
221325
15572.94
4.40
OPTIONS
TOTAL
45302.66
43754.83
1547.83
2000198
125067.17
3.23
TOTAL
5198309
363780.01
42.12
Nifty Spot = 8224.50
Lot Size = 75
Bull-Call Spreads
Bear-Put Spreads
Action
Strike
Price
Risk
Reward
BEP
Action
Strike
Price
Risk
Reward
BEP
Buy
8300
105.90
Buy
8200
107.40
42.65
57.35
8342.65
28.60
71.40
8171.40
Sell
8400
63.25
Sell
8100
78.80
Buy
8300
105.90
Buy
8200
107.40
72.05
127.95
8372.05
49.75
150.25
8150.25
Sell
8500
33.85
Sell
8000
57.65
Buy
8400
63.25
Buy
8100
78.80
29.40
70.60
8429.40
21.15
78.85
8078.85
Sell
8500
33.85
Sell
8000
57.65
Note: Above mentioned Bullish or Bearish Spreads in Nifty (December Series) are given as an information and not as a recommendation.
Nifty Put-Call Analysis
3
Technical & Derivatives Report
December 01, 2016
Daily Pivot Levels for Nifty Constituents
Scrips
S2
S1
PIVOT
R1
R2
ACC
1,309
1,325
1,340
1,357
1,372
ADANIPORTS
273
275
279
281
284
AMBUJACEM
203
207
209
213
215
ASIANPAINT
943
957
966
979
988
AUROPHARMA
730
735
742
748
755
AXISBANK
459
464
468
473
477
BAJAJ-AUTO
2,654
2,669
2,680
2,695
2,706
BANKBARODA
160
162
163
166
167
BHEL
128
129
130
131
133
BPCL
628
636
644
651
659
BHARTIARTL
322
323
325
326
328
INFRATEL
353
364
371
382
389
BOSCH
19,989
20,257
20,418
20,686
20,847
CIPLA
558
562
568
572
578
COALINDIA
302
306
308
311
314
DRREDDY
3,158
3,178
3,198
3,217
3,237
EICHERMOT
20,857
21,239
21,505
21,886
22,152
GAIL
416
421
427
431
437
GRASIM
829
850
863
883
896
HCLTECH
792
798
804
810
817
HDFCBANK
1,173
1,186
1,194
1,207
1,215
HDFC
1,223
1,243
1,258
1,278
1,292
HEROMOTOCO
3,119
3,142
3,158
3,182
3,198
HINDALCO
170
173
176
179
182
HINDUNILVR
823
833
842
853
861
ICICIBANK
252
259
263
269
273
IDEA
75
76
78
79
81
INDUSINDBK
1,041
1,064
1,080
1,103
1,119
INFY
955
965
971
981
987
ITC
227
230
232
235
237
KOTAKBANK
732
744
752
764
772
LT
1,333
1,358
1,375
1,399
1,416
LUPIN
1,467
1,486
1,516
1,536
1,566
M&M
1,171
1,178
1,188
1,195
1,205
MARUTI
5,034
5,150
5,216
5,332
5,398
NTPC
161
162
163
164
165
ONGC
279
284
288
293
296
POWERGRID
186
189
191
194
196
RELIANCE
979
984
992
998
1,006
SBIN
250
254
257
261
265
SUNPHARMA
699
704
712
717
725
TCS
2,219
2,247
2,271
2,300
2,323
TATAMTRDVR
291
294
297
300
303
TATAMOTORS
451
455
459
464
468
TATAPOWER
70
72
73
75
77
TATASTEEL
400
408
412
419
423
TECHM
477
481
485
490
494
ULTRACEMCO
3,515
3,559
3,600
3,644
3,684
WIPRO
457
461
466
470
475
YESBANK
1,132
1,153
1,167
1,188
1,202
ZEEL
445
450
456
462
468
4
Technical & Derivatives Report
December 01, 2016
Research Team Tel: 022 - 39357800
For Technical Queries
For Derivatives Queries
DISCLAIMER
Angel Broking Private Limited (hereinafter referred to as “Angel”) is a registered Member of National Stock Exchange of India Limited,
Bombay Stock Exchange Limited and Metropolitan Stock Exchange Limited. It is also registered as a Depository Participant with CDSL
and Portfolio Manager with SEBI. It also has registration with AMFI as a Mutual Fund Distributor. Angel Broking Private Limited is a
registered entity with SEBI for Research Analyst in terms of SEBI (Research Analyst) Regulations, 2014 vide registration number
INH000000164. Angel or its associates has not been debarred/ suspended by SEBI or any other regulatory authority for accessing
/dealing in securities Market. Angel or its associates/analyst has not received any compensation / managed or co-managed public
offering of securities of the company covered by Analyst during the past twelve months.
This document is solely for the personal information of the recipient, and must not be singularly used as the basis of any investment
decision. Nothing in this document should be construed as investment or financial advice. Each recipient of this document should
make such investigations as they deem necessary to arrive at an independent evaluation of an investment in the securities of the
companies referred to in this document (including the merits and risks involved), and should consult their own advisors to determine
the merits and risks of such an investment.
Reports based on technical and derivative analysis center on studying charts of a stock's price movement, outstanding positions and
trading volume, as opposed to focusing on a company's fundamentals and, as such, may not match with a report on a company's
fundamentals. Investors are advised to refer the Fundamental and Technical Research Reports available on our website to evaluate the
contrary view, if any.
The information in this document has been printed on the basis of publicly available information, internal data and other reliable
sources believed to be true, but we do not represent that it is accurate or complete and it should not be relied on as such, as this
document is for general guidance only. Angel Broking Pvt. Limited or any of its affiliates/ group companies shall not be in any way
responsible for any loss or damage that may arise to any person from any inadvertent error in the information contained in this report.
Angel Broking Pvt. Limited has not independently verified all the information contained within this document. Accordingly, we cannot
testify, nor make any representation or warranty, express or implied, to the accuracy, contents or data contained within this document.
While Angel Broking Pvt. Limited endeavors to update on a reasonable basis the information discussed in this material, there may be
regulatory, compliance, or other reasons that prevent us from doing so.
This document is being supplied to you solely for your information, and its contents, information or data may not be reproduced,
redistributed or passed on, directly or indirectly.
Neither Angel Broking Pvt. Limited, nor its directors, employees or affiliates shall be liable for any loss or damage that may arise from
or in connection with the use of this information.
5