Technical & Derivatives Report
November 01, 2016
Sensex (27930) / Nifty (8625)
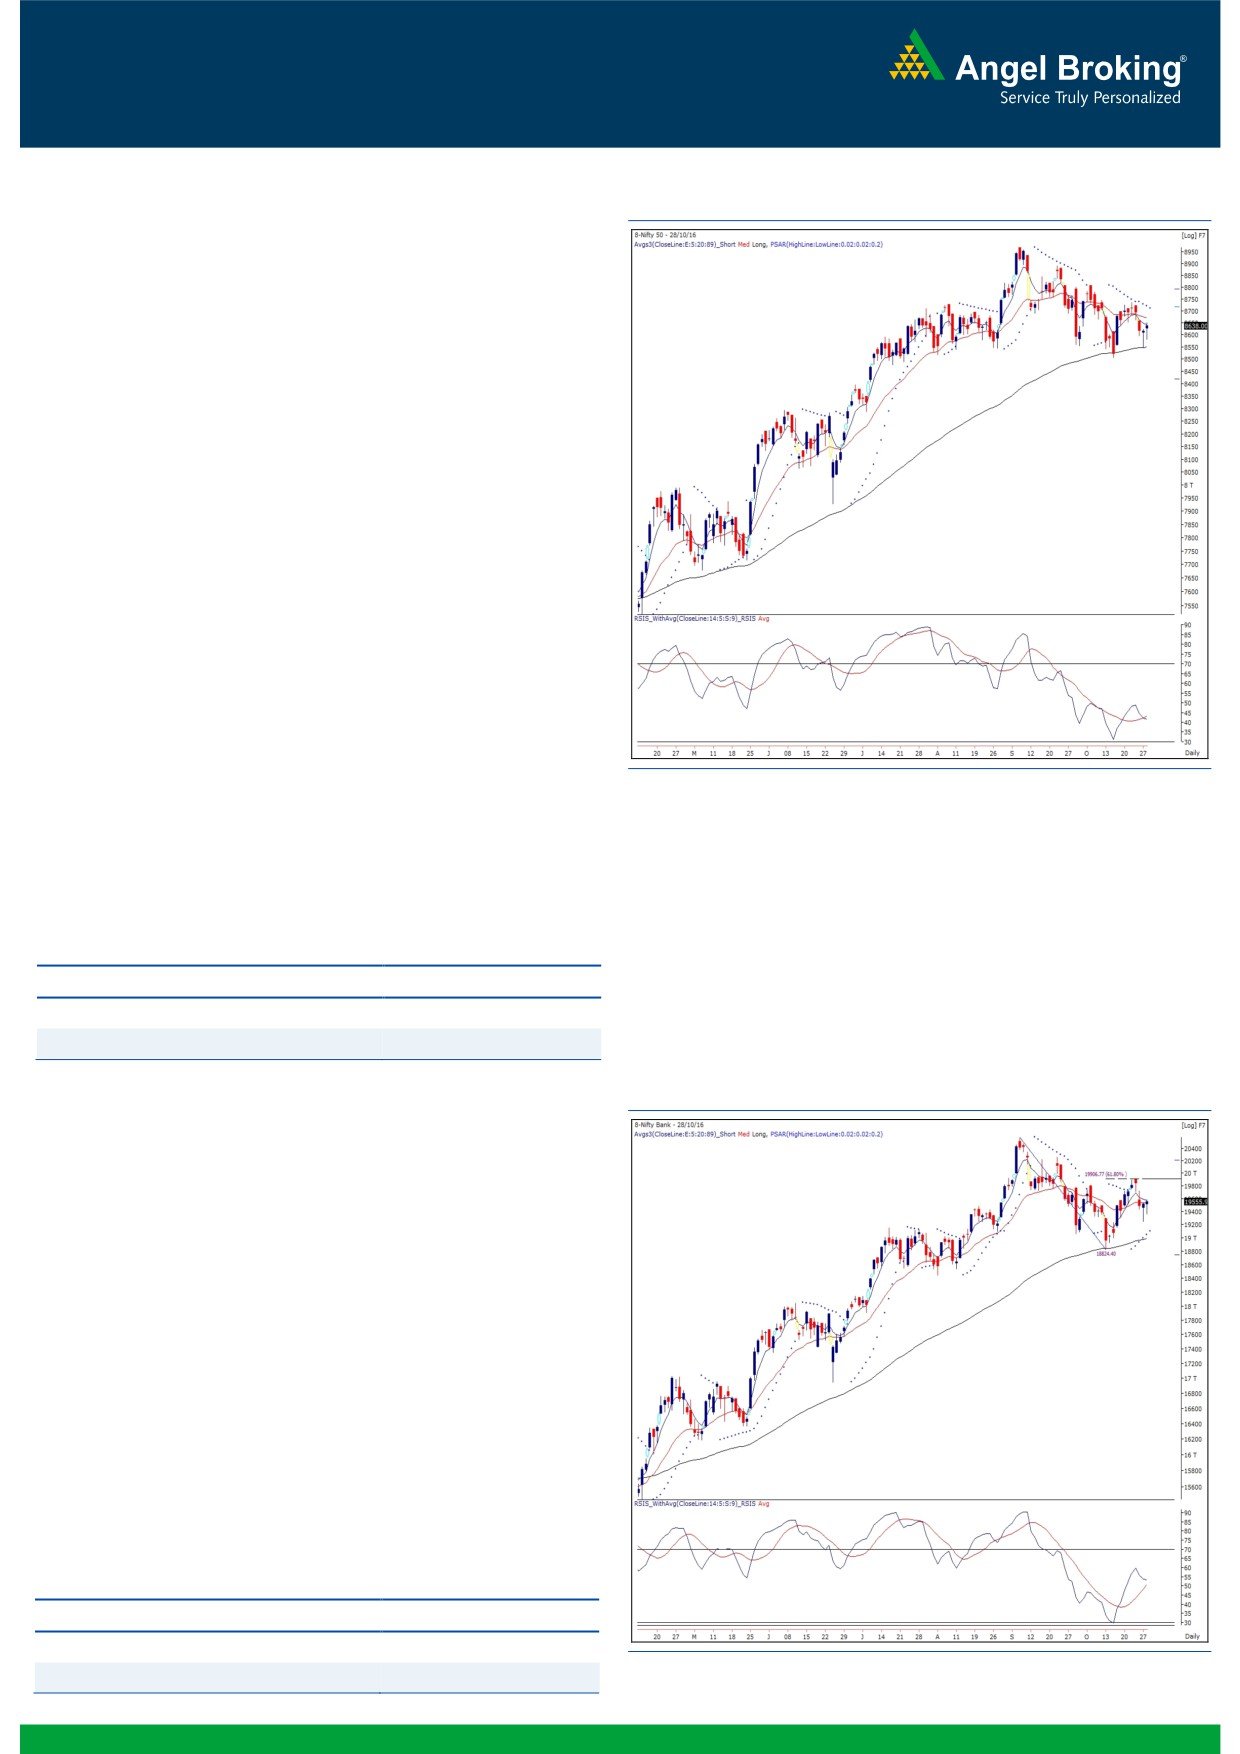
Exhibit 1: Nifty Daily Chart
The Nifty opened with upside gap on Diwali Muhurat Trading and
closed with marginal loss over its previous closing session.
It has been yet another week of uncertainty for the market as the
tussle between both counterparties (the bulls and bears) continued
for the near term dominance. A decent correction during the
midst of the week has validated our view on giving importance to
the 8745 mark. However, on the other hand, the bulls are not
willing to give up as the 8500 has been repeatedly acting a sheet
anchor since last few days. Thus, going by this price development,
it can now be concluded that the index has stuck in a range of
8745 - 8500 and only a sustainable breakout on either side
would dictate the near term trend for our market. At this juncture,
we would continue with the cautious stance as long as 8745 is not
violated convincingly. Most of the indicators are still hinting
towards a possible downside. As far as levels are concerned, a
sustainable move below 8500 would unfold lower levels of 8400
- 8287; whereas in case of an upside breakout, the cautious view
will be negated above 8745 and in this scenario, Nifty may retest
8806 - 8893 levels in the near term. Since, the market is still
lacking clear direction, we would advise traders to stay light as
long as the Nifty remains within a range and wait for a breakout
to happen from the mentioned range in order to take a direction
call on the market.
Key Levels
Support 1 - 8580
Resistance 1 - 8660
Support 2 - 8550
Resistance 2 - 8700
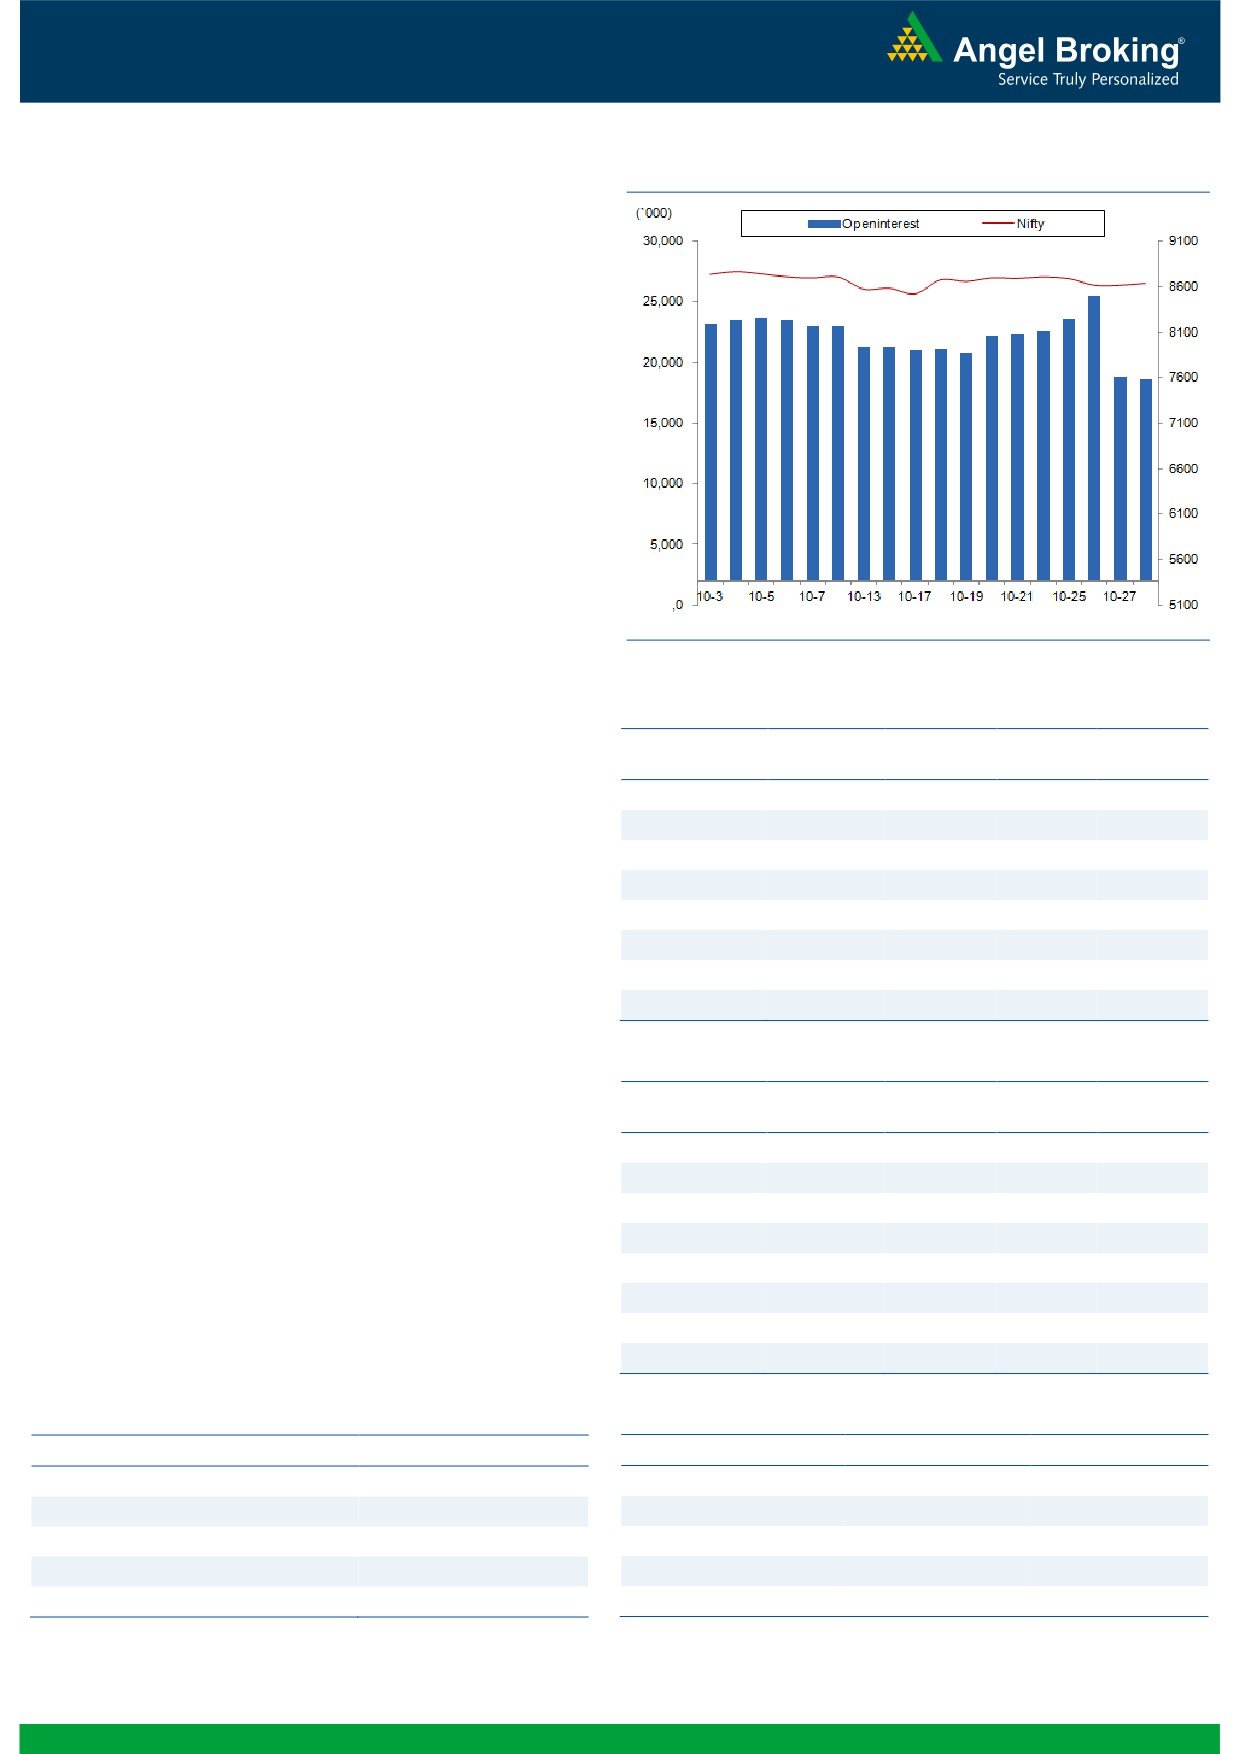
Exhibit 2: Nifty Bank Daily Chart
Nifty Bank Outlook - (19524)
In Friday's trading session, the Nifty Bank index traded with
positive bias which was followed by a range bound session during
the Muhurat Trading on Diwali.
The recent high in the Nifty Bank index had resisted around the
61.8 percent retracement of the previous corrective move.
However, although the index corrected post that, it has not
breached the previous low. Hence, the index has managed to
form a lower top and a higher bottom in intraday charts. This
indicates higher probability of range bound trading in near term.
On a breach of the range of 19200 - 19910 will lead to next
directional move and till then, traders are advised to focus on
stock specific moves. The intraday supports for the Nifty Bank
index are placed around 19400 and 19310 whereas resistances
are seen around 19680 and 19740.
Key Levels
Support 1 - 19400
Resistance 1 - 19680
Support 2 - 19310
Resistance 2 - 19740
1
Technical & Derivatives Report
November 01, 2016
Comments
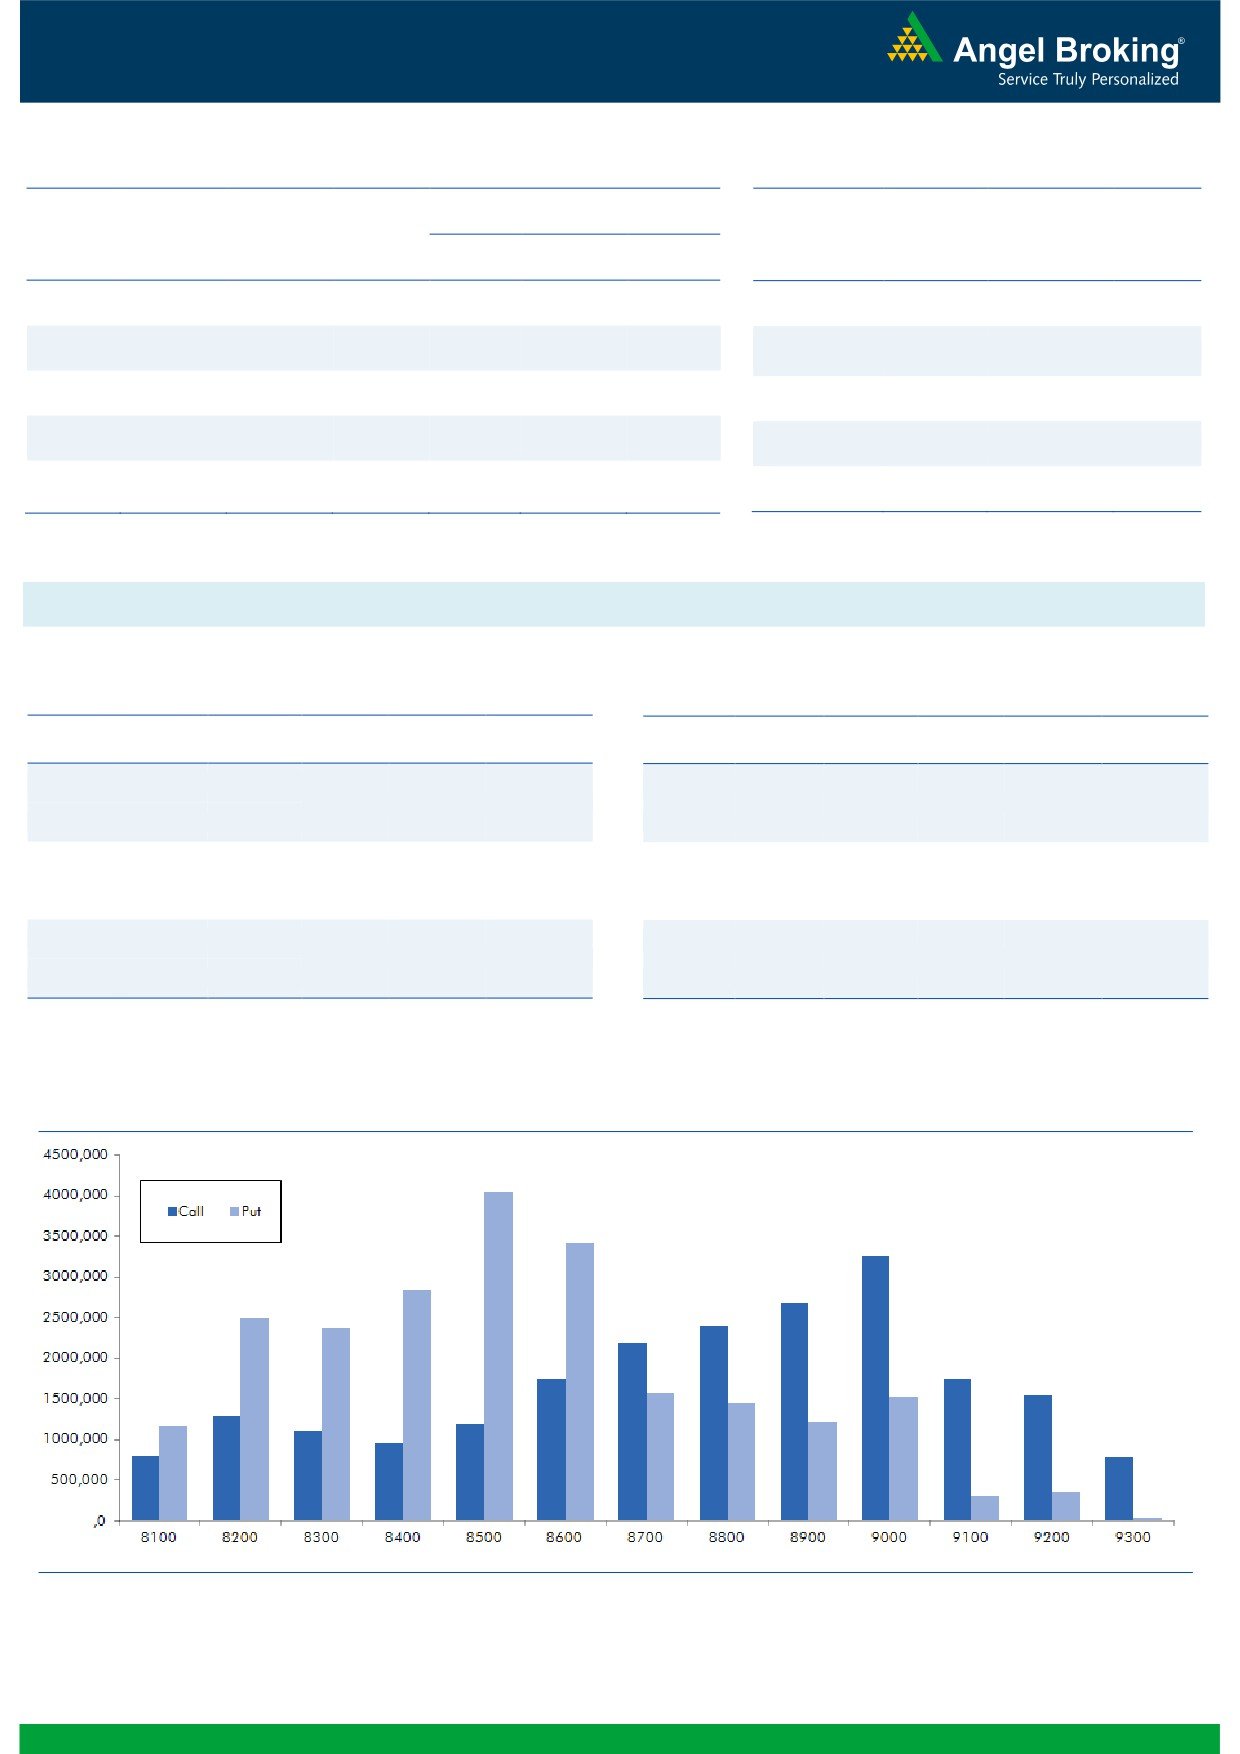
Nifty Vs OI
The Nifty futures open interest has decreased by 0.96%
BankNifty futures open interest has decreased by 0.61%
as market closed at 8638.00 levels on Friday.
The Nifty November future closed with a premium of
29.40 against the premium of 40.00 points in last
trading session. The December series closed at a
premium of 81.60 points.
The Implied Volatility of at the money options has
increased from 13.13% to 13.34%. At the same time, the
PCR-OI of Nifty has increased from 0.97 to 0.99 levels.
The total OI of the market is Rs. 2,16,117/- cr. and the
stock futures OI is Rs. 76,596/- cr.
Few of the liquid counters where we have seen high cost
of carry are TITAN, BEL, NIITTECH, TATAELXSI and
ADANIPOWER.
Views
FIIs were net seller in both equity cash and index future
OI Gainers
segment on Friday. They sold equities worth Rs. 778
OI
PRICE
SCRIP
OI
PRICE
crores. While, in index futures, they were net seller to the
CHG. (%)
CHG. (%)
tune of Rs. 1117 crores with marginal rise in open
BEL
1298250
35.07
1311.40
3.43
interest, indicating blend of long unwinding and fresh
ORIENTBANK
13398000
33.63
128.70
-2.24
short formation on Friday.
CANBK
11739000
29.74
313.00
-0.79
www.angelbroking.com
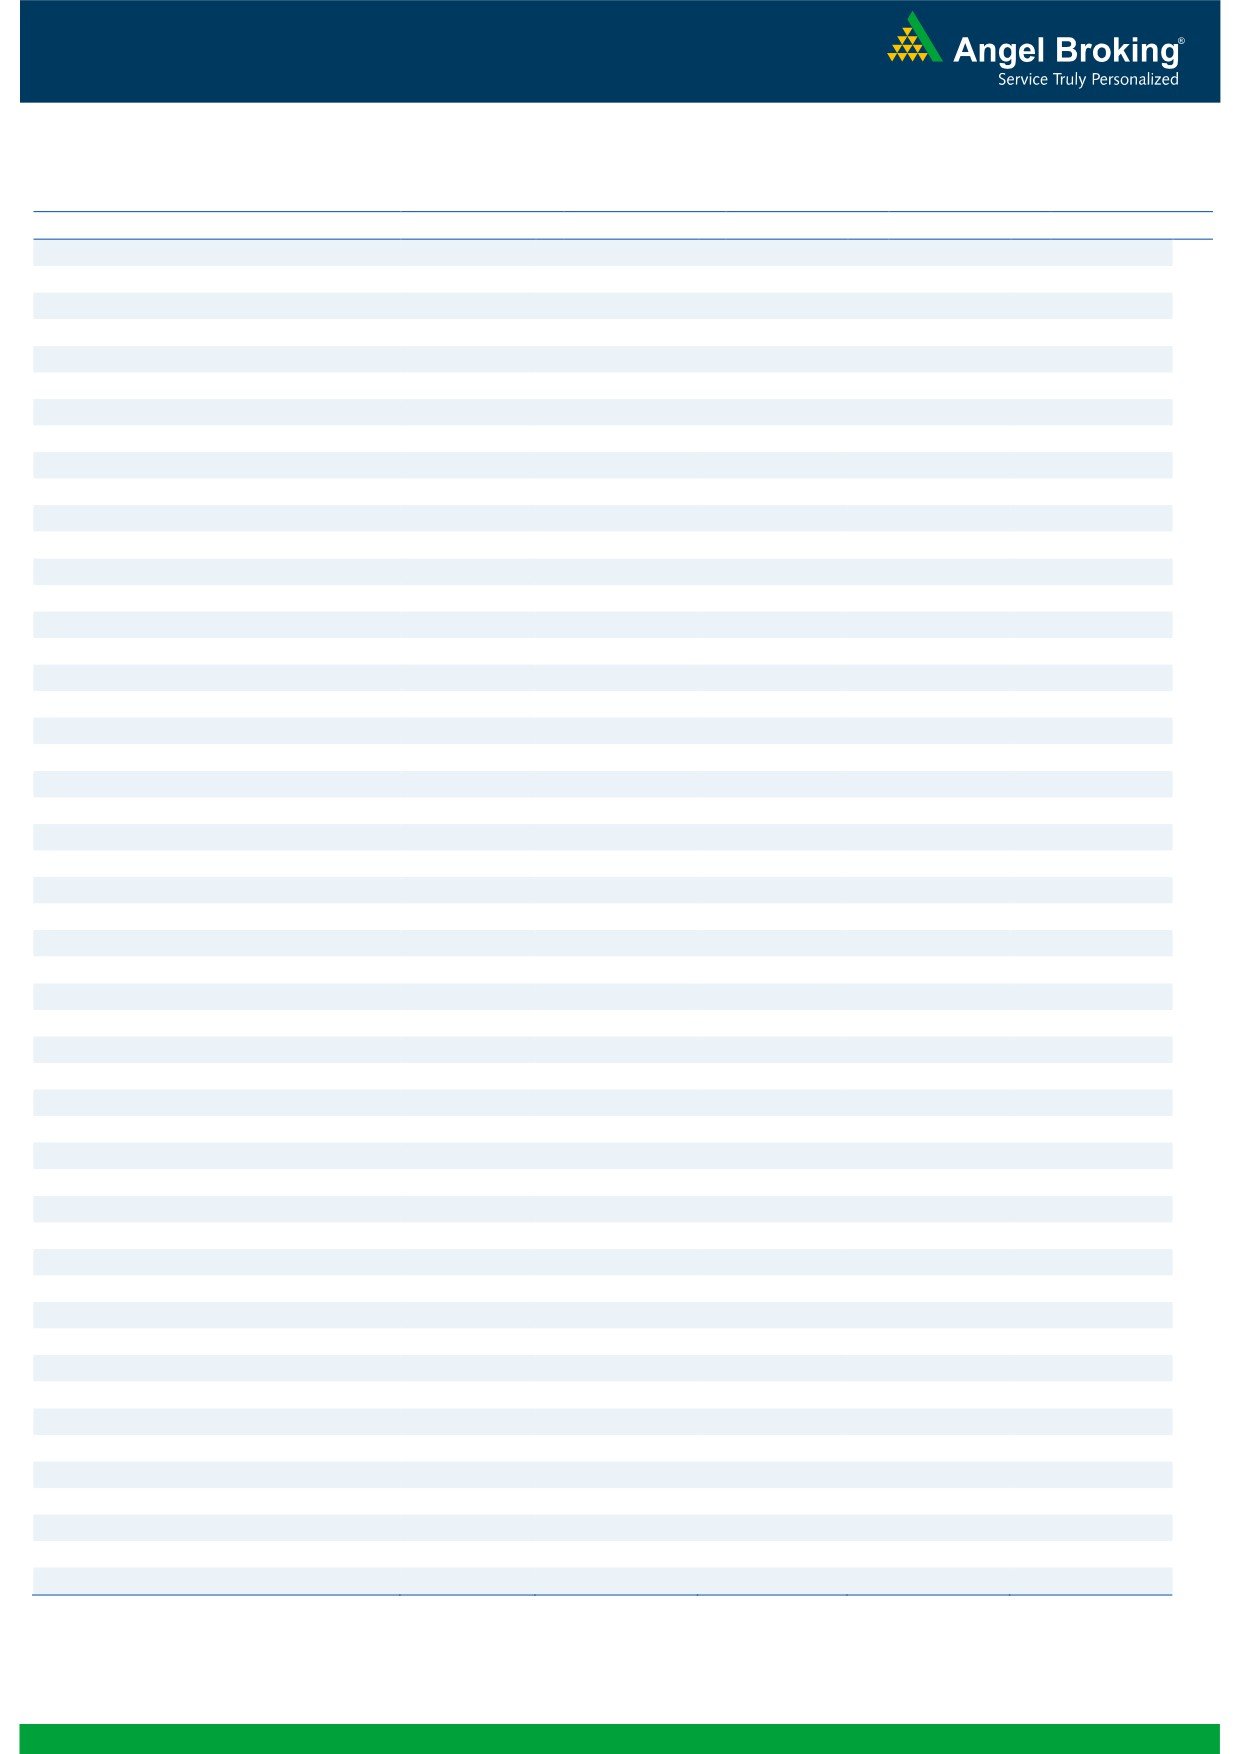
On Index Options front, FIIs bought of worth Rs. 2177
DCBBANK
1858500
25.91
131.75
2.69
crores with significant rise in OI. In call options, 9000,
TORNTPHARM
428000
15.68
1423.10
-0.89
8900 and 8700 strikes were active and added good
CAIRN
20482000
14.77
227.45
1.02
amount of build-up. On the other hand, in put options,
ASIANPAINT
5255400
14.08
1074.05
-1.54
8500 and 8600 strikes added huge positions. Data
NMDC
14400000
13.15
131.60
6.30
suggests that FIIs have added fresh long in these Puts.
Maximum OI in November series has been placed at
OI Losers
9000 call and 8500 put options.
OI
PRICE
SCRIP
OI
PRICE
November series has begun with lower open interest,
CHG. (%)
CHG. (%)
most of the long positions formed since June series have
ZEEL
9977500
-8.97
521.70
2.73
been lightened up. At current juncture, 8500 - 8550
TATACHEM
6517500
-7.06
546.10
0.72
seems to be an immediate support zone for Nifty.
HEROMOTOCO
1486200
-6.94
3366.05
0.89
Looking at the above data, we believe Nifty may breach
CROMPGREAV
10236000
-5.33
76.70
3.09
these support levels in the short run provided we see
UNIONBANK
12732000
-4.96
147.75
2.04
continuation of decent amount of fresh short formation.
OIL
1599700
-4.27
417.35
0.63
Thus, traders are suggested to avoid forming long
TORNTPOWER
1848000
-4.20
174.50
0.84
position unless we see any relevant change in derivatives
RCOM
99946000
-4.09
46.80
1.19
data.
Historical Volatility
Put-Call Ratio
SCRIP
HV
SCRIP
PCR-OI
PCR-VOL
STAR
60.29
NIFTY
0.99
0.98
BEL
26.79
BANKNIFTY
1.02
0.84
CADILAHC
50.63
AXISBANK
0.36
0.42
NHPC
33.80
RELIANCE
0.48
0.41
TECHM
40.37
ICICIBANK
0.54
0.68
2
Technical & Derivatives Report
November 01, 2016
FII Statistics for 28, October 2016
Turnover on 28, October 2016
Open Interest
No. of
Turnover
Change
Detail
Buy
Sell
Net
Instrument
Value
Change
Contracts
( in Cr. )
(%)
Contracts
(in Cr.)
(%)
INDEX
INDEX
1216.22
2333.60
(1117.38)
206540
13764.47
0.25
209203
14545.19
-57.54
FUTURES
FUTURES
INDEX
INDEX
30533.12
28356.58
2176.55
765613
50318.88
8.28
2390102
171927.06
-77.39
OPTIONS
OPTIONS
STOCK
6972.11
6198.56
773.55
854666
55751.25
4.62
STOCK
FUTURES
551098
38613.33
-68.00
FUTURES
STOCK
STOCK
2739.06
2582.65
156.41
29001
1987.45
401.49
OPTIONS
250435
18094.15
-60.68
OPTIONS
TOTAL
41460.51
39471.39
1989.12
1855820
121822.04
6.92
TOTAL
3400838
243179.73
-74.70
Nifty Spot = 8638.00 (Friday’s close)
Lot Size = 75
Bull-Call Spreads
Bear-Put Spreads
Action
Strike
Price
Risk
Reward
BEP
Action
Strike
Price
Risk
Reward
BEP
Buy
8700
108.00
Buy
8600
100.65
43.70
56.30
8743.70
30.50
69.50
8569.50
Sell
8800
64.30
Sell
8500
70.15
Buy
8700
108.00
Buy
8600
100.65
73.60
126.40
8773.60
53.05
146.95
8546.95
Sell
8900
34.40
Sell
8400
47.60
Buy
8800
64.30
Buy
8500
70.15
29.90
70.10
8829.90
22.55
77.45
8477.45
Sell
8900
34.40
Sell
8400
47.60
Note: Above mentioned Bullish or Bearish Spreads in Nifty (November Series) are given as an information and not as a recommendation.
Nifty Put-Call Analysis
Note : All Derivative data and levels are as per Friday’s close.
3
Technical & Derivatives Report
November 01, 2016
Daily Pivot Levels for Nifty Constituents
Scrips
S2
S1
PIVOT
R1
R2
ACC
1,495
1,504
1,518
1,528
1,542
ADANIPORTS
299
303
306
310
314
AMBUJACEM
239
240
242
243
244
ASIANPAINT
1,047
1,058
1,078
1,089
1,109
AUROPHARMA
788
800
813
825
838
AXISBANK
479
483
489
492
498
BAJAJ-AUTO
2,729
2,792
2,825
2,888
2,920
BANKBARODA
152
154
155
158
159
BHEL
137
138
139
140
141
BPCL
660
665
671
675
681
BHARTIARTL
315
317
320
322
325
INFRATEL
334
340
349
355
364
BOSCH
21,424
21,630
22,005
22,211
22,587
CIPLA
565
569
578
582
591
COALINDIA
311
318
323
329
334
DRREDDY
3,274
3,315
3,357
3,398
3,440
EICHERMOT
23,019
23,484
24,141
24,607
25,264
GAIL
427
431
433
437
439
GRASIM
938
952
966
980
994
HCLTECH
748
756
769
777
790
HDFCBANK
1,232
1,245
1,254
1,267
1,275
HDFC
1,352
1,372
1,382
1,402
1,413
HEROMOTOCO
3,287
3,316
3,345
3,374
3,403
HINDALCO
147
148
149
151
152
HINDUNILVR
826
832
839
845
852
ICICIBANK
271
274
278
281
285
IDEA
74
75
77
78
80
INDUSINDBK
1,161
1,181
1,191
1,211
1,221
INFY
983
990
1,000
1,007
1,017
ITC
237
240
242
245
247
KOTAKBANK
792
806
814
828
836
LT
1,454
1,468
1,476
1,489
1,498
LUPIN
1,472
1,484
1,494
1,506
1,516
M&M
1,282
1,298
1,307
1,323
1,331
MARUTI
5,827
5,851
5,890
5,914
5,953
NTPC
148
150
152
155
157
ONGC
280
284
289
292
298
POWERGRID
170
173
175
178
180
RELIANCE
1,038
1,047
1,052
1,061
1,066
SBIN
252
255
257
260
262
SUNPHARMA
736
740
746
750
756
TCS
2,374
2,386
2,401
2,413
2,428
TATAMTRDVR
330
339
345
354
360
TATAMOTORS
519
528
534
543
549
TATAPOWER
76
77
79
80
83
TATASTEEL
394
400
403
409
412
TECHM
421
428
436
443
451
ULTRACEMCO
3,853
3,916
3,953
4,016
4,053
WIPRO
449
455
461
468
473
YESBANK
1,248
1,260
1,269
1,280
1,289
ZEEL
497
509
516
527
534
4
Technical & Derivatives Report
November 01, 2016
Research Team Tel: 022 - 39357800
For Technical Queries
For Derivatives Queries
DISCLAIMER
Angel Broking Private Limited (hereinafter referred to as “Angel”) is a registered Member of National Stock Exchange of India Limited,
Bombay Stock Exchange Limited and Metropolitan Stock Exchange Limited. It is also registered as a Depository Participant with CDSL
and Portfolio Manager with SEBI. It also has registration with AMFI as a Mutual Fund Distributor. Angel Broking Private Limited is a
registered entity with SEBI for Research Analyst in terms of SEBI (Research Analyst) Regulations, 2014 vide registration number
INH000000164. Angel or its associates has not been debarred/ suspended by SEBI or any other regulatory authority for accessing
/dealing in securities Market. Angel or its associates/analyst has not received any compensation / managed or co-managed public
offering of securities of the company covered by Analyst during the past twelve months.
This document is solely for the personal information of the recipient, and must not be singularly used as the basis of any investment
decision. Nothing in this document should be construed as investment or financial advice. Each recipient of this document should
make such investigations as they deem necessary to arrive at an independent evaluation of an investment in the securities of the
companies referred to in this document (including the merits and risks involved), and should consult their own advisors to determine
the merits and risks of such an investment.
Reports based on technical and derivative analysis center on studying charts of a stock's price movement, outstanding positions and
trading volume, as opposed to focusing on a company's fundamentals and, as such, may not match with a report on a company's
fundamentals. Investors are advised to refer the Fundamental and Technical Research Reports available on our website to evaluate the
contrary view, if any.
The information in this document has been printed on the basis of publicly available information, internal data and other reliable
sources believed to be true, but we do not represent that it is accurate or complete and it should not be relied on as such, as this
document is for general guidance only. Angel Broking Pvt. Limited or any of its affiliates/ group companies shall not be in any way
responsible for any loss or damage that may arise to any person from any inadvertent error in the information contained in this report.
Angel Broking Pvt. Limited has not independently verified all the information contained within this document. Accordingly, we cannot
testify, nor make any representation or warranty, express or implied, to the accuracy, contents or data contained within this document.
While Angel Broking Pvt. Limited endeavors to update on a reasonable basis the information discussed in this material, there may be
regulatory, compliance, or other reasons that prevent us from doing so.
This document is being supplied to you solely for your information, and its contents, information or data may not be reproduced,
redistributed or passed on, directly or indirectly.
Neither Angel Broking Pvt. Limited, nor its directors, employees or affiliates shall be liable for any loss or damage that may arise from
or in connection with the use of this information.
5