Technical & Derivatives Report
September 01, 2016
Sensex (28452) / Nifty (8786)
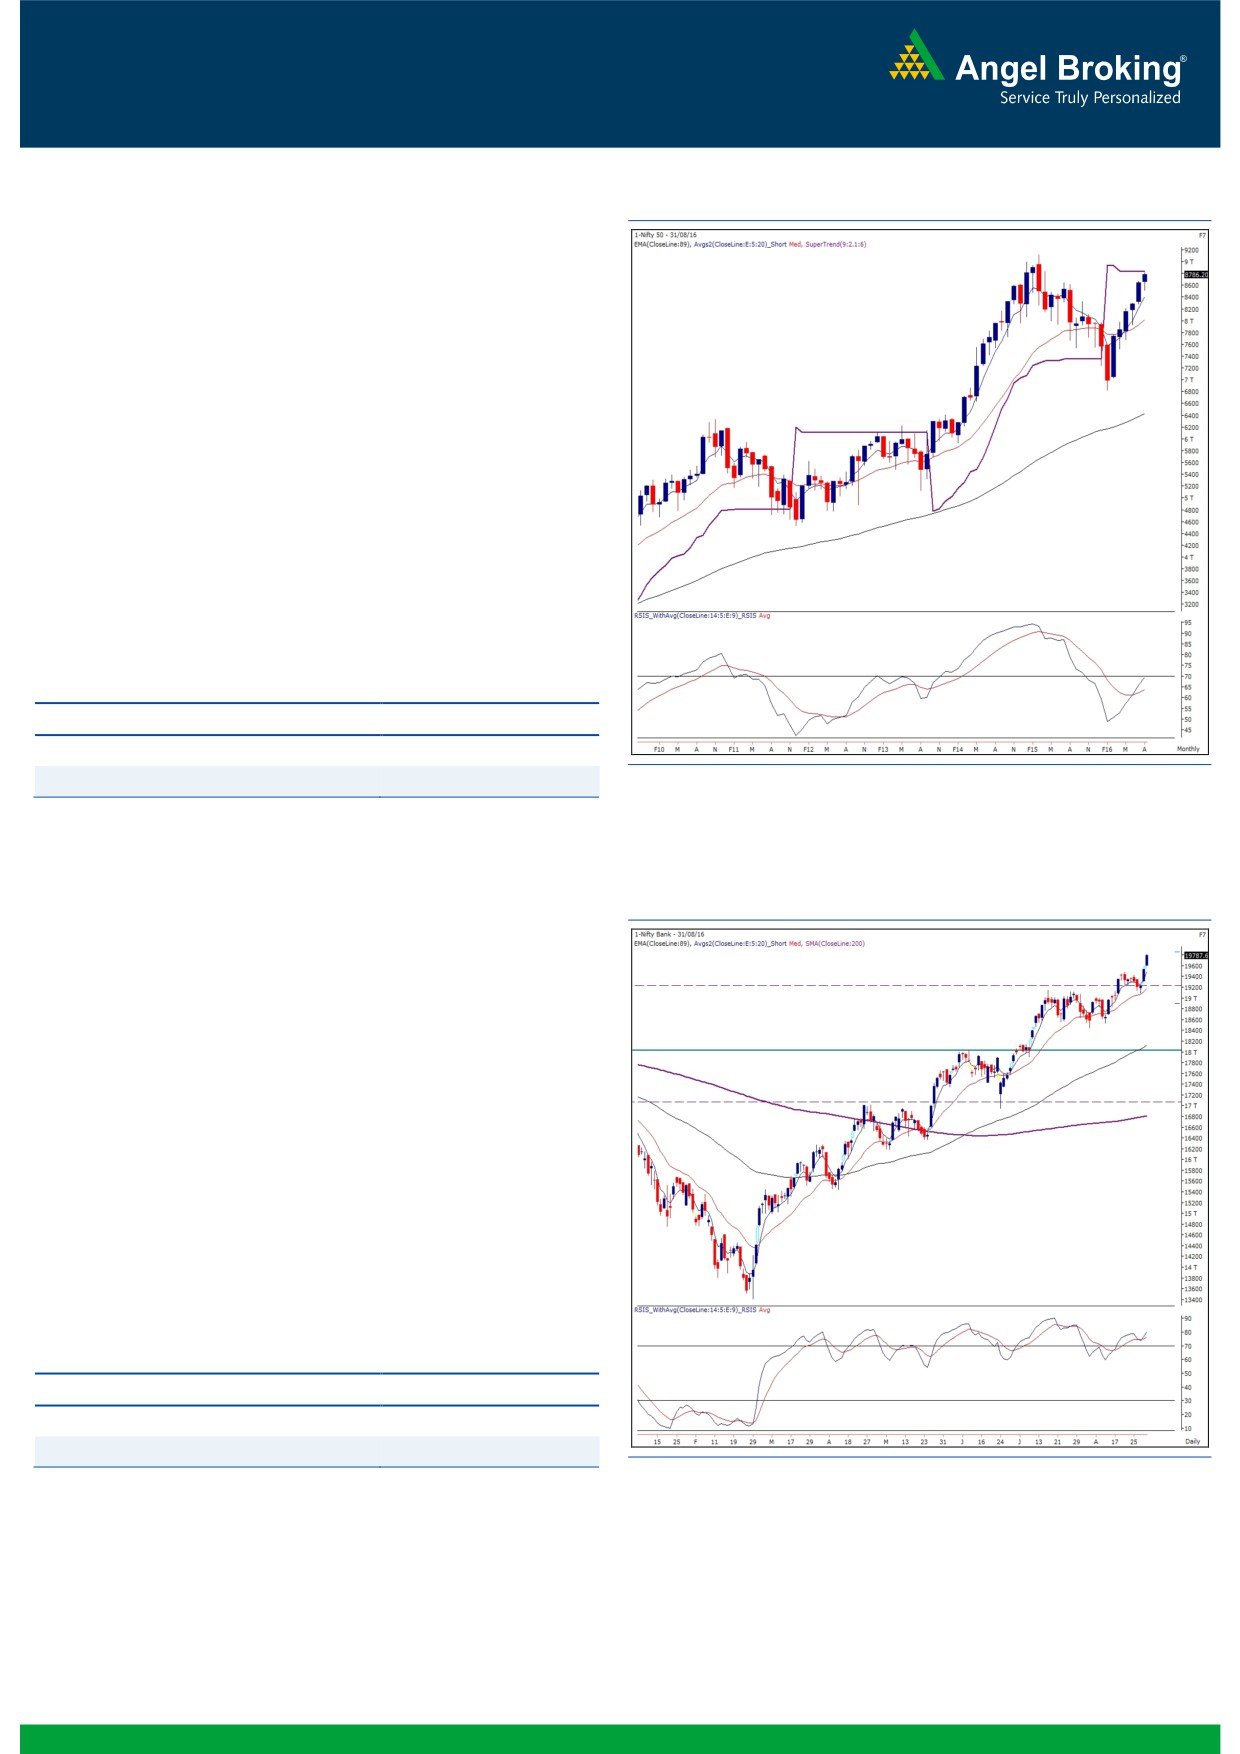
Exhibit 1: Nifty Monthly Chart
In continuation with its previous day's optimism, the Nifty opened
higher with yet another upside gap and kept on ascending as the
day progressed to add another half a percent gains to bull's kitty.
In the course of action, the Nifty finally entered our mentioned
target zone of 8800 - 8850. With reference to our previous
articles, the monthly 'Super Trend' is placed around 8850 and
thus, to be on the conservative basis, we would advise traders to
keep booking profits in the mentioned zone. Since, there is no
sign of weakness, we do not want to sound pessimistic and hence,
traders should refrain from shorting at this point in time. We
expect stock specific positive momentum to continue further and
hence traders should keep following stock specific approach with
proper exit strategy. The intraday support for the Nifty are placed
around 8750 and 8696.
Key Levels
Support 1 - 8750
Resistance 1 - 8800
Support 2 - 8696
Resistance 2 - 8850
Nifty Bank Outlook - (19788)
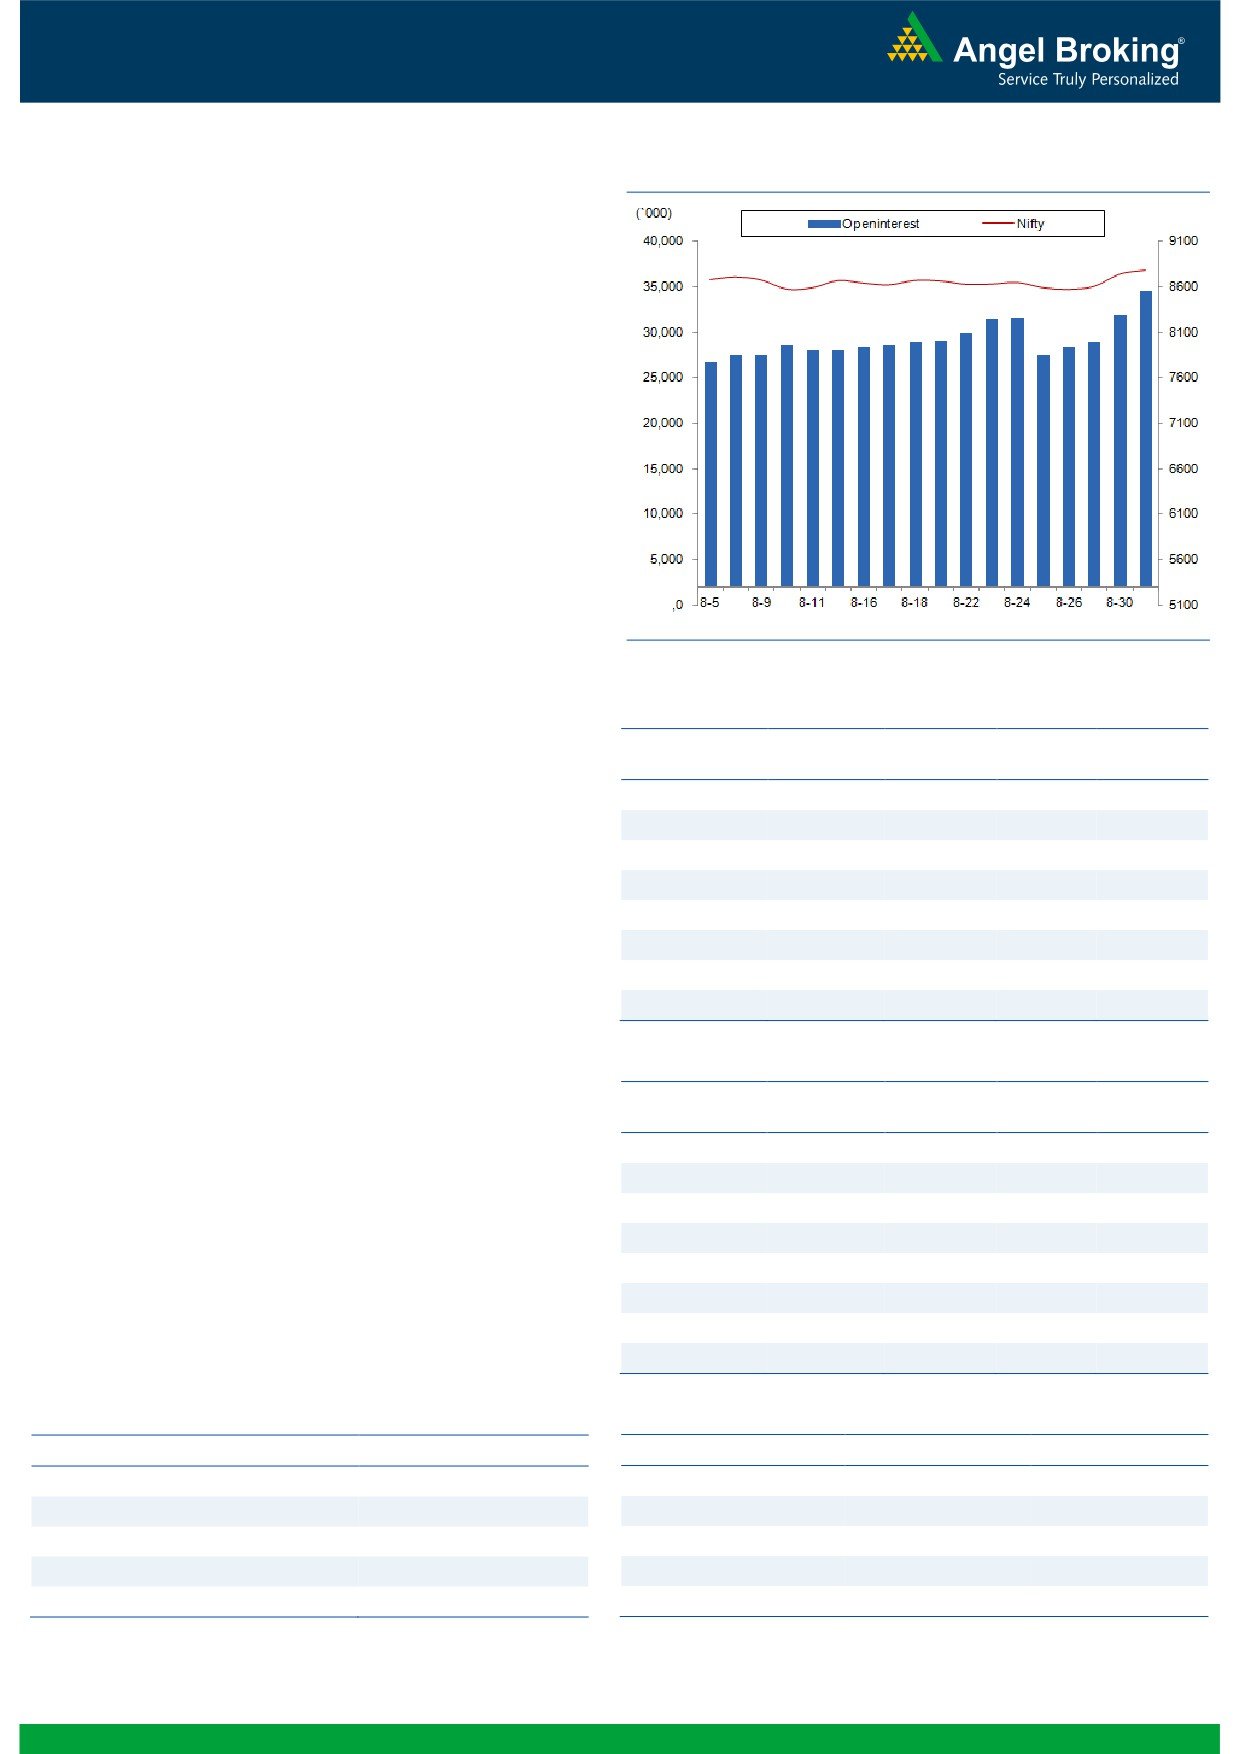
Exhibit 2: Nifty Bank Daily Chart
The Nifty Bank index too opened higher yesterday and continued
its strong positive momentum throughout the session to end the
day with gains of 1.31 percent over its previous session's close.
In continuation with our previous day's outlook, we continue to
maintain our positive stance in the Nifty Bank index. The
individual heavyweights amongst the sector are showing strength
and thus, we are expecting continuation of the positive
momentum upto 19900 - 20000. However, given the risk reward
ratio at current levels, traders are advised to follow stock specific
approach and trade with proper exit strategy. The intraday
support for the Nifty bank index are placed around 19620 and
19546; whereas, resistance is seen in the range of 19900 -
20000.
Key Levels
Support 1 - 19620
Resistance 1 - 19900
Support 2 - 19546
Resistance 2 - 20000
1
Technical & Derivatives Report
September 01, 2016
Comments
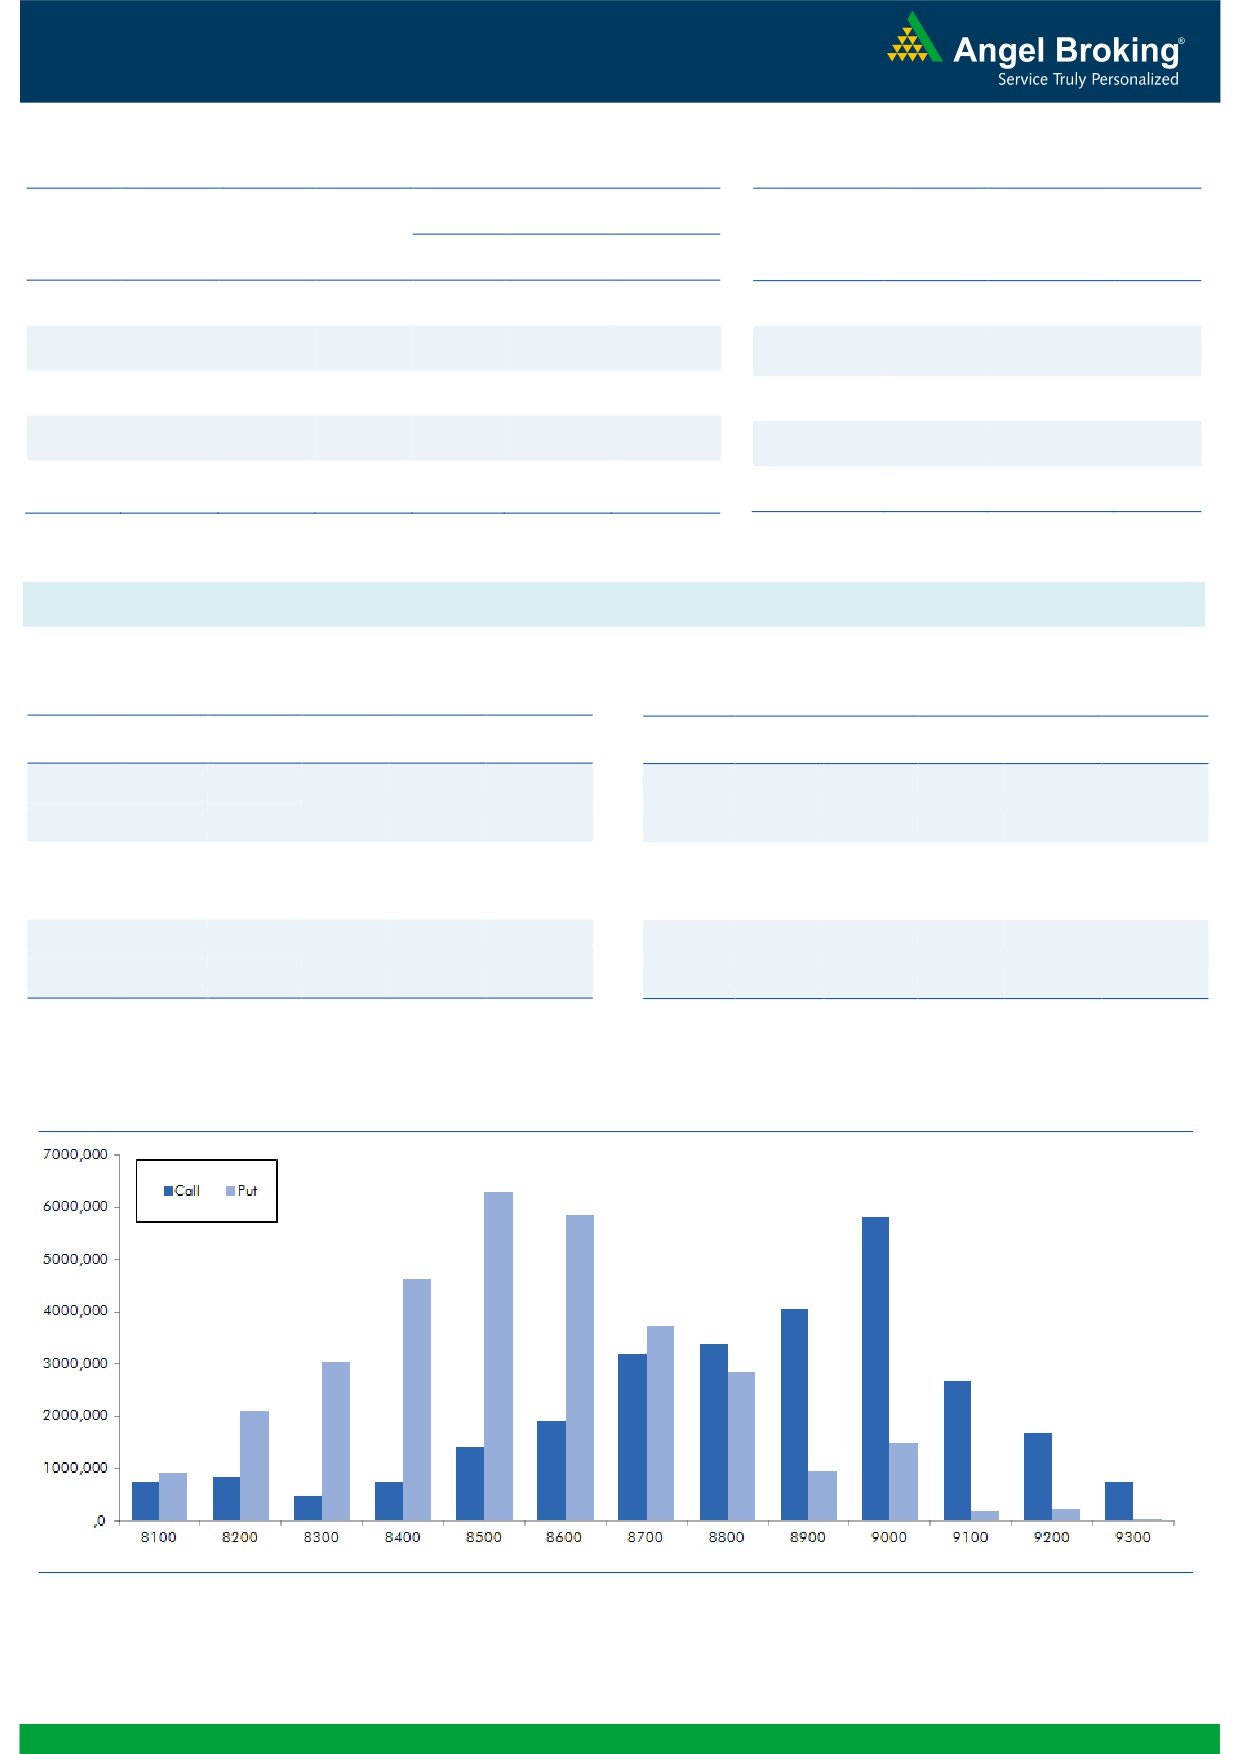
Nifty Vs OI
The Nifty futures open interest has increased by 8.38%
BankNifty futures open interest has increased by 8.51%
as market closed at 8786.20 levels.
The Nifty September future closed with a premium of
49.95 points against a premium of 50.25 points in
previous session. The October series closed at a
premium of 90.50 points.
The Implied Volatility of at the money options has
increased from 11.48% to 11.55%. At the same time, the
PCR-OI of Nifty has increased from 1.06 to 1.09.
The total OI of the market is Rs. 2,75,889/- cr. and the
stock futures OI is Rs. 82,367/- cr.
Few of the liquid counters where we have seen high cost
of carry are GMRINFRA, AMBUJACEM, OFSS, EXIDEIND
and SINTEX.
Views
OI Gainers
OI
PRICE
FIIs keep on pouring liquidity in both equity cash and
SCRIP
OI
PRICE
CHG. (%)
CHG. (%)
index futures segment. They bought equities worth Rs.
AXISBANK
37040400
54.92
598.85
0.70
854 crores. While, they were net buyers to the tune of Rs.
YESBANK
13059200
38.27
1364.55
0.19
2886 crores in Index Futures with rise in OI, indicating
NCC
30600000
14.93
85.55
3.13
huge fresh long formation in last trading session.gelbroking.com
PFC
27924000
13.60
124.20
7.39
On Index Options front, FIIs were net buyers of Rs. 428
GODREJCP
445200
13.57
1529.60
-2.87
crores with good amount of rise in OI. In call options,
AMARAJABAT
560400
12.53
960.95
3.61
8900-9100 strikes continue to remain active and they
NTPC
24804000
11.73
158.80
-1.52
also added good amount of positions. While in put
DLF
41090000
11.61
156.05
-4.50
options, 8700 and 8800 strikes added good amount of
build-up. Highest OI in September series is visible in
9000 call and 8500 put options.
OI Losers
OI
PRICE
From start of September series, we are witnessing
SCRIP
OI
PRICE
CHG. (%)
CHG. (%)
meaningful long addition in Index Futures. From last two
FEDERALBNK
34936000
-8.47
69.05
1.17
trading sessions, we are sseing good amount of fresh
CASTROLIND
6196400
-7.06
450.80
4.97
long formation in out of the money call options viz. 9000
APOLLOTYRE
10407000
-7.02
183.85
-1.39
and 9100 strikes. We believe these are long positions
CENTURYTEX
6932200
-5.32
727.00
0.14
formed by FIIs. While, writing in 8600-8700 put options
UNIONBANK
14428000
-5.25
142.50
-0.07
is also visible. Thus, Nifty may continue to show strength
BIOCON
3877500
-5.17
920.30
0.37
and may also test 8950-9000 in near term.
PETRONET
3375000
-4.58
351.10
2.24
IOC
11172000
-3.67
570.65
0.54
Historical Volatility
Put-Call Ratio
SCRIP
HV
SCRIP
PCR-OI
PCR-VOL
PFC
49.48
NIFTY
1.09
1.03
IDFC
53.00
BANKNIFTY
1.57
1.09
CASTROLIND
34.79
RELIANCE
0.62
0.60
RECLTD
38.32
SBIN
0.76
0.47
DLF
40.21
TATAMOTORS
1.09
0.65
2
Technical & Derivatives Report
September 01, 2016
FII Statistics for 31-August 2016
Turnover on 31-August 2016
Open Interest
No. of
Turnover
Change
Detail
Buy
Sell
Net
Instrument
Value
Contracts
( in Cr. )
(%)
Contracts
Change (%)
(in Cr.)
INDEX
INDEX
5451.56
2565.79
2885.77
424310
28573.15
7.04
263035
18633.15
-0.44
FUTURES
FUTURES
INDEX
INDEX
41442.35
41013.78
428.57
977188
65543.35
5.16
4032515
296735.96
21.74
OPTIONS
OPTIONS
STOCK
9692.21
9487.83
204.39
862950
58008.63
2.95
STOCK
FUTURES
672964
48848.35
19.75
FUTURES
STOCK
STOCK
4684.23
4632.00
52.23
67092
4616.51
14.89
OPTIONS
318796
23418.90
22.94
OPTIONS
TOTAL
61270.36
57699.40
3570.96
2331540
156741.65
4.92
TOTAL
5287310
387636.36
20.27
Nifty Spot = 8786.20
Lot Size = 75
Bull-Call Spreads
Bear-Put Spreads
Action
Strike
Price
Risk
Reward
BEP
Action
Strike
Price
Risk
Reward
BEP
Buy
8900
82.65
Buy
8800
100.30
35.50
64.50
8935.50
32.70
67.30
8767.30
Sell
9000
47.15
Sell
8700
67.60
Buy
8900
82.65
Buy
8800
100.30
58.75
141.25
8958.75
55.05
144.95
8744.95
Sell
9100
23.90
Sell
8600
45.25
Buy
9000
47.15
Buy
8700
67.60
23.25
76.75
9023.25
22.35
77.65
8677.65
Sell
9100
23.90
Sell
8600
45.25
Note: Above mentioned Bullish or Bearish Spreads in Nifty (September Series) are given as an information and not as a recommendation.
Nifty Put-Call Analysis
3
Technical & Derivatives Report
September 01, 2016
Daily Pivot Levels for Nifty Constituents
Scrips
S2
S1
PIVOT
R1
R2
ACC
1,671
1,691
1,708
1,727
1,744
ADANIPORTS
259
261
264
266
268
AMBUJACEM
272
275
278
281
285
ASIANPAINT
1,135
1,147
1,160
1,172
1,185
AUROPHARMA
778
784
795
801
812
AXISBANK
571
584
594
607
617
BAJAJ-AUTO
2,928
2,953
2,995
3,021
3,063
BANKBARODA
160
161
164
165
167
BHEL
136
138
140
141
143
BPCL
591
597
603
609
616
BHARTIARTL
324
328
332
336
341
INFRATEL
341
346
349
355
358
BOSCH
23,690
23,929
24,314
24,553
24,939
CIPLA
559
566
577
584
594
COALINDIA
328
331
334
336
339
DRREDDY
3,050
3,070
3,100
3,120
3,150
EICHERMOT
22,099
22,425
22,927
23,253
23,755
GAIL
377
381
385
389
393
GRASIM
4,597
4,633
4,694
4,730
4,791
HCLTECH
761
770
782
790
802
HDFCBANK
1,254
1,273
1,284
1,302
1,313
HDFC
1,379
1,392
1,403
1,416
1,427
HEROMOTOCO
3,429
3,485
3,534
3,590
3,639
HINDALCO
154
157
161
163
167
HINDUNILVR
904
910
918
925
933
ICICIBANK
255
256
259
260
262
IDEA
92
93
94
94
95
INDUSINDBK
1,143
1,164
1,182
1,204
1,221
INFY
1,019
1,027
1,036
1,045
1,054
ITC
254
257
259
262
264
KOTAKBANK
783
795
805
817
827
LT
1,453
1,483
1,500
1,531
1,548
LUPIN
1,445
1,464
1,497
1,516
1,550
M&M
1,421
1,429
1,438
1,446
1,456
MARUTI
4,997
5,025
5,065
5,093
5,132
NTPC
156
158
160
161
164
ONGC
232
234
238
240
244
POWERGRID
181
182
183
185
186
RELIANCE
1,033
1,047
1,060
1,074
1,087
SBIN
249
251
253
255
258
SUNPHARMA
766
771
776
781
787
TCS
2,472
2,491
2,521
2,541
2,570
TATAMTRDVR
332
338
344
350
357
TATAMOTORS
519
528
539
548
558
TATAPOWER
76
77
78
79
80
TATASTEEL
361
365
373
378
386
TECHM
456
462
468
475
480
ULTRACEMCO
3,860
3,945
4,004
4,088
4,148
WIPRO
482
487
491
496
501
YESBANK
1,323
1,345
1,363
1,385
1,404
ZEEL
514
527
535
548
557
4
Technical & Derivatives Report
September 01, 2016
Research Team Tel: 022 - 39357800
For Technical Queries
For Derivatives Queries
DISCLAIMER
Angel Broking Private Limited (hereinafter referred to as “Angel”) is a registered Member of National Stock Exchange of India Limited,
Bombay Stock Exchange Limited and Metropolitan Stock Exchange Limited. It is also registered as a Depository Participant with CDSL
and Portfolio Manager with SEBI. It also has registration with AMFI as a Mutual Fund Distributor. Angel Broking Private Limited is a
registered entity with SEBI for Research Analyst in terms of SEBI (Research Analyst) Regulations, 2014 vide registration number
INH000000164. Angel or its associates has not been debarred/ suspended by SEBI or any other regulatory authority for accessing
/dealing in securities Market. Angel or its associates/analyst has not received any compensation / managed or co-managed public
offering of securities of the company covered by Analyst during the past twelve months.
This document is solely for the personal information of the recipient, and must not be singularly used as the basis of any investment
decision. Nothing in this document should be construed as investment or financial advice. Each recipient of this document should
make such investigations as they deem necessary to arrive at an independent evaluation of an investment in the securities of the
companies referred to in this document (including the merits and risks involved), and should consult their own advisors to determine
the merits and risks of such an investment.
Reports based on technical and derivative analysis center on studying charts of a stock's price movement, outstanding positions and
trading volume, as opposed to focusing on a company's fundamentals and, as such, may not match with a report on a company's
fundamentals. Investors are advised to refer the Fundamental and Technical Research Reports available on our website to evaluate the
contrary view, if any.
The information in this document has been printed on the basis of publicly available information, internal data and other reliable
sources believed to be true, but we do not represent that it is accurate or complete and it should not be relied on as such, as this
document is for general guidance only. Angel Broking Pvt. Limited or any of its affiliates/ group companies shall not be in any way
responsible for any loss or damage that may arise to any person from any inadvertent error in the information contained in this report.
Angel Broking Pvt. Limited has not independently verified all the information contained within this document. Accordingly, we cannot
testify, nor make any representation or warranty, express or implied, to the accuracy, contents or data contained within this document.
While Angel Broking Pvt. Limited endeavors to update on a reasonable basis the information discussed in this material, there may be
regulatory, compliance, or other reasons that prevent us from doing so.
This document is being supplied to you solely for your information, and its contents, information or data may not be reproduced,
redistributed or passed on, directly or indirectly.
Neither Angel Broking Pvt. Limited, nor its directors, employees or affiliates shall be liable for any loss or damage that may arise from
or in connection with the use of this information.
5