Technical & Derivatives Report
August 01, 2016
Sensex (28052) / Nifty (8639)
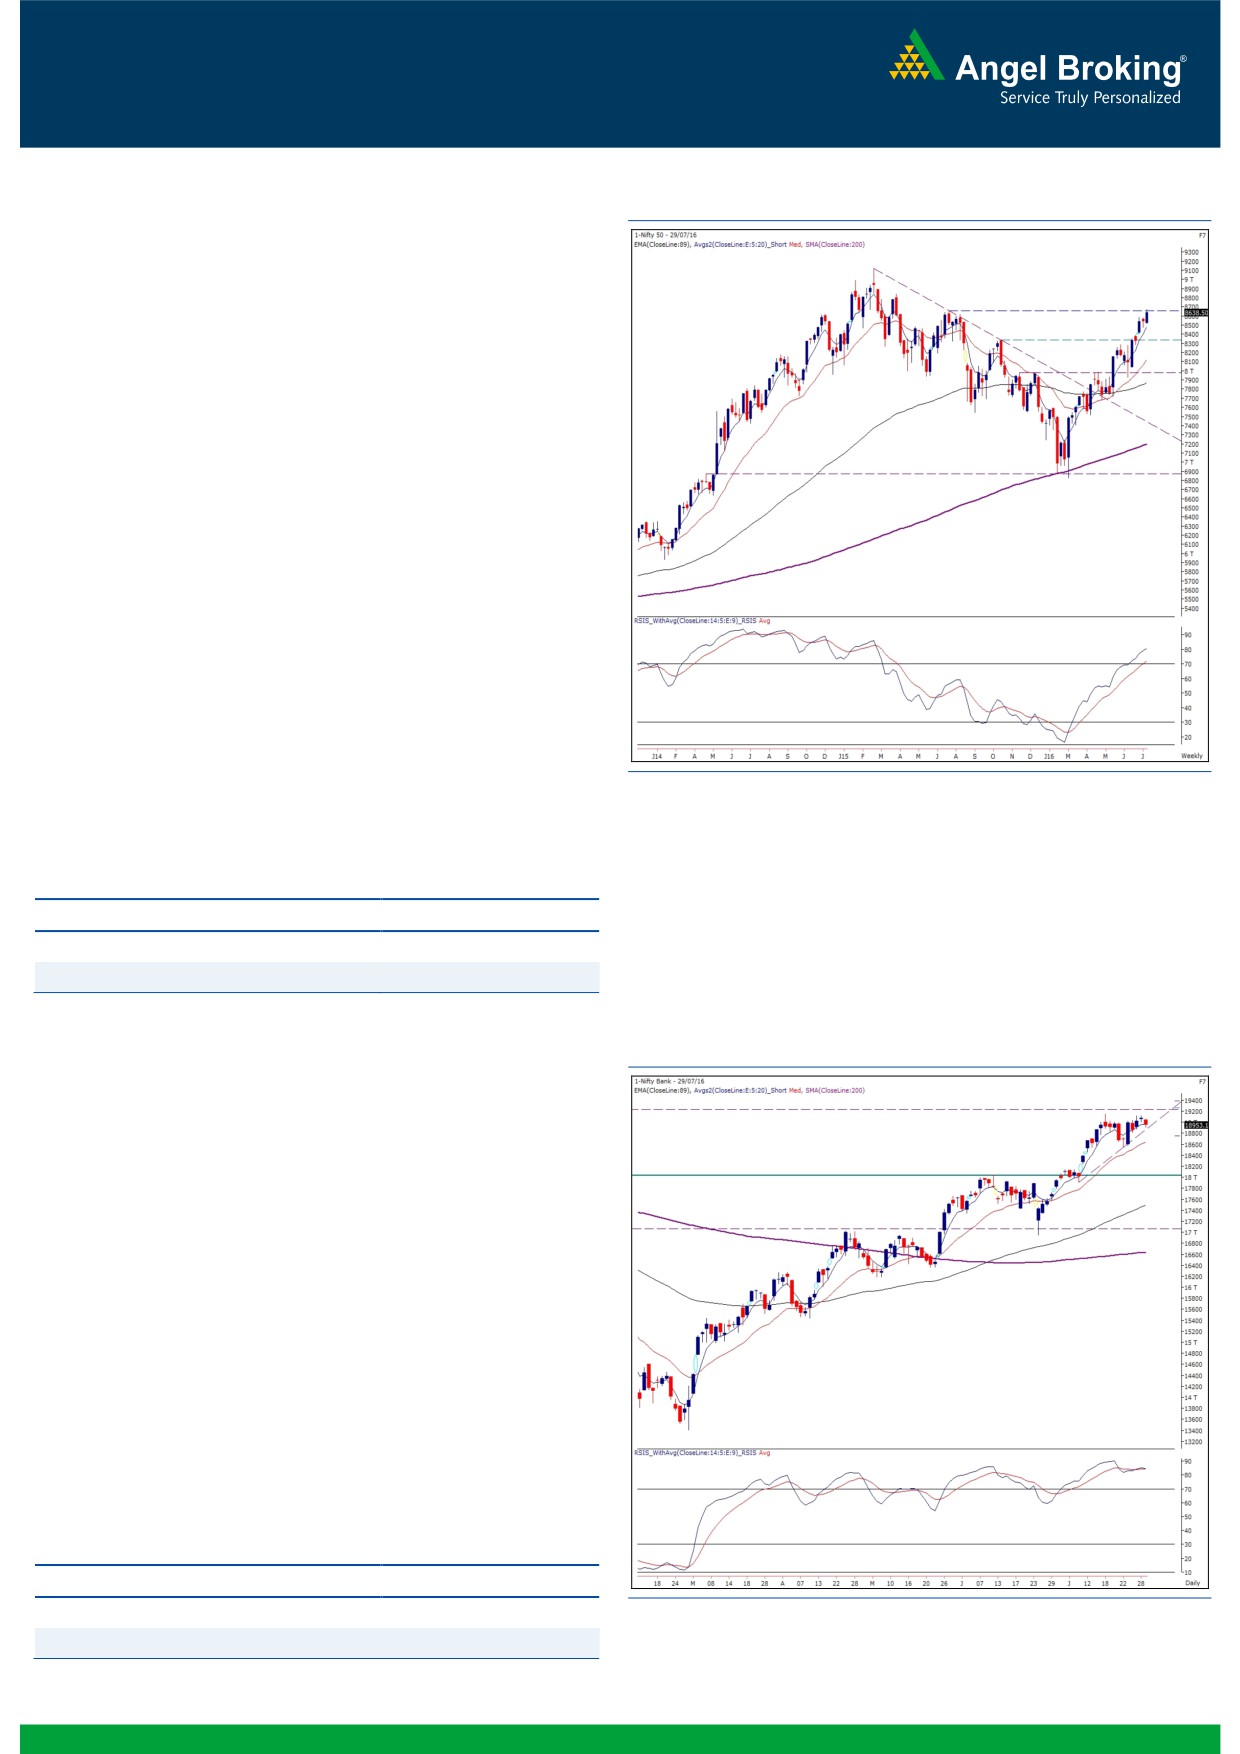
Exhibit 1: Nifty Hourly Chart
The Nifty continued with its uptrend in the week gone by and
tested the 8655 mark, which was on our expected lines. If we
observe the daily chart meticulously, the last three weeks’ up
move in the index has led to a formation of a ‘Rising Wedge’
pattern. Such a pattern is usually formed at the end of an uptrend
and a breakdown of the same generally leads to a reversal in the
trend. However, on this occasion, even in case of a confirmation
of this pattern, we still do not expect any trend reversal. On the
contrary, we would rather look at it as just a loss of momentum in
the ongoing optimism. Traders however should not pre-empt any
reversal as other technical indicators have not shown any
divergence from the broader uptrend. Thus, going by the Dow
Theory tenet - “Trend is your friend”, positional traders should
continue to trade with a positive bias until there is a pronounced
confirmation of the trend reversal supported by a wider number
of indicators.
In the near term, the immediate support for the Nifty is placed
around 8572 and only its breach could possibly result in a loss
in the upward momentum. In the last three trading sessions, the
bulls have vehemently tried to surpass the 8675 mark on the
Nifty. We see a higher probability of the index surpassing the
mark and reaching its next resistance zone of 8750 - 8800.
Key Levels
Support 1 - 8600
Resistance 1 - 8675
Support 2 - 8572
Resistance 2 - 8750
Nifty Bank Outlook - (18953)
Exhibit 2: Nifty Bank Daily Chart
In Friday's trading session, the Nifty index opened marginally
higher. However, the bulls were unable to continue the previous
day's momentum and the index ended the session with loss of
0.56 percent over its previous day's close.
The up move of last three weeks in the Nifty Bank index too has
led to formation of a 'Rising Wedge' pattern on the daily charts.
However, other technical indicator are in sync with the broader
uptrend and hence, traders are advise not to pre-empt any
reversal unless there is confirmation of the same. In near tern, the
support for the index is placed around 18800 and only breach of
this support will lead to loss of the ongoing positive momentum.
Till then, traders are advise to trade with positive bias and trade
on stock specific opportunities with proper risk management. The
near term support for the index is placed around 18800 and
18690 whereas resistances are seen around 19158 and 19229.
Key Levels
Support 1 - 18800
Resistance 1 - 19158
Support 2 - 18690
Resistance 2 - 19229
1
Technical & Derivatives Report
August 01, 2016
Comments
Nifty Vs OI
The Nifty futures open interest has increased by 1.81%
BankNifty futures open interest has increased by 1.79%
as market closed at 8638.50 levels.
The Nifty August future closed with a premium of 48.10
points against a premium of 35.60 points in previous
session. The September series closed at a premium of
96.65 points.
The Implied Volatility of at the money options has
decreased from 13.84% to 13.75%.
The total OI of the market is Rs. 2,06,385/- cr. and the
stock futures OI is Rs. 68,427/- cr.
Few of the liquid counters where we have seen high cost
of carry are TV18BRDCST, PTC, ARVIND, JSWENERGY
and ICIL.
Views
OI Gainers
FIIs activity in cash market segment remained subdued.
OI
PRICE
While, they were marginal buyers of Rs. 85 crores in
SCRIP
OI
PRICE
CHG. (%)
CHG. (%)
Index Futures with rise in open interest, suggesting blend
AMARAJABAT
685800
22.64
943.30
4.60
of long and short formation in last trading session.
WOCKPHARMA
2755200
18.66
1015.80
1.75
In Index Options segment, FIIs bought significantly of
LT
6402500
18.31
1551.25
-1.07
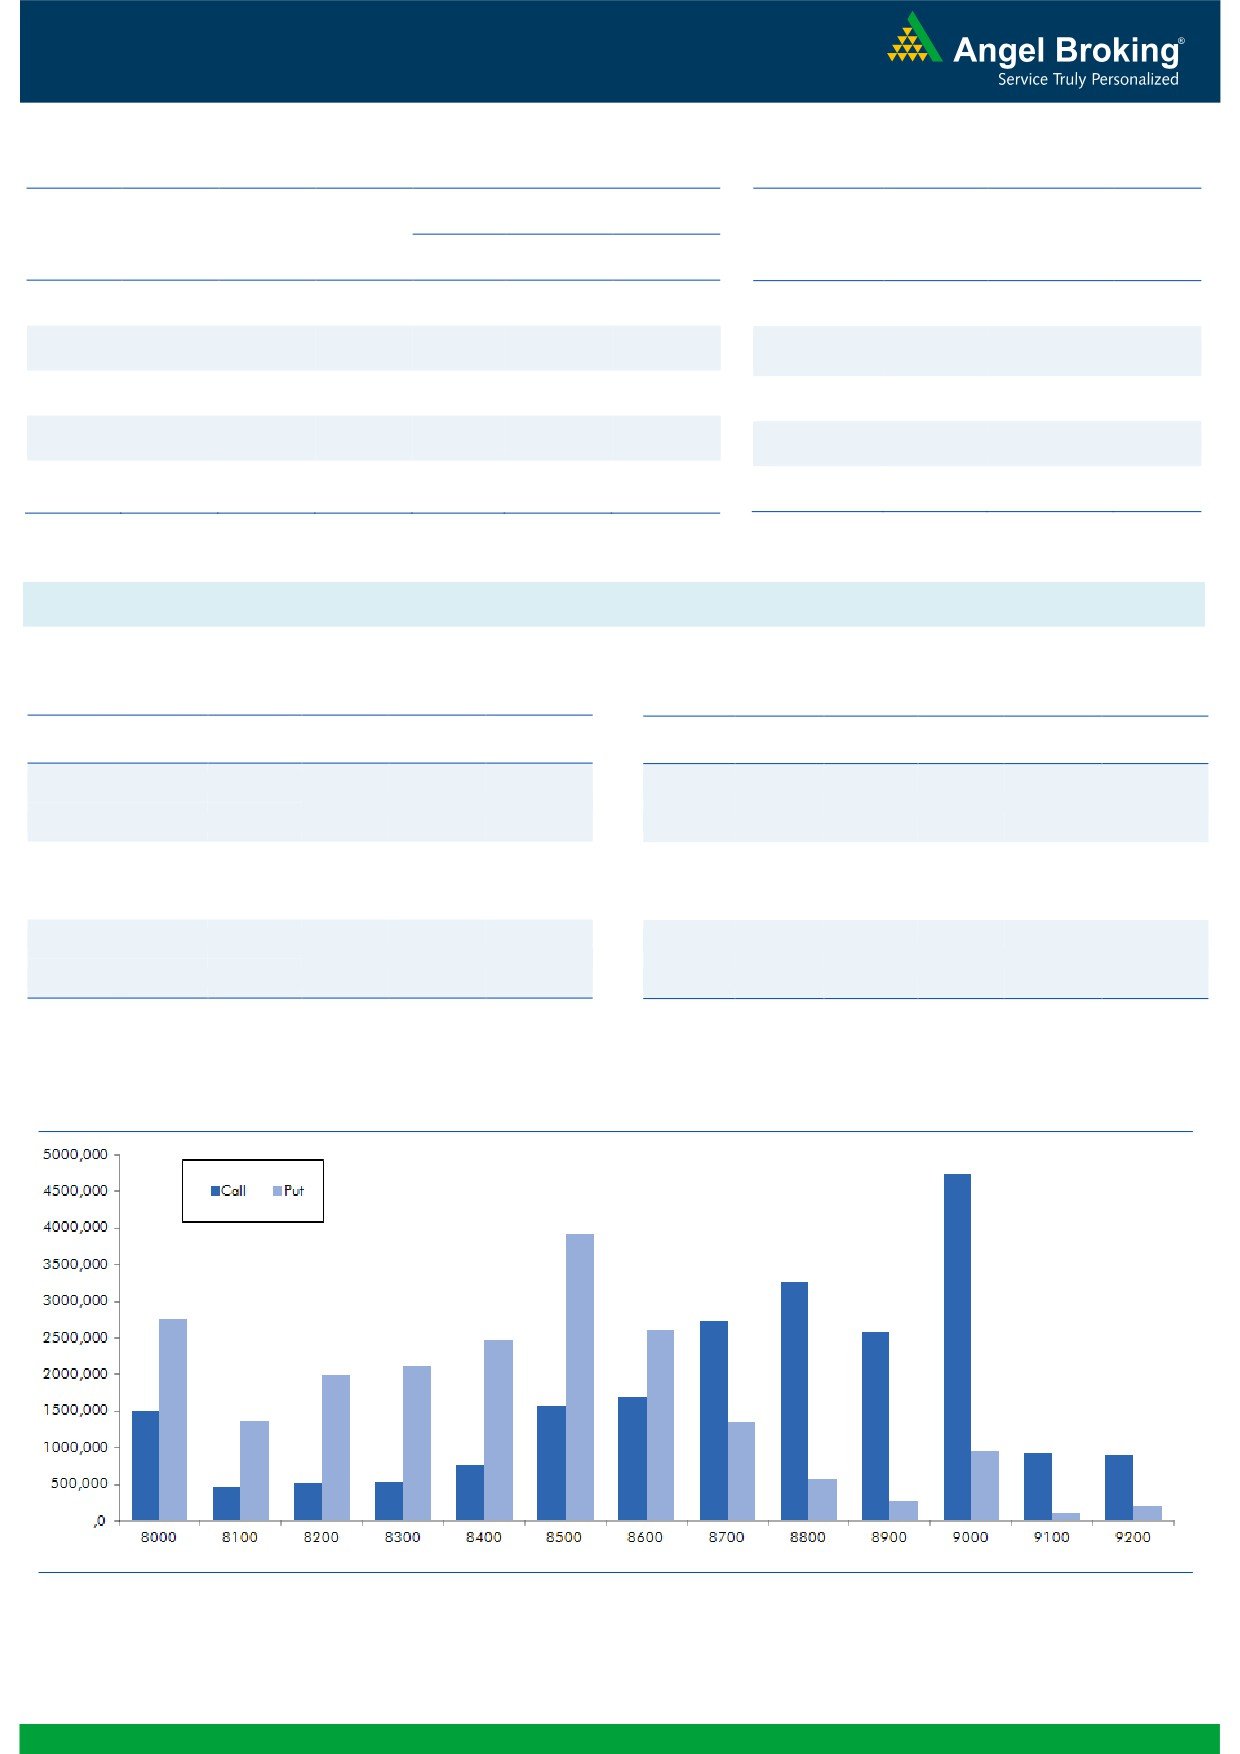
worth Rs. 1393 crores with rise in OI. In call options,
8700-9000 strikes were active and they also added
PIDILITIND
1875000
15.17
735.55
-2.92
some fresh open interest. On the other hand in put
CONCOR
423000
14.63
1512.30
2.28
options, some build-up was visible in 8600 and 8700
strike. Highest buildup in August series is placed at 9000
OI Losers
call and 8500 put options.
OI
PRICE
SCRIP
OI
PRICE
Rollover in Nifty is on the lower side in terms of
CHG. (%)
CHG. (%)
percentage; but, is high if open interest is considered.
M&MFIN
13237500
-5.16
332.50
2.81
Last series we saw huge long formation and we believe
BEML
1022500
-4.71
1016.45
0.47
some longs are still intact. Seeing the above data, we
KOTAKBANK
6736000
-4.33
766.75
1.81
believe we may see Nifty testing 8750-8800 levels.
HAVELLS
4310000
-3.97
390.85
2.08
Traders are suggested to start booking profits near these
ANDHRABANK
15170000
-3.74
60.35
0.75
levels.
Historical Volatility
Put-Call Ratio
SCRIP
HV
SCRIP
PCR-OI
PCR-VOL
DISHTV
57.90
NIFTY
0.94
1.01
EICHERMOT
39.02
BANKNIFTY
0.85
0.92
AMARAJABAT
33.85
ICICIBANK
0.55
0.59
BATAINDIA
33.97
LT
0.77
0.74
RELINFRA
44.61
DRREDDY
0.24
0.30
Strategy Date
Symbol
Strategy
Status
2
Technical & Derivatives Report
August 01, 2016
FII Statistics for 29-July 2016
Turnover on 29-July 2016
Open Interest
No. of
Turnover
Change
Detail
Buy
Sell
Net
Instrument
Value
Contracts
( in Cr. )
(%)
Contracts
Change (%)
(in Cr.)
INDEX
INDEX
2058.52
1973.91
84.61
285472
18895.42
1.25
161086
11039.23
-60.49
FUTURES
FUTURES
INDEX
INDEX
22104.82
20711.96
1392.87
758213
49449.35
7.18
1600023
110550.26
-81.12
OPTIONS
OPTIONS
STOCK
5008.79
5874.63
(865.84)
777349
50757.02
2.18
STOCK
FUTURES
571069
40184.91
-61.31
FUTURES
STOCK
STOCK
2609.15
2602.00
7.15
21974
1457.39
1149.23
OPTIONS
260001
18687.92
-55.95
OPTIONS
TOTAL
31781.28
31162.49
618.79
1843008
120559.18
5.20
TOTAL
2592179
180462.33
-76.25
Nifty Spot = 8638.50
Lot Size = 75
Bull-Call Spreads
Bear-Put Spreads
Action
Strike
Price
Risk
Reward
BEP
Action
Strike
Price
Risk
Reward
BEP
Buy
8700
122.15
Buy
8700
135.00
44.15
55.85
8744.15
41.45
58.55
8658.55
Sell
8800
78.00
Sell
8600
93.55
Buy
8700
122.15
Buy
8700
135.00
76.10
123.90
8776.10
71.75
128.25
8628.25
Sell
8900
46.05
Sell
8500
63.25
Buy
8800
78.00
Buy
8600
93.55
31.95
68.05
8831.95
30.30
69.70
8569.70
Sell
8900
46.05
Sell
8500
63.25
Note: Above mentioned Bullish or Bearish Spreads in Nifty (August Series) are given as an information and not as a recommendation.
Nifty Put-Call Analysis
3
Technical & Derivatives Report
August 01, 2016
Daily Pivot Levels for Nifty Constituents
Scrips
S2
S1
PIVOT
R1
R2
ACC
1,638
1,664
1,691
1,716
1,743
ADANIPORTS
223
228
231
235
238
AMBUJACEM
266
269
272
274
278
ASIANPAINT
1,083
1,098
1,118
1,134
1,153
AUROPHARMA
773
782
790
800
808
AXISBANK
538
542
547
551
556
BAJAJ-AUTO
2,631
2,666
2,695
2,730
2,759
BANKBARODA
149
150
153
154
157
BHEL
143
144
147
148
151
BPCL
576
585
591
599
605
BHARTIARTL
353
358
365
369
376
INFRATEL
387
391
396
401
406
BOSCH
24,565
24,771
24,956
25,162
25,347
CIPLA
512
520
528
535
543
COALINDIA
322
325
330
332
337
DRREDDY
2,894
2,915
2,946
2,967
2,998
EICHERMOT
21,168
21,815
22,167
22,814
23,166
GAIL
376
379
383
386
390
GRASIM
4,803
4,849
4,883
4,929
4,963
HCLTECH
740
746
752
759
765
HDFCBANK
1,229
1,237
1,244
1,252
1,259
HDFC
1,350
1,362
1,385
1,397
1,420
HEROMOTOCO
3,138
3,171
3,207
3,240
3,276
HINDALCO
130
132
134
135
137
HINDUNILVR
894
908
917
931
939
ICICIBANK
256
260
265
269
275
IDEA
103
104
105
106
107
INDUSINDBK
1,160
1,168
1,176
1,184
1,193
INFY
1,062
1,068
1,072
1,078
1,083
ITC
248
250
253
256
259
KOTAKBANK
743
753
760
770
777
LT
1,524
1,541
1,567
1,585
1,611
LUPIN
1,685
1,712
1,731
1,759
1,777
M&M
1,439
1,453
1,466
1,480
1,494
MARUTI
4,664
4,711
4,767
4,814
4,871
NTPC
156
157
158
160
161
ONGC
217
219
221
223
226
POWERGRID
173
175
176
177
179
RELIANCE
1,005
1,010
1,018
1,023
1,031
SBIN
226
228
230
232
234
SUNPHARMA
811
820
830
840
849
TCS
2,582
2,601
2,618
2,636
2,654
TATAMTRDVR
317
320
326
329
335
TATAMOTORS
496
499
505
509
514
TATAPOWER
70
71
72
73
74
TATASTEEL
347
351
355
359
363
TECHM
479
483
487
492
495
ULTRACEMCO
3,640
3,679
3,709
3,748
3,779
WIPRO
537
541
547
551
557
YESBANK
1,194
1,205
1,221
1,232
1,248
ZEEL
471
484
492
505
514
4
Technical & Derivatives Report
August 01, 2016
Research Team Tel: 022 - 39357800
For Technical Queries
For Derivatives Queries
DISCLAIMER
Angel Broking Private Limited (hereinafter referred to as “Angel”) is a registered Member of National Stock Exchange of India Limited,
Bombay Stock Exchange Limited and Metropolitan Stock Exchange Limited. It is also registered as a Depository Participant with CDSL
and Portfolio Manager with SEBI. It also has registration with AMFI as a Mutual Fund Distributor. Angel Broking Private Limited is a
registered entity with SEBI for Research Analyst in terms of SEBI (Research Analyst) Regulations, 2014 vide registration number
INH000000164. Angel or its associates has not been debarred/ suspended by SEBI or any other regulatory authority for accessing
/dealing in securities Market. Angel or its associates/analyst has not received any compensation / managed or co-managed public
offering of securities of the company covered by Analyst during the past twelve months.
This document is solely for the personal information of the recipient, and must not be singularly used as the basis of any investment
decision. Nothing in this document should be construed as investment or financial advice. Each recipient of this document should
make such investigations as they deem necessary to arrive at an independent evaluation of an investment in the securities of the
companies referred to in this document (including the merits and risks involved), and should consult their own advisors to determine
the merits and risks of such an investment.
Reports based on technical and derivative analysis center on studying charts of a stock's price movement, outstanding positions and
trading volume, as opposed to focusing on a company's fundamentals and, as such, may not match with a report on a company's
fundamentals. Investors are advised to refer the Fundamental and Technical Research Reports available on our website to evaluate the
contrary view, if any.
The information in this document has been printed on the basis of publicly available information, internal data and other reliable
sources believed to be true, but we do not represent that it is accurate or complete and it should not be relied on as such, as this
document is for general guidance only. Angel Broking Pvt. Limited or any of its affiliates/ group companies shall not be in any way
responsible for any loss or damage that may arise to any person from any inadvertent error in the information contained in this report.
Angel Broking Pvt. Limited has not independently verified all the information contained within this document. Accordingly, we cannot
testify, nor make any representation or warranty, express or implied, to the accuracy, contents or data contained within this document.
While Angel Broking Pvt. Limited endeavors to update on a reasonable basis the information discussed in this material, there may be
regulatory, compliance, or other reasons that prevent us from doing so.
This document is being supplied to you solely for your information, and its contents, information or data may not be reproduced,
redistributed or passed on, directly or indirectly.
Neither Angel Broking Pvt. Limited, nor its directors, employees or affiliates shall be liable for any loss or damage that may arise from
or in connection with the use of this information.
5