Technical & Derivatives Report
March 01, 2016
Sensex (23002) / Nifty (6987)
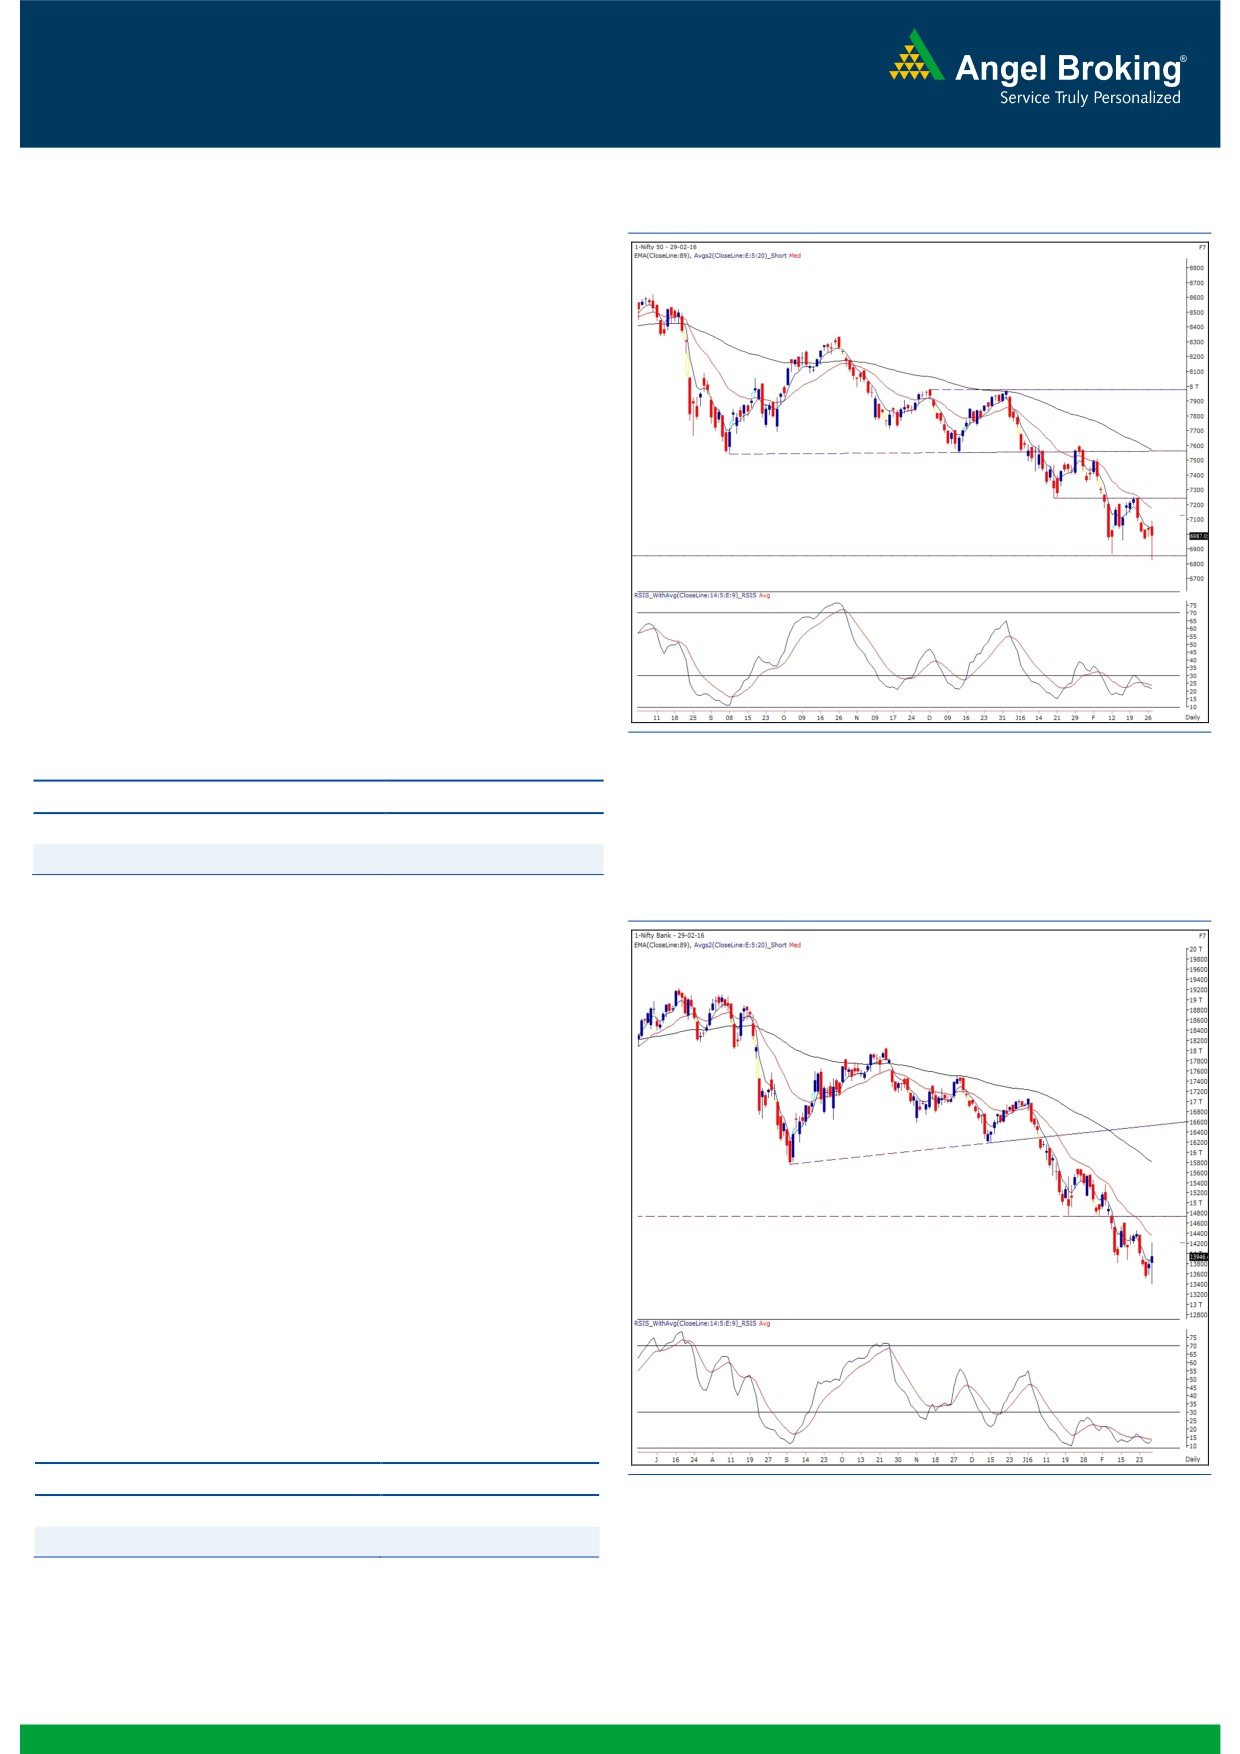
Exhibit 1: Nifty Daily Chart
Yesterday’s session opened marginally higher taking cues
from the SGX Nifty. The Index consolidated a bit as the Union
Budget announcement started and within no time, the Nifty
took a complete nosedive to even breach the recent low of
6869. However, this was followed by a v-shaped recovery
immediately post the midsession by adding more than 250
points from the low. Due to some profit booking in the
penultimate hour, the Nifty eventually ended the session with a
cut of 0.61%.
Yesterday’s violation of recent swing low on intraday basis led
to a confirmation of a positive divergence in ‘RSI-Smoothened’
oscillator on the daily chart. This development has a positive
implication and we would reiterate our view that traders
should refrain from aggressive shorting in the market. Going
forward, yesterday’s high of 7094.60 would now be seen as
immediate hurdle for the bulls. On the flipside, 6970 would
act as an important support level on a closing basis.
Key Levels
Support 1 - 6970
Resistance 1 - 7053
Support 2 - 6920
Resistance 2 -
7095
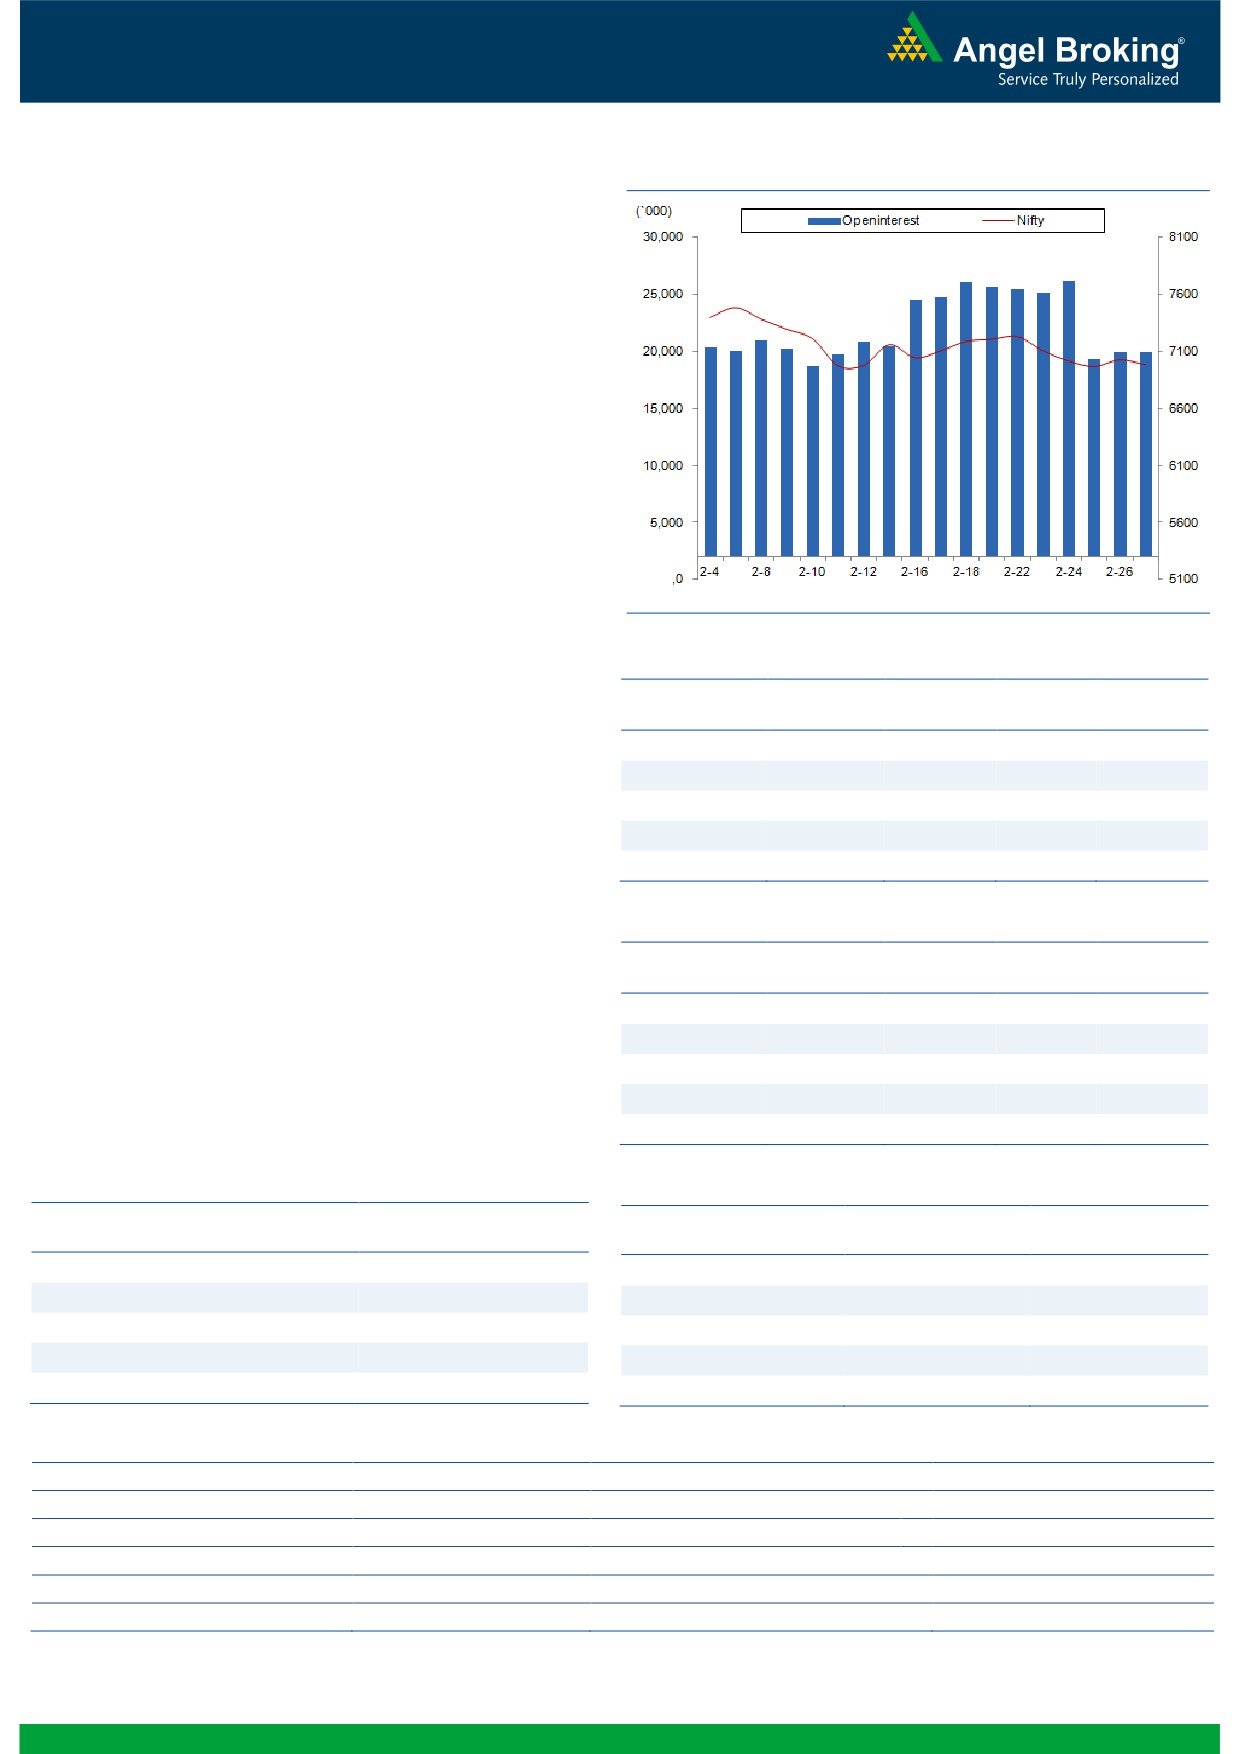
Exhibit 2: Bank Nifty Daily Chart
Bank Nifty Outlook - (13946)
In yesterday's trading session, the Nifty Bank index saw huge
volatility which was on expected lines due to the Union Budget
announcement.
On daily chart, yesterday's volatility has led to formation of a
'Spinning Top' candlestick pattern. The mentioned pattern is
formed where the range between opening and closing is small
despite of a wide range of price movement throughout the
day. This candle is often regarded as neutral and used to
signal indecision about the future direction. Hence, yesterday's
high of 14222 and low of 13407 in the index would now
become trend deciding levels and breach of either of those
can lead to a directional movement in the index. Traders are
thus advised to keep a tab on the mentioned levels and trade
in the direction of the breakout. The intraday support of the
index is placed around
13600 and
13407; whereas,
resistances are seen around 14222 and 14467.
Key Levels
Support 1 - 13600
Resistance 1 - 14222
Support 2 - 13407
Resistance 2 - 14467
1
Technical & Derivatives Report
March 01, 2016
Comments
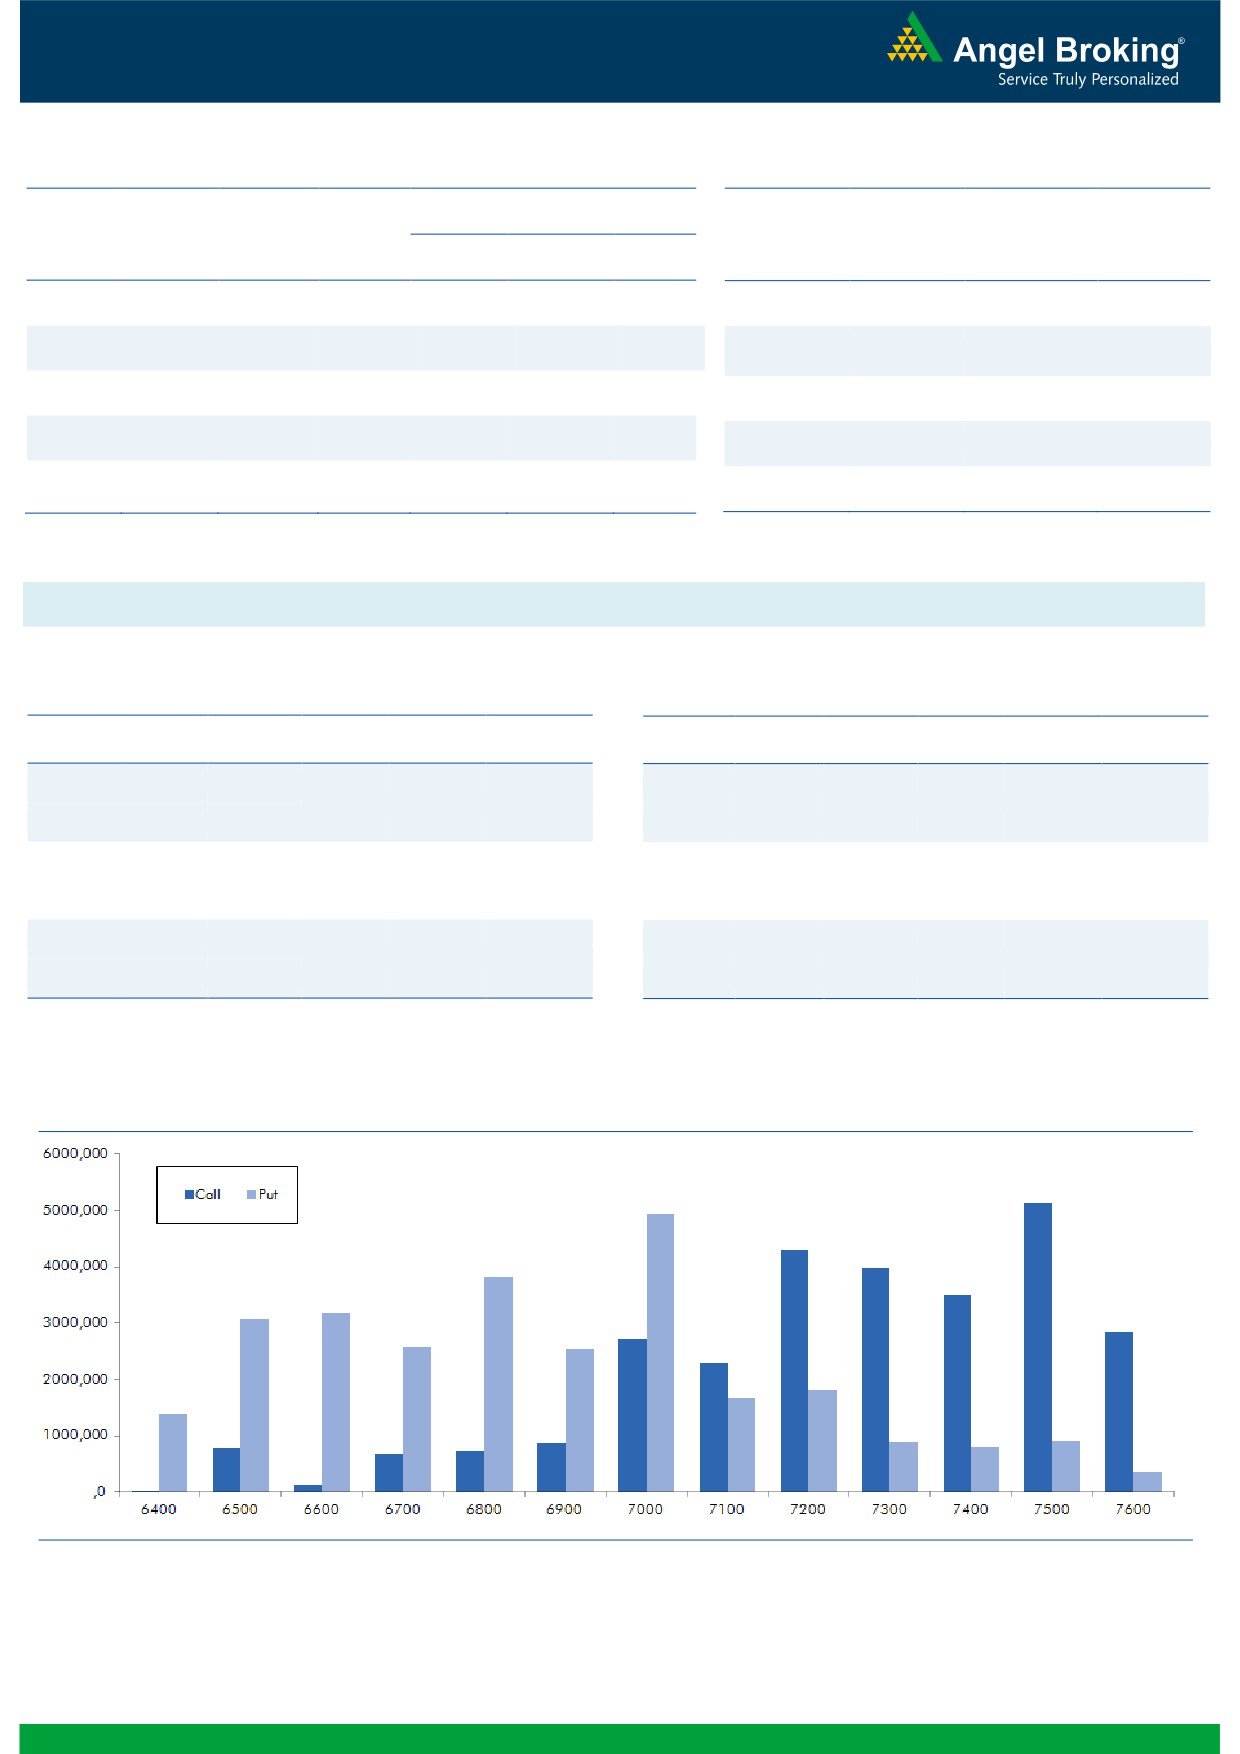
Nifty Vs OI
The Nifty futures open interest has decreased by 1.61%
BankNifty futures open interest has increased by 10.10%
as market closed at 6987.05 levels.
The Nifty March future closed at a premium of 21.90
points against a premium of 25.40 points. The April
series closed at a premium of 53.00 points.
The Implied Volatility of at the money options has
decreased from 19.64% to 19.04%.
The total OI of the market is Rs. 1,78,620/- cr. and the
stock futures OI is Rs. 51,152/- cr.
Few of the liquid counters where we have seen high cost
of carry are UNITECH, IDFC, GMRINFRA, IOC and
ADANIPOWER.
OI Gainers
Views
OI
PRICE
FIIs sold equities to the tune of Rs. 2018 crores. While in
SCRIP
OI
PRICE
CHG. (%)
CHG. (%)
Index Futures, they bought of worth Rs. 668 crores with
CUMMINSIND
40800
183.33
818.45
-2.54
fall in open interest, indicating short covering in last
PCJEWELLER
891800
77.72
313.80
-2.46
trading session.
ONGC
17318000
46.14
193.40
-9.33
In Index Options front, FIIs were marginal buyers with
ICIL
94500
33.10
832.15
0.29
significant rise in OI. In call options, 7200 and 7300
GRANULES
785000
33.05
107.00
-0.14
strikes were quite active and they also added fresh build-
up. Whereas, in put options, 6300, 6600 and 6800
OI Losers
strikes added some fresh build-up. Maximum OI in
OI
PRICE
current series is visible in 7500 call and 7000 put
SCRIP
OI
PRICE
CHG. (%)
CHG. (%)
options. From last two trading sessions, FIIs have been
RPOWER
50076000
-14.03
44.65
-0.33
net buyers in Index Futures, these is positive sign. We
ICICIBANK
59224600
-8.92
190.25
2.23
believe Nifty may show strength, trade with a positive
APOLLOTYRE
5100000
-8.16
158.35
1.64
bias.
PNB
32024000
-6.46
70.35
0.57
ENGINERSIN
3698200
-6.46
149.15
2.61
Historical Volatility
Put-Call Ratio
SCRIP
HV
SCRIP
PCR-OI
PCR-VOL
ONGC
67.81
NIFTY
0.81
0.72
MARUTI
43.43
BANKNIFTY
0.88
0.59
ARVIND
57.11
SBIN
0.57
0.42
INFY
31.74
ICICIBANK
0.55
0.44
WIPRO
25.59
MARUTI
0.40
0.41
Strategy Date
Symbol
Strategy
Status
Feruary 29, 2016
RELIANCE
Ratio Bull Call Spread
Active
2
Technical & Derivatives Report
March 01, 2016
FII Statistics for 29-February 2016
Turnover on 29-February 2016
Open Interest
No. of
Turnover
Change
Detail
Buy
Sell
Net
Instrument
Value
Change
Contracts
( in Cr. )
(%)
Contracts
(in Cr.)
(%)
INDEX
INDEX
3425.72
2757.72
668.00
222081
11084.51
(6.30)
690891
33460.19
127.12
FUTURES
FUTURES
INDEX
INDEX
63088.86
63055.00
33.86
945835
49158.66
9.69
5822028
303763.82
183.52
OPTIONS
OPTIONS
STOCK
6142.40
5513.35
629.05
1085667
45112.70
2.28
STOCK
FUTURES
788697
32761.15
71.78
FUTURES
STOCK
STOCK
3063.24
3097.48
(34.23)
28973
1174.37
48.44
OPTIONS
363584
15731.67
108.96
OPTIONS
TOTAL
75720.22
74423.54
1296.68
2282556
106530.25
4.69
TOTAL
7665200
385716.83
159.79
Nifty Spot = 6987.05
Lot Size = 75
Bull-Call Spreads
Bear-Put Spreads
Action
Strike
Price
Risk
Reward
BEP
Action
Strike
Price
Risk
Reward
BEP
Buy
7000
155.90
Buy
7000
148.80
48.65
51.35
7048.65
38.95
61.05
6961.05
Sell
7100
107.25
Sell
6900
109.85
Buy
7000
155.90
Buy
7000
148.80
86.40
113.60
7086.40
68.40
131.60
6931.60
Sell
7200
69.50
Sell
6800
80.40
Buy
7100
107.25
Buy
6900
109.85
37.75
62.25
7137.75
29.45
70.55
6870.55
Sell
7200
69.50
Sell
6800
80.40
Note: Above mentioned Bullish or Bearish Spreads in Nifty (March Series) are given as an information and not as a recommendation.
Nifty Put-Call Analysis
3
Technical & Derivatives Report
March 01, 2016
Daily Pivot Levels for Nifty 50 Stocks
Scrips
S2
S1
PIVOT
R1
R2
ACC
1,159
1,176
1,192
1,209
1,225
ADANIPORTS
191
194
199
202
207
AMBUJACEM
181
185
188
192
195
ASIANPAINT
825
835
852
863
880
AXISBANK
363
369
380
387
398
BAJAJ-AUTO
2,118
2,159
2,214
2,255
2,310
BANKBARODA
121
126
133
138
145
BHARTIARTL
308
312
317
321
326
BHEL
86
89
93
95
99
BOSCHLTD
15,930
16,333
16,780
17,184
17,631
BPCL
718
744
766
792
814
CAIRN
105
111
120
127
135
CIPLA
493
503
516
526
539
COALINDIA
300
306
312
317
323
DRREDDY
2,932
2,984
3,030
3,082
3,128
GAIL
281
293
302
315
324
GRASIM
3,207
3,267
3,314
3,375
3,422
HCLTECH
777
795
813
832
850
HDFC
997
1,029
1,054
1,085
1,110
HDFCBANK
906
939
961
994
1,015
HEROMOTOCO
2,418
2,459
2,512
2,553
2,606
HINDALCO
65
67
69
71
73
HINDUNILVR
807
819
835
847
863
ICICIBANK
175
183
189
197
203
IDEA
101
103
104
106
108
INDUSINDBK
786
808
824
846
861
INFY
1,032
1,058
1,094
1,120
1,156
ITC
255
275
288
309
322
KOTAKBANK
564
597
619
652
673
LT
1,014
1,045
1,084
1,115
1,155
LUPIN
1,662
1,708
1,742
1,788
1,822
M&M
1,183
1,206
1,237
1,260
1,291
MARUTI
3,047
3,142
3,288
3,383
3,530
NTPC
116
118
120
122
124
ONGC
174
184
203
213
231
PNB
67
69
72
74
77
POWERGRID
126
128
131
133
136
RELIANCE
906
936
965
996
1,025
SBIN
148
153
159
164
169
VEDL
65
68
72
75
80
SUNPHARMA
809
831
856
879
903
TATAMOTORS
283
291
299
307
314
TATAPOWER
55
56
57
58
59
TATASTEEL
234
242
253
260
271
TCS
2,054
2,116
2,176
2,238
2,298
TECHM
399
407
416
424
432
ULTRACEMCO
2,616
2,692
2,766
2,842
2,916
WIPRO
496
508
520
532
544
YESBANK
645
667
685
708
726
ZEEL
355
363
373
382
392
4
Technical & Derivatives Report
March 01, 2016
Research Team Tel: 022 - 39357800
For Technical Queries
For Derivatives Queries
DISCLAIMER
Angel Broking Private Limited (hereinafter referred to as “Angel”) is a registered Member of National Stock Exchange of India Limited,
Bombay Stock Exchange Limited and MCX Stock Exchange Limited. It is also registered as a Depository Participant with CDSL and
Portfolio Manager with SEBI. It also has registration with AMFI as a Mutual Fund Distributor. Angel Broking Private Limited is a
registered entity with SEBI for Research Analyst in terms of SEBI (Research Analyst) Regulations, 2014 vide registration number
INH000000164. Angel or its associates has not been debarred/ suspended by SEBI or any other regulatory authority for accessing
/dealing in securities Market. Angel or its associates including its relatives/analyst do not hold any financial interest/beneficial
ownership of more than 1% in the company covered by Analyst. Angel or its associates/analyst has not received any compensation /
managed or co-managed public offering of securities of the company covered by Analyst during the past twelve months. Angel/analyst
has not served as an officer, director or employee of company covered by Analyst and has not been engaged in market making activity
of the company covered by Analyst.
This document is solely for the personal information of the recipient, and must not be singularly used as the basis of any investment
decision. Nothing in this document should be construed as investment or financial advice. Each recipient of this document should
make such investigations as they deem necessary to arrive at an independent evaluation of an investment in the securities of the
companies referred to in this document (including the merits and risks involved), and should consult their own advisors to determine
the merits and risks of such an investment.
Reports based on technical and derivative analysis center on studying charts of a stock's price movement, outstanding positions and
trading volume, as opposed to focusing on a company's fundamentals and, as such, may not match with a report on a company's
fundamentals.
The information in this document has been printed on the basis of publicly available information, internal data and other reliable
sources believed to be true, but we do not represent that it is accurate or complete and it should not be relied on as such, as this
document is for general guidance only. Angel Broking Pvt. Limited or any of its affiliates/ group companies shall not be in any way
responsible for any loss or damage that may arise to any person from any inadvertent error in the information contained in this report.
Angel Broking Pvt. Limited has not independently verified all the information contained within this document. Accordingly, we cannot
testify, nor make any representation or warranty, express or implied, to the accuracy, contents or data contained within this document.
While Angel Broking Pvt. Limited endeavors to update on a reasonable basis the information discussed in this material, there may be
regulatory, compliance, or other reasons that prevent us from doing so.
This document is being supplied to you solely for your information, and its contents, information or data may not be reproduced,
redistributed or passed on, directly or indirectly.
Neither Angel Broking Pvt. Limited, nor its directors, employees or affiliates shall be liable for any loss or damage that may arise from
or in connection with the use of this information.
Note: Please refer to the important ‘Stock Holding Disclosure' report on the Angel website (Research Section). Also, please refer to the
latest update on respective stocks for the disclosure status in respect of those stocks. Angel Broking Pvt. Limited and its affiliates may
have investment positions in the stocks recommended in this report.
5